Wizard
Use the Wizard to quickly and easily create and modify data selection: the Wizard is integrated into the Pivot Table and Featured Values layouts but can also be added as a separate widget using the Widgets Panel. See how to display the wizard.
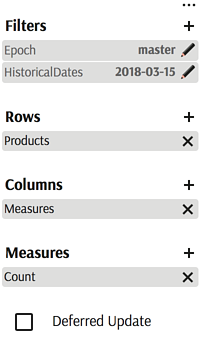
If you are familiar with the PivotTable Builder in Excel, you will recognize the Wizard's four main areas:
Filters: Allows you to limit the data subset through conditions on dimensions, for example, by selecting a specific date, country, top contributors, etc. Read more about Filters.
Rows: The list of hierarchies that should be displayed on rows.
Columns: The list of hierarchies that should be displayed on columns.
Measures: Select the measures of interest. You do not need to define an aggregation rule, e.g. sum or count, since it is already configured in ActivePivot.
Quick start
Here's how to easily create your first query using the Wizard:
- Add a new Pivot Table
- Click
+next to Measures to select some measures from the cube. The widget will display the total value for the selected measures. - Remove the default measure
contributors.COUNTfrom the view. - Click
+next to Rows to select a breakdown of interest, any dimension. - You are done with your first query.
Try transposing the data, by dragging dimensions from Rows to Columns or dragging the "Measures" label from Columns to Rows.
Wizard features
- Bring dimensions and measures into the view by clicking
+or dragging them into the Wizard from the Data Explorer (see below example). - Remove them from the view by clicking on the cross.
- Define Filters
- Enable Deferred Update.
- Hide and show wizard in a Pivot Table
- Create a calculated measure using the Formula Editor
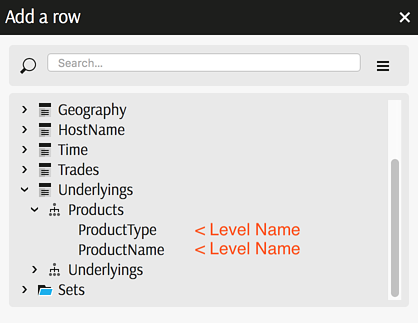
Data drag and drop
You may prefer to explore your data structure in the Data Explorer and then drag and drop items into the data presentation widget:
Controlling Subtotals
Users will have a greater control over subtotals using hierarchies only (not levels) and showing/hiding sub-totals with the pivot table context menu.
Dragging a level or a hierarchy from the Data Explorer will impact the displayed sub totals, as mentioned below:
To show subtotals, drag a hierarchy into the rows or columns axis. A default member of the hierarchy that corresponds to the total of all members is added in the view.
To hide subtotals, drag a level into the rows or columns axis. Once a level is dragged, any dimension located before that level will lose their subtotals, and the grand total will be hidden as well. Find below an explanation:
Crossjoining two hierarchies (totals are displayed):
[AllMember, A, B]
* [AllMember, C, D] =
[
    (AllMember, AllMember),   // <--- Grand Total
    (A, AllMember),           // <--- Sub Total
    (A, C),
    (A, D),
    (B, AllMember),           // <--- Sub Total
    (B, C),
    (B, D),
]
Crossjoining a level with a hierarchy (totals are not displayed from the level and above):
[A, B]
* [AllMember, C, D] =
[
    (A, AllMember),           // <--- Sub Total
    (A, C),
    (A, D),
    (B, AllMember),           // <--- Sub Total
    (B, C),
    (B, D),
]
Crossjoining a hierarchy with a level (totals are not displayed from the level and above):
[AllMember, A, B]
* [C, D] =
[
    (A, C),
    (A, D),
    (B, C),
    (B, D),
]
Examples:
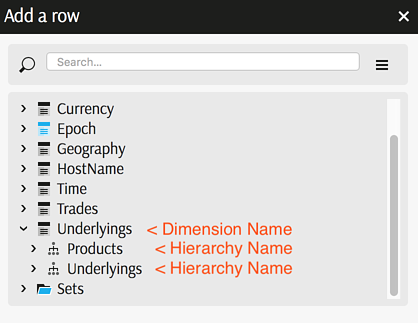
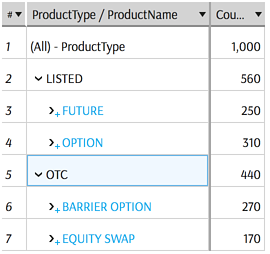
In this basic scenario, dimensions are added in the view by clicking on dimension name or hierarchy name:
In this case the query includes default members that correspond to subtotals for each aggregation level. There are subtotals for All ProductTypes in row 1 and for All ProductNames in each ProductType in row 2 and 5:
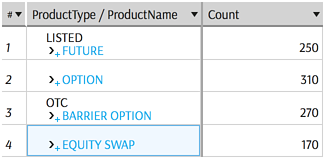
If a dimension is added by clicking on a level, subtotals are not displayed.
This is the result of adding a level. There are no subtotals for All ProductTypes and for All ProductNames:
Show Wizard
Wizard is built-in in the Pivot Table and Featured Values widgets.
Wizard as a separate widget can be added from the Widgets Panel:
- Display the Widget panel
- Find the Pivot Wizard Widget in the Query Editing section
- Drag it to the screen
- Activate the pivot table to be manipulated
- Hide the Widgets panel