Monitor Measures
Although examples on this page are non-exhaustive, they illustrate some of the ActiveMonitor key features and approaches both for end users and more technically advanced users.
-
Setting up a trigger that will notify users as soon as New York’s sales in GBP and EUR fall below 10000 and 15000 units respectively.
-
Setting up a monitor to watch a calculated measure (Gross Risk).
Tracking one measure against another measure
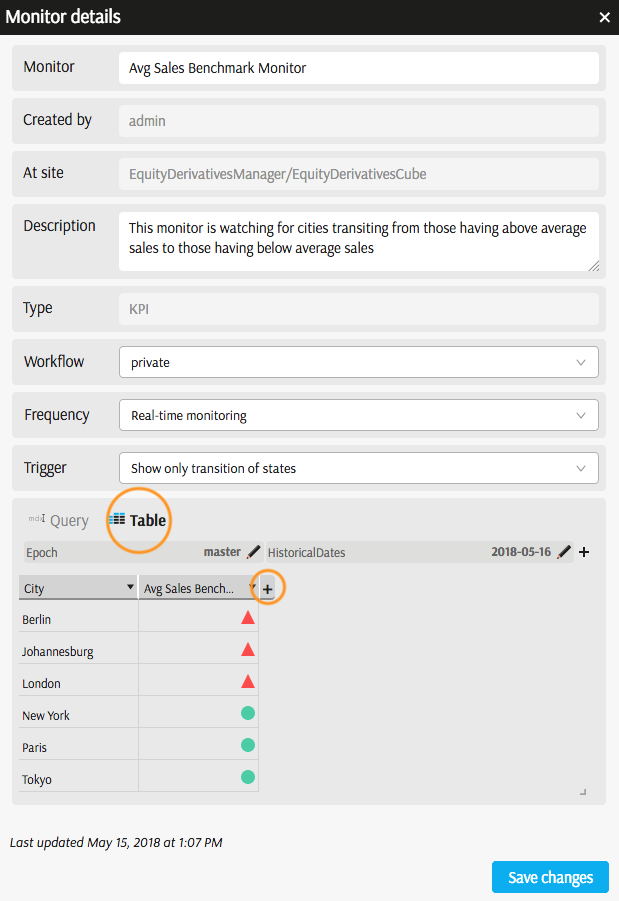
Alert needs to be sent when a city migrates from having “above the average” sales to “below the average” sales.
Looping over members in a hierarchy/level
When a rule should apply For Each member of a hierarchy.
-
When missing observation needs to be treated as an exception.
Slow-moving hierarchies (recommendation)
Simple KPI with rules
Let's assume, there is a requirement to setup a trigger that will notify users as soon as New York's sales in GBP and EUR fall below 10000 and 15000 units respectively.
How many KPIs, monitors and rules are required in this example?
- Since one measure needs to be tracked (sales) and one type of the critical interval ("sales ... fall below ...") is required - one KPI can handle the task.
- Since only one workflow - "notify users" - is required, then one Monitor is enough.
- Two benchmark values - 10000 and 15000 - may be set as two rules in the Rules Editor.
The workflow sending the notification needs to be pre-configured in the application by product development team.
Step 1. Create a KPI
Right-click on a cube and select "Create a KPI".
In this example, a KPI Sales Target is created with the following settings:
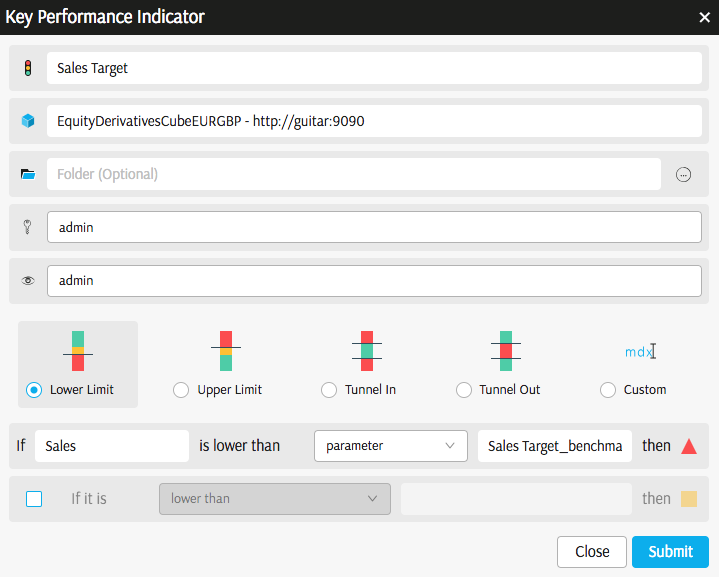
Follow this link to read more about creating a KPI.
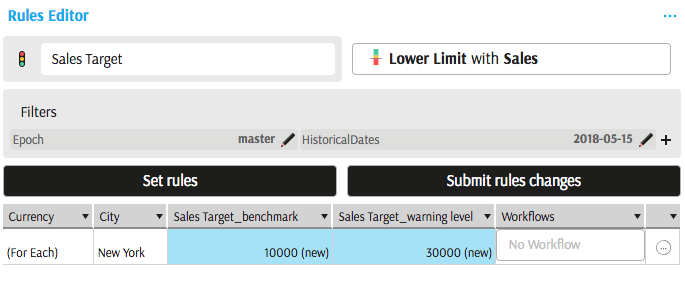
Step 2. Define rules
Using the Rules Editor, two new rules are defined, each having a filter on City New York and each of the currencies:
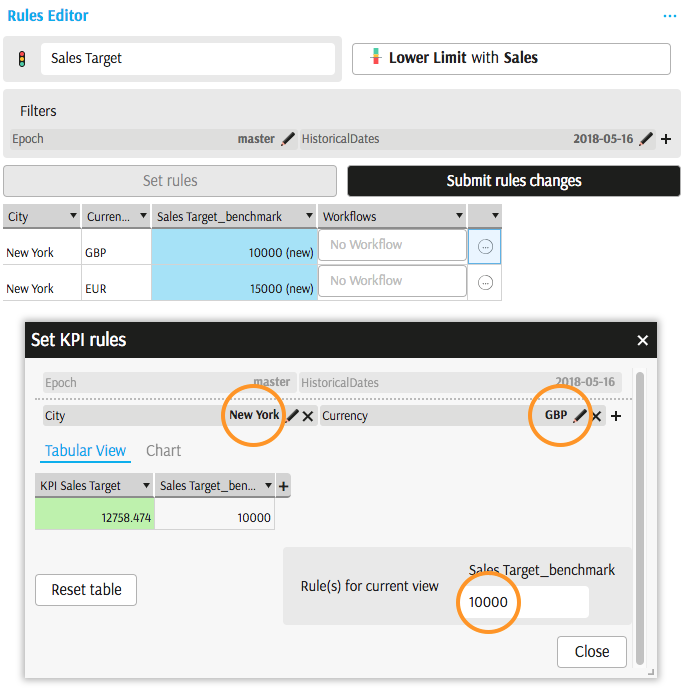
Click "Submit rules changes" button.
Follow this link to read more about creating Rules.
As a result, two new parameter values were created. They can be viewed in the Parameter List widget.
Step 3. Create a Monitor
As described here, Monitors are created automatically when Rules are linked to Workflows.
Assign each rule a workflow and click "Submit rules changes":
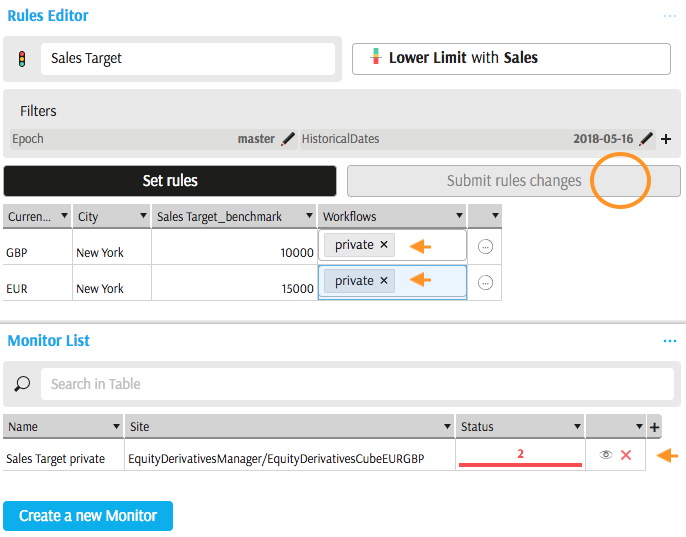
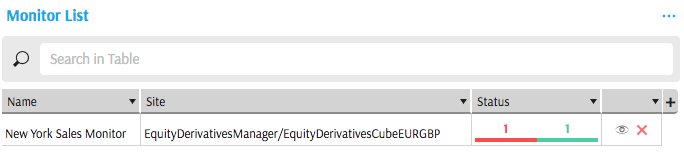
A Monitor is created automatically. You may replace the default monitor name (KPI Name + workflow name) with a business relevant title:
Step 4. Receive a notification
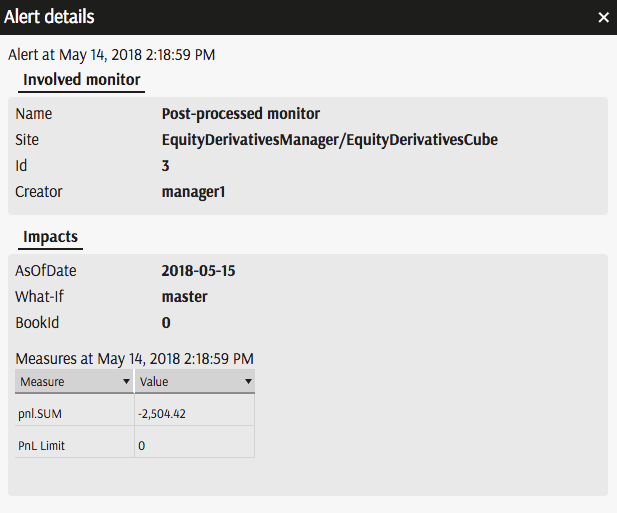
Depending on how the workflow is configured, you may receive notification messages and alerts, for example:
Watching a calculated measure
May be you need to setup a trigger based on a measure which does not exist in the cube, but you can compute it from the existing measures and dimensions.
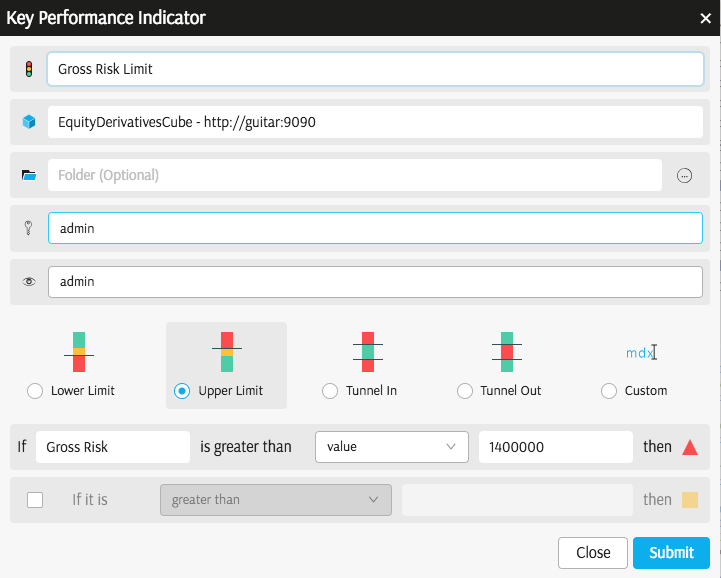
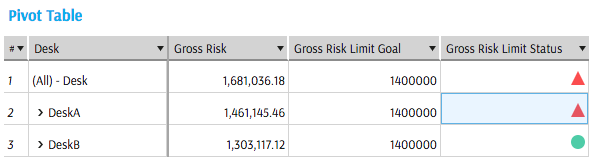
For example: Gross Risk should not be higher than 1.4mln for desks, where Gross Risk is defined as a sum of absolute deltas of individual counterparties.
Step 1. Publish the measure
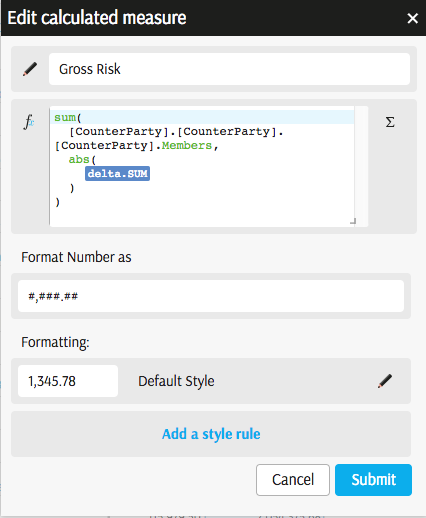
To link a KPI to a calculation, you need to publish the calculation into the cube using Formula Editor.
In this example, Gross Risk is a formula, computing the sum of individual counterparties' absolute exposures (delta.SUM).
Step 2. Link a KPI
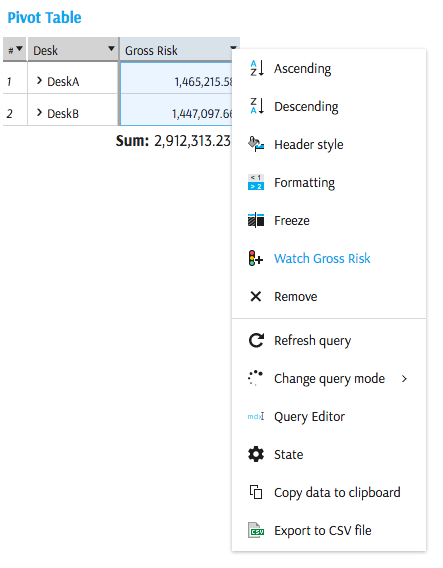
Once the Formula is published, you can either create a new KPI from the cube's context menu, or by selecting "Watch..." from the column's context menu:
You may reuse an Existing KPI (together with critical interval setting and potentially rules) or create a new one:
Finally, you can create a Monitor or view statuses in a Pivot:
Tracking one measure against another measure
KPI editor allows comparing one measure to another measure to generate an alert.
Let's assume, an alert needs to be sent when a city migrates from having "above the average" sales to "below the average" sales.
This example requires to publish a calculated measure, but may be in your case both measures are present in the cube - then you may skip the first step:
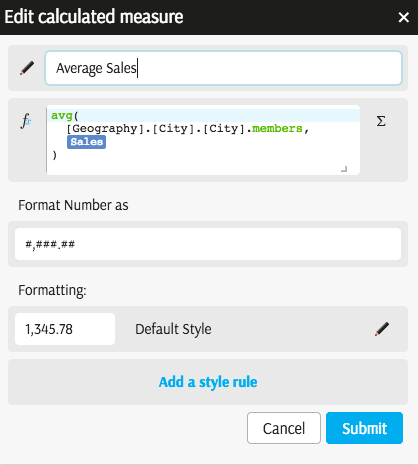
Step 1. Publish the measure
Publish a measure computing the average across cities:
Step 2. Create a KPI
Create a KPI based on Sales and let it be benchmarked against the Average Sales
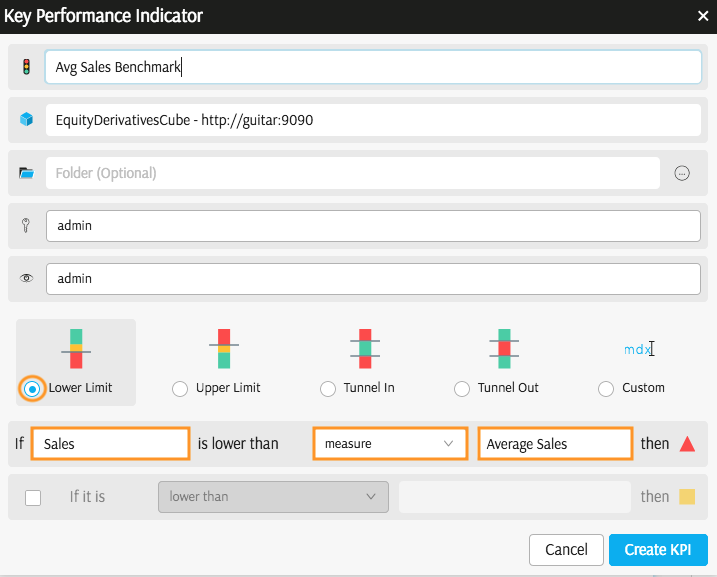
Follow this link to read more about creating a KPI.
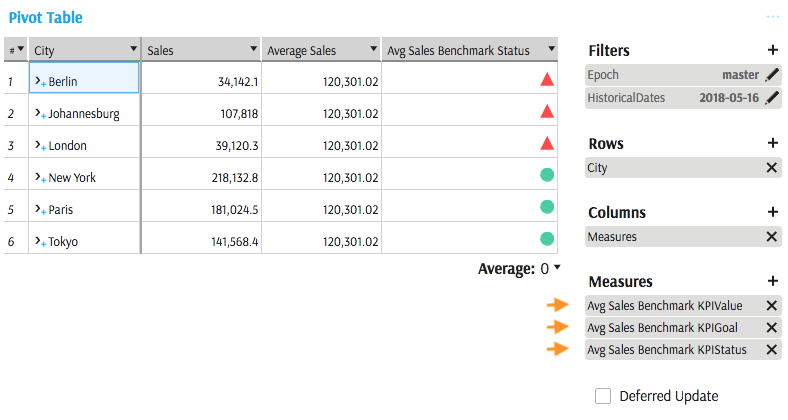
Once the KPI is created, you may drag the KPI Value, Goal and Status into a Pivot Table:
Step 3. Create a Monitor
Create a new monitor as described on the Monitor List page.
Select KPI Status and the necessary aggregation levels in the Monitor's table. In this case Avg Sales Benchmark Status and City:
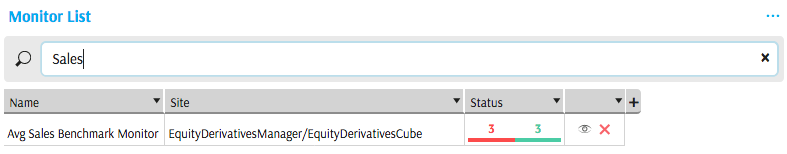
Once the monitor is created, it is listed in the Monitor List widget together with its status statistics:
Looping over members in a hierarchy/level
If a rule should apply to every member of a hierarchy/level, there is no need to create rules individually for each member. By adding a column with an aggregation level in the rule editor or monitor table, you refer to them as to "members", hence even if the composition of the list changes, the rule will apply to each of them.
Follow this link to read more: Creating a rule for each Member.
If there are several groups of members and several benchmark values you would like to apply, you may group members by creating a hierarchy (ask your product development team about creating hierarchies). Then you will be able to filter the members by the group and assign different benchmark values for different groups.
Custom MDX Status
By default an empty KPIValue is treated as zero when KPI Status is evaluated.
In some organisations, missing observation needs to raise an alert - you can configure this behaviour using a custom MDX.
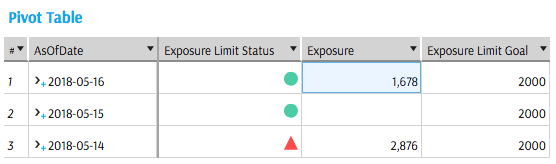
In the below illustration missing Exposure observation results in the red status of the KPI:
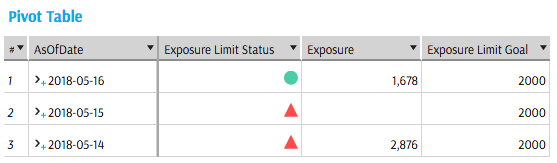
If the custom MDX was not defined, Null would not generate an alert since it is less than the Goal, this is default behaviour:
To configure a custom KPI Status definition,
- Create a New KPI
- Select desired critical interval type, for example, Upper Limit
- Select a measure which you would like to monitor, for example, Exposure
- Switch to MDX status definition by selecting the Custom critical interval.
- Select Status to start editing the underlying MDX.
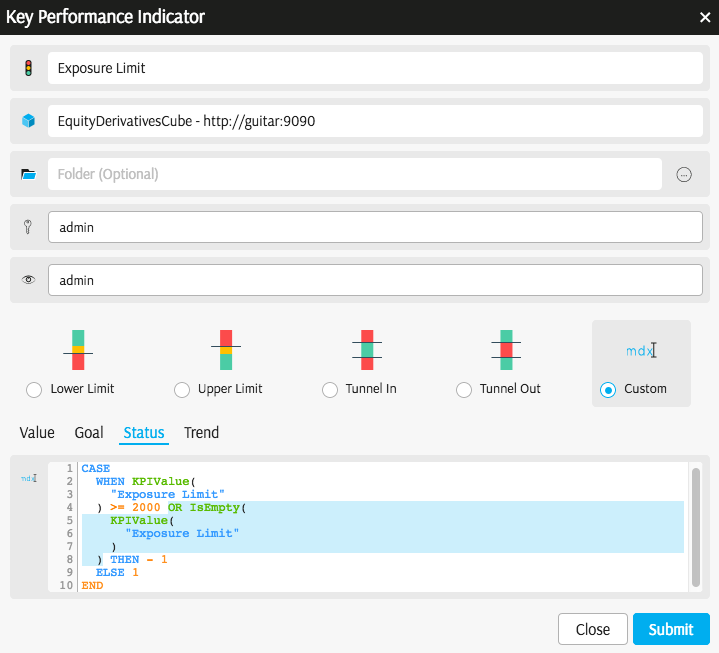
The isEmpty event needs to contribute to -1 status of the KPI (-1 is corresponding to red).
OR IsEmpty(
    KPIValue(
      "Exposure Limit"
    )
  )
Advanced users may experiment with MDX definitions of Value, Goal and Status using "Custom" critical interval type.
Slow moving hierarchies
This example is specific to finance domain where portfolio structure changes over time.
Nodes of a hierarchy (desks) may be used to define scopes in the rules editor. If a desk moves lower or higher in the hierarchy - the filter returns null. Hence the recommendation is to create an additional flat hierarchy, listing all the nodes. Using such a flat hierarchy makes the rules immune to desks moving lower or higher in a hierarchy.