Pivot Table
A Pivot Table displays aggregated data structured in a tree organized as logical hierarchies and levels. It allows you to expand and collapse level members to reveal their sub-totals and children.
Ask your product development team about setting up natural hierarchies for your daily use. Follow the link to read more about auto-expand.
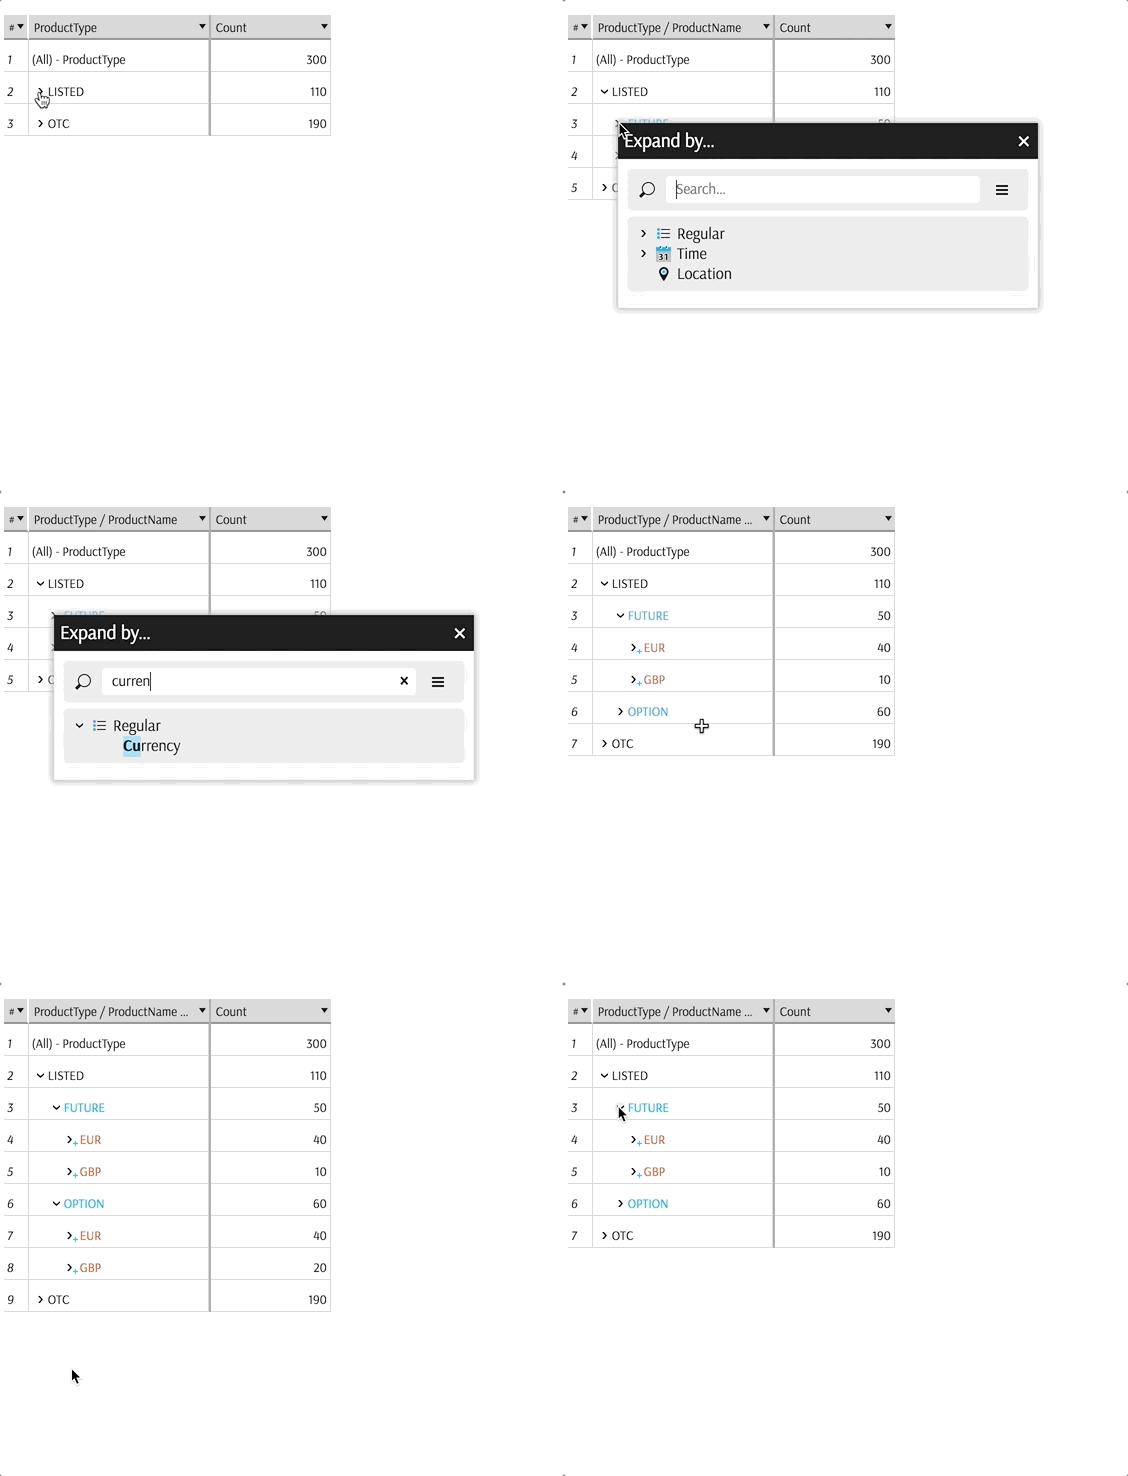
Adding a New Pivot
To add a new Pivot Table, use the widgets panel.
If there are multiple cubes connected to your application, you must select the cube you need for the table.
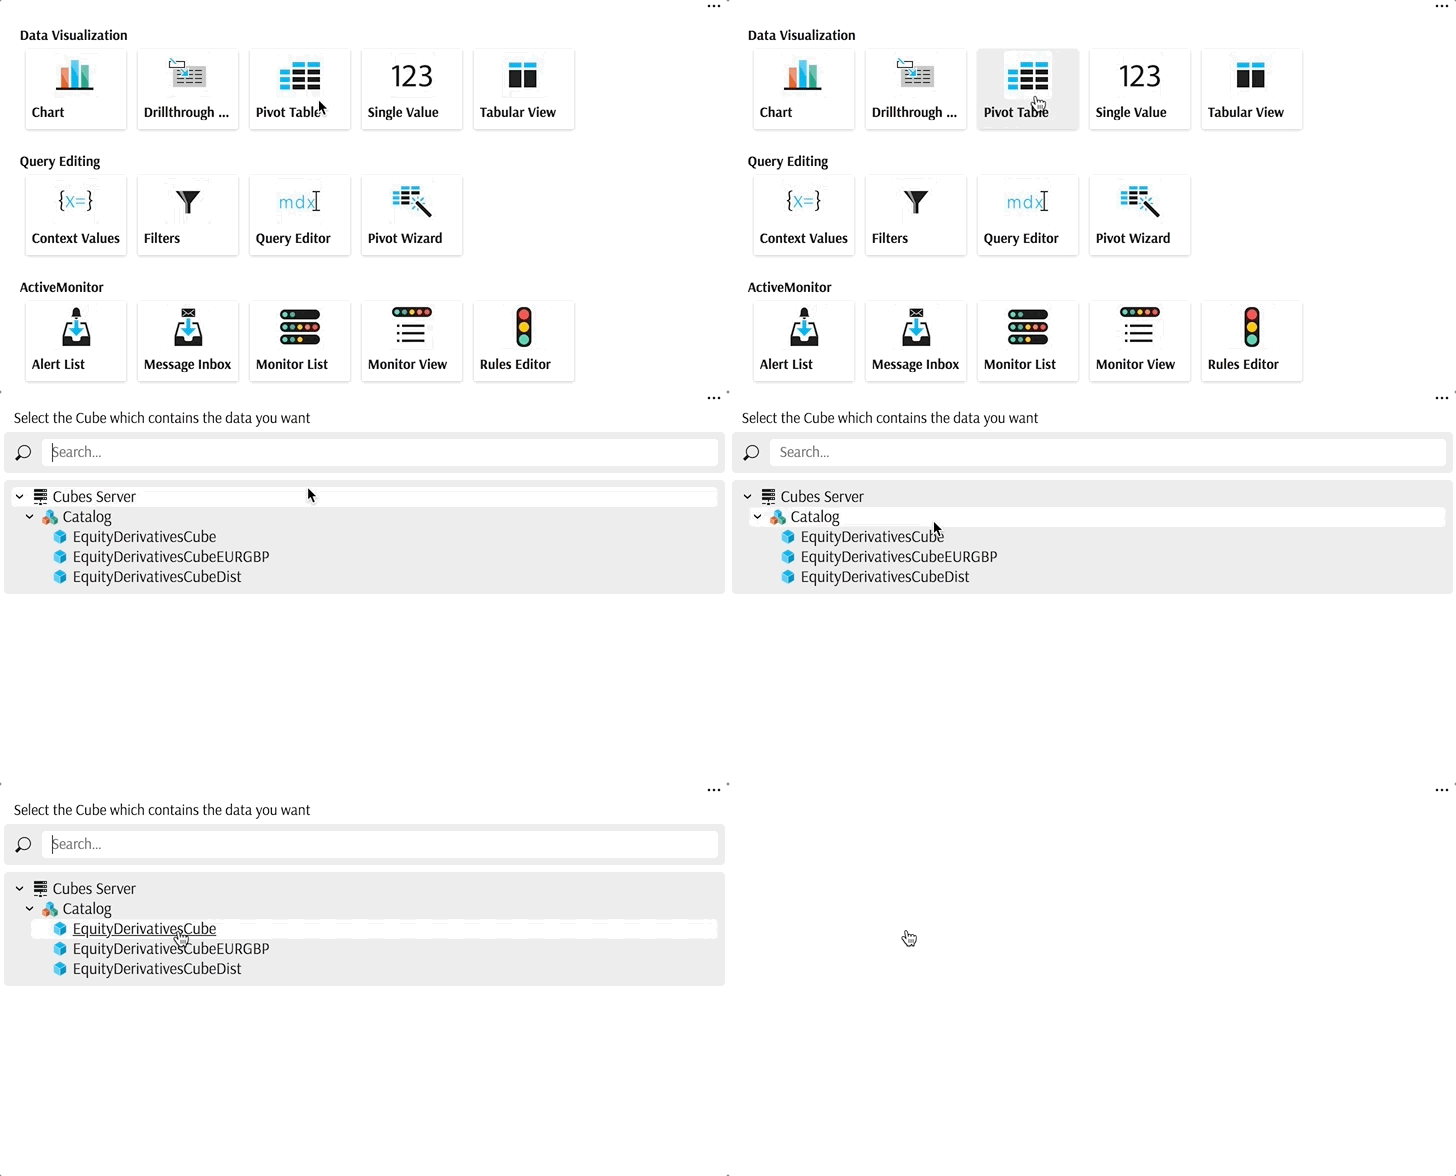
On initial display, a Pivot Table returns a default value, contributors.COUNT.

To reuse an existing Pivot Table, drag it from the bookmarks panel.
Data editing
With the pivot table Wizard, you can add and remove data elements like measures, levels, hierarchies and dimensions, using a graphical interface. The Wizard's behavior is very similar to the PivotTable Builder in MS Excel. Explore the Wizard reference page for more information.
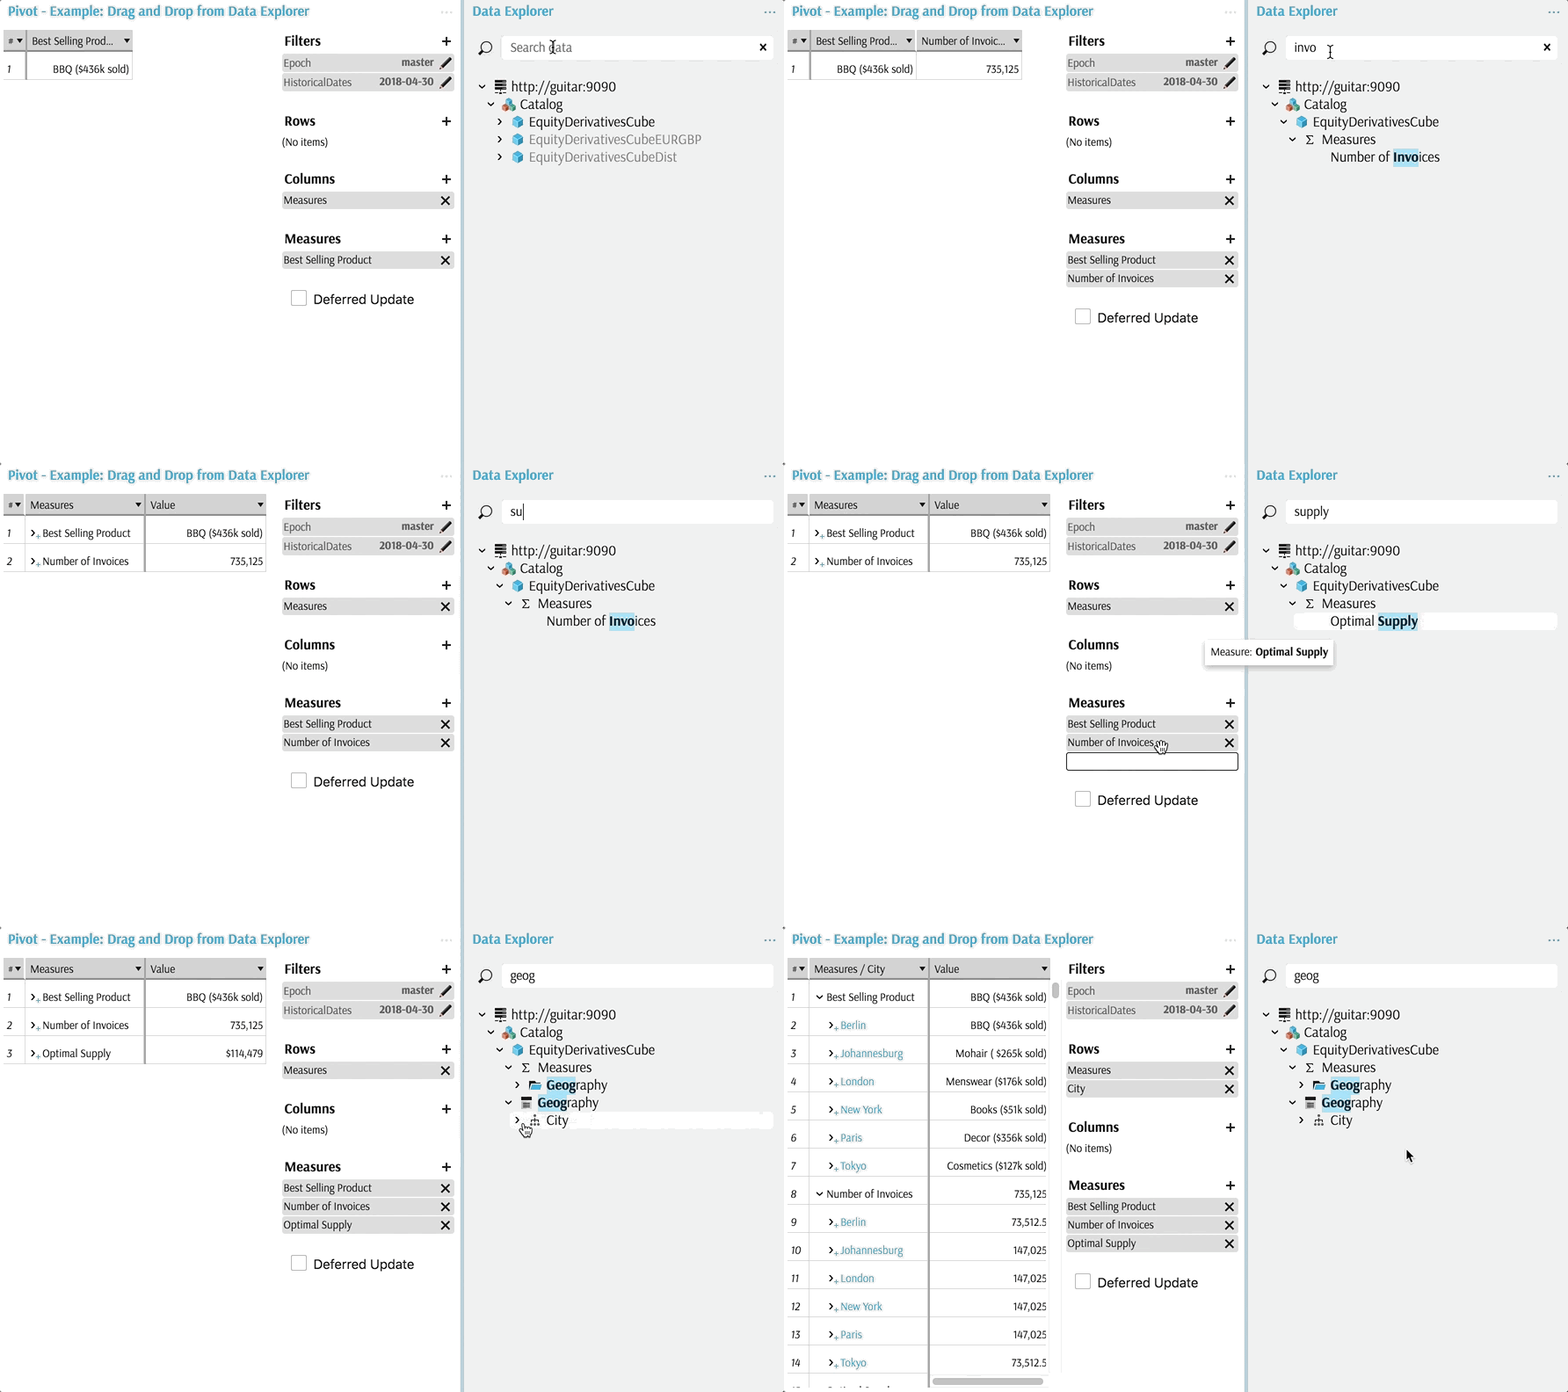
It is also possible to achieve specific requirements, such as:
- to change captions of measures
- to rename aggregation levels
- to apply complex conditional formatting
- or to apply virtually any kind of transformation to the data
You can view and further edit the query behind the Wizard using the Mdx Editor.
Changing the layout
A Pivot Table supports general Table Layout Controls, such as changing column headers or captions.
In addition, a Pivot Table allows you to switch to a display similar to "tabular view", see "Display as Columns" below.
Display as Columns
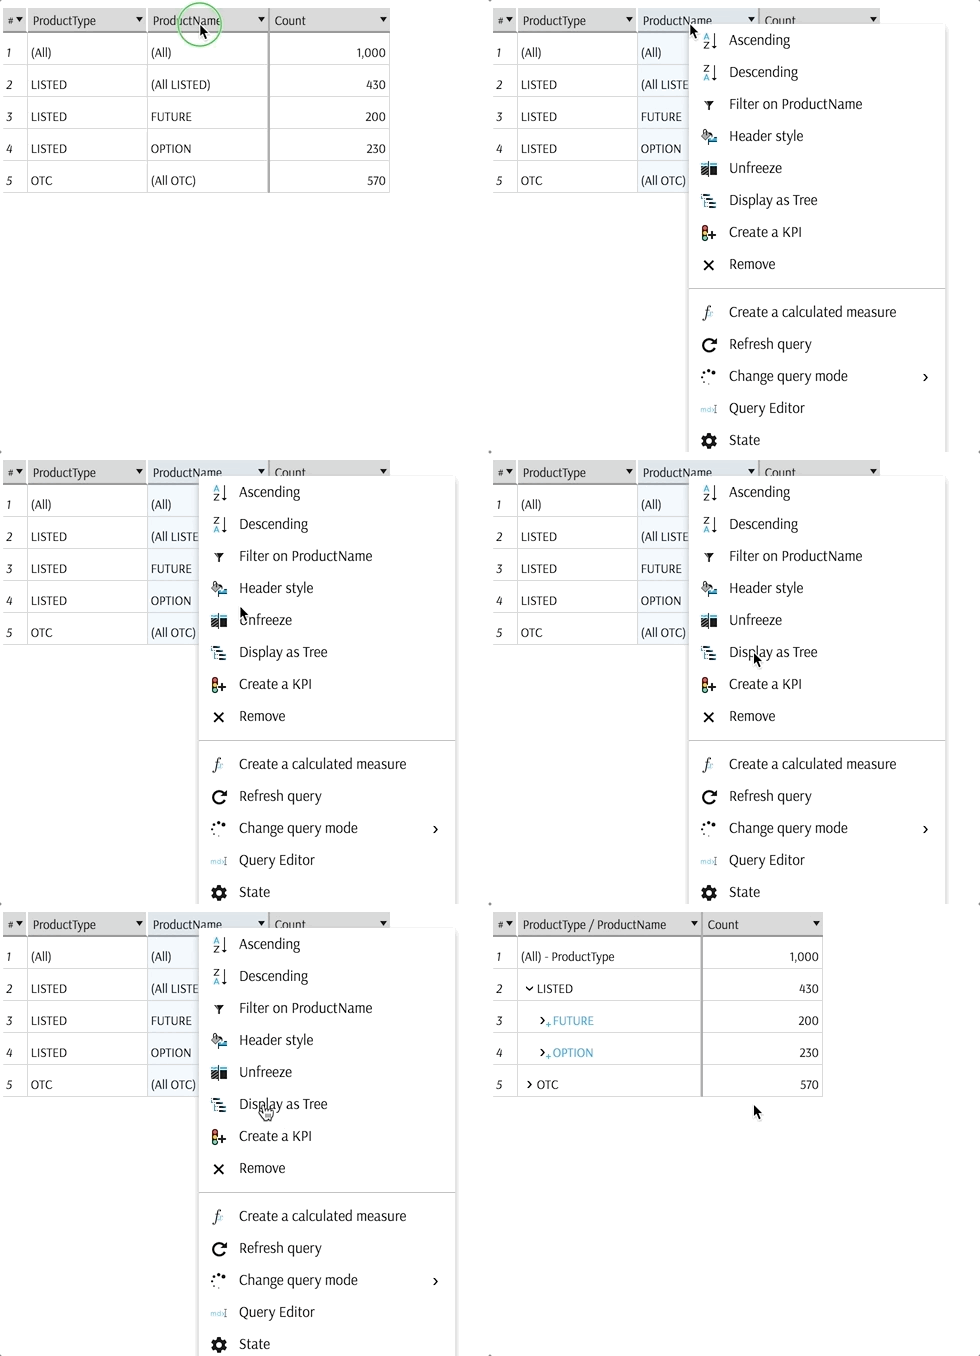
Right click on column headers and select "Display as Columns" to display the aggregation of levels on the rows change from tree to tabular view. Note that Subtotals - see level members (All) - remains on the screen: this is a key difference with Tabular View.
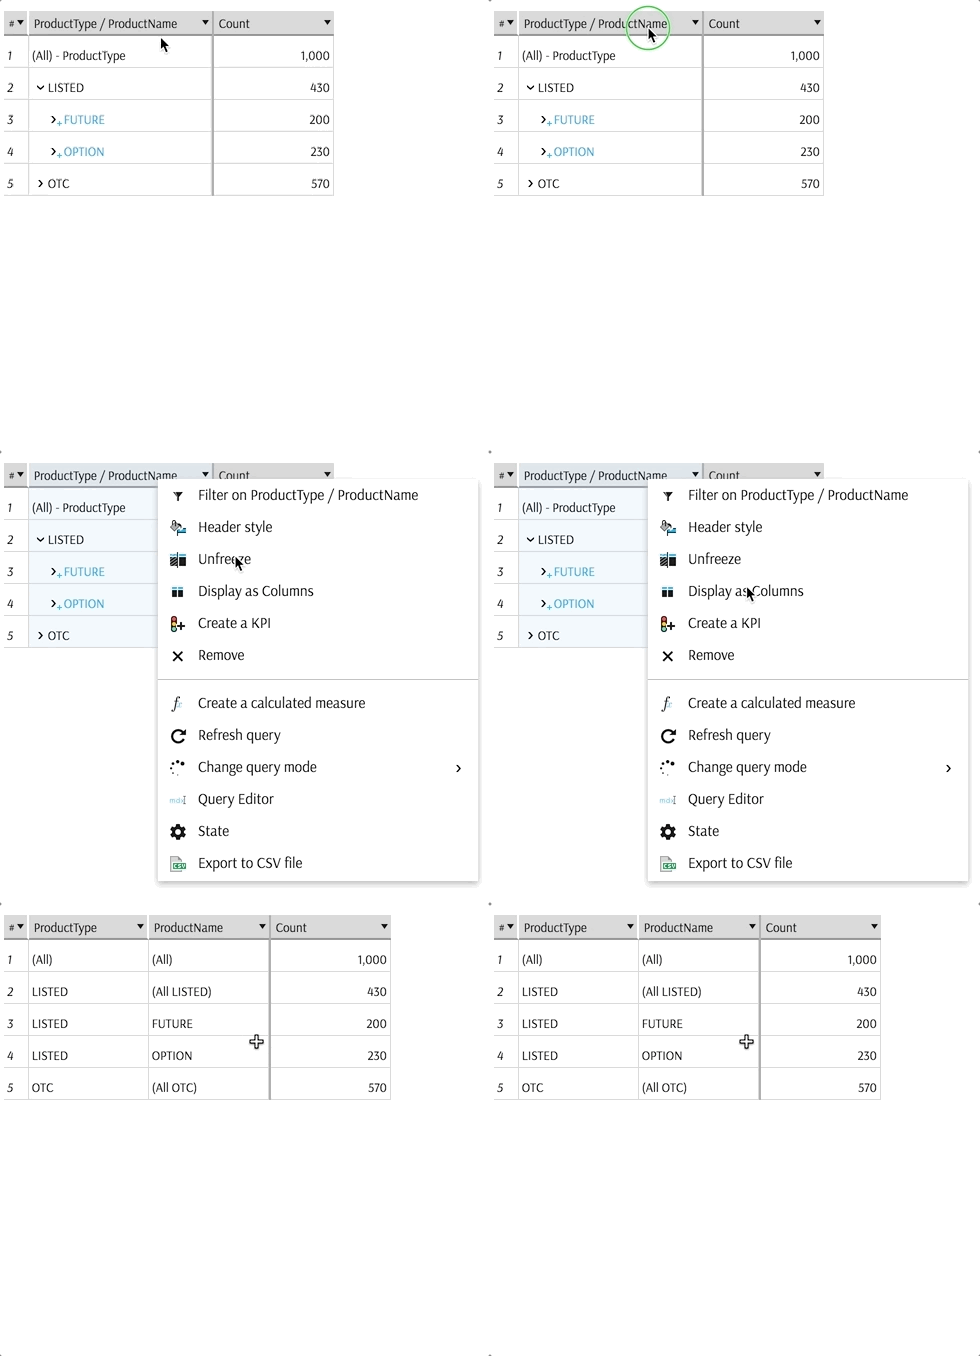
If you need to hide intermediate levels in a multi-level hierarchy: switch to Display as Columns, click on column header and select "Remove", then switch back to Tree view, see "Display as Tree" below. Currently, Unhiding columns in a pivot table is only possible using the state.
Display as Tree
To return to Tree view, right click on column headers and select "Display as Tree".
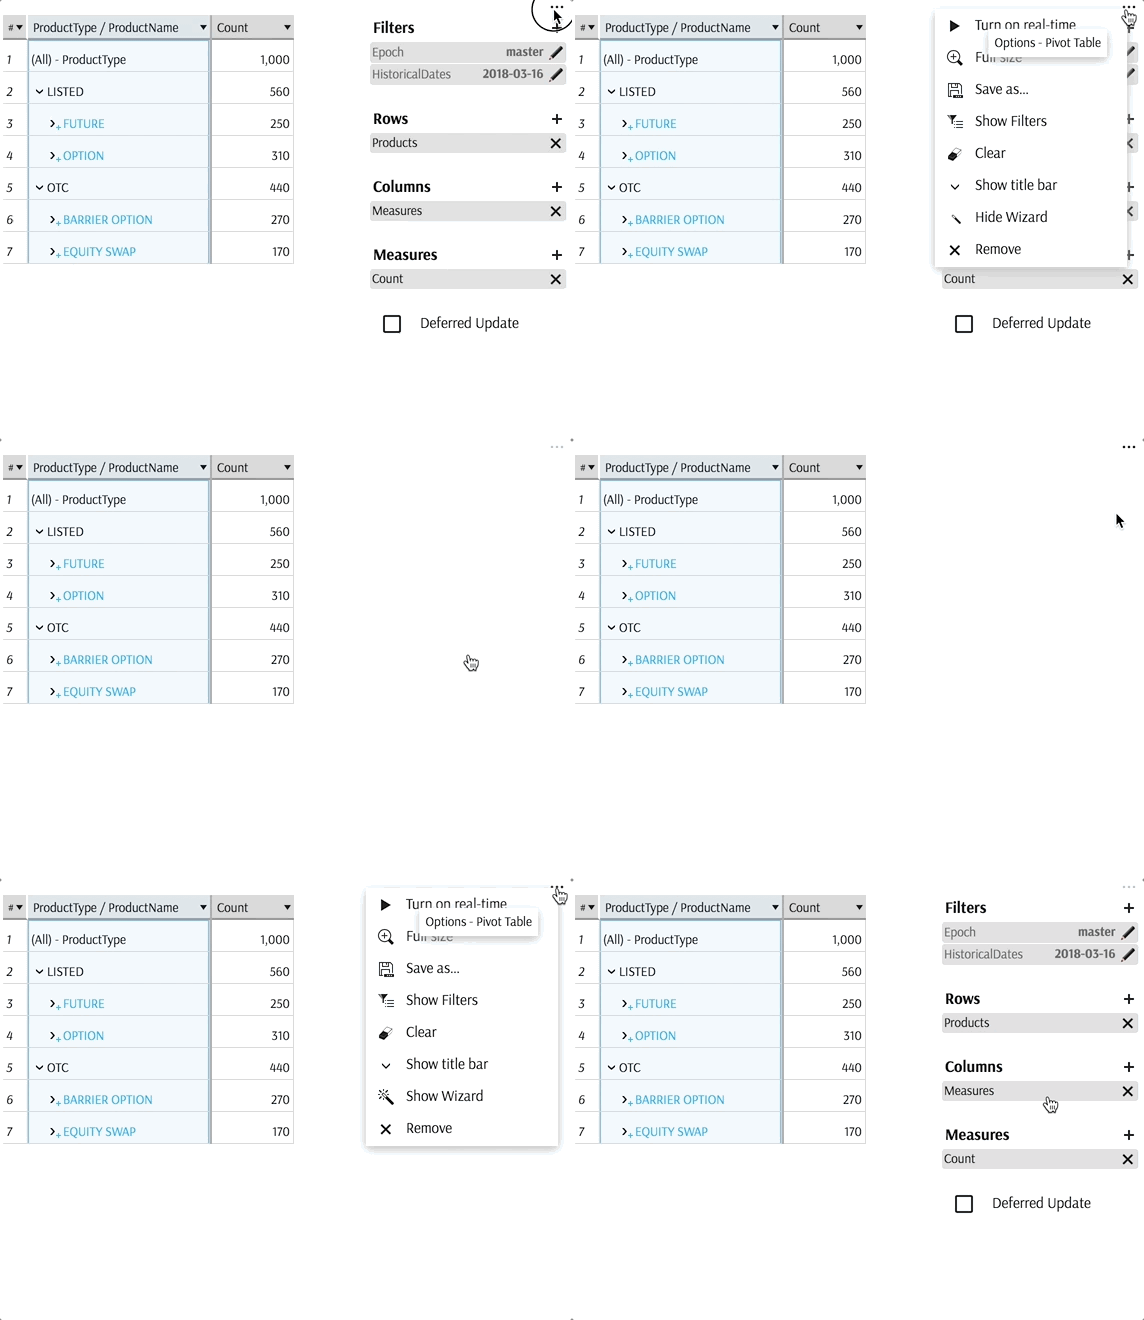
Hide and Show Wizard
Wizard displays on the right side of the Pivot Table by default. Here's how to hide and show it:
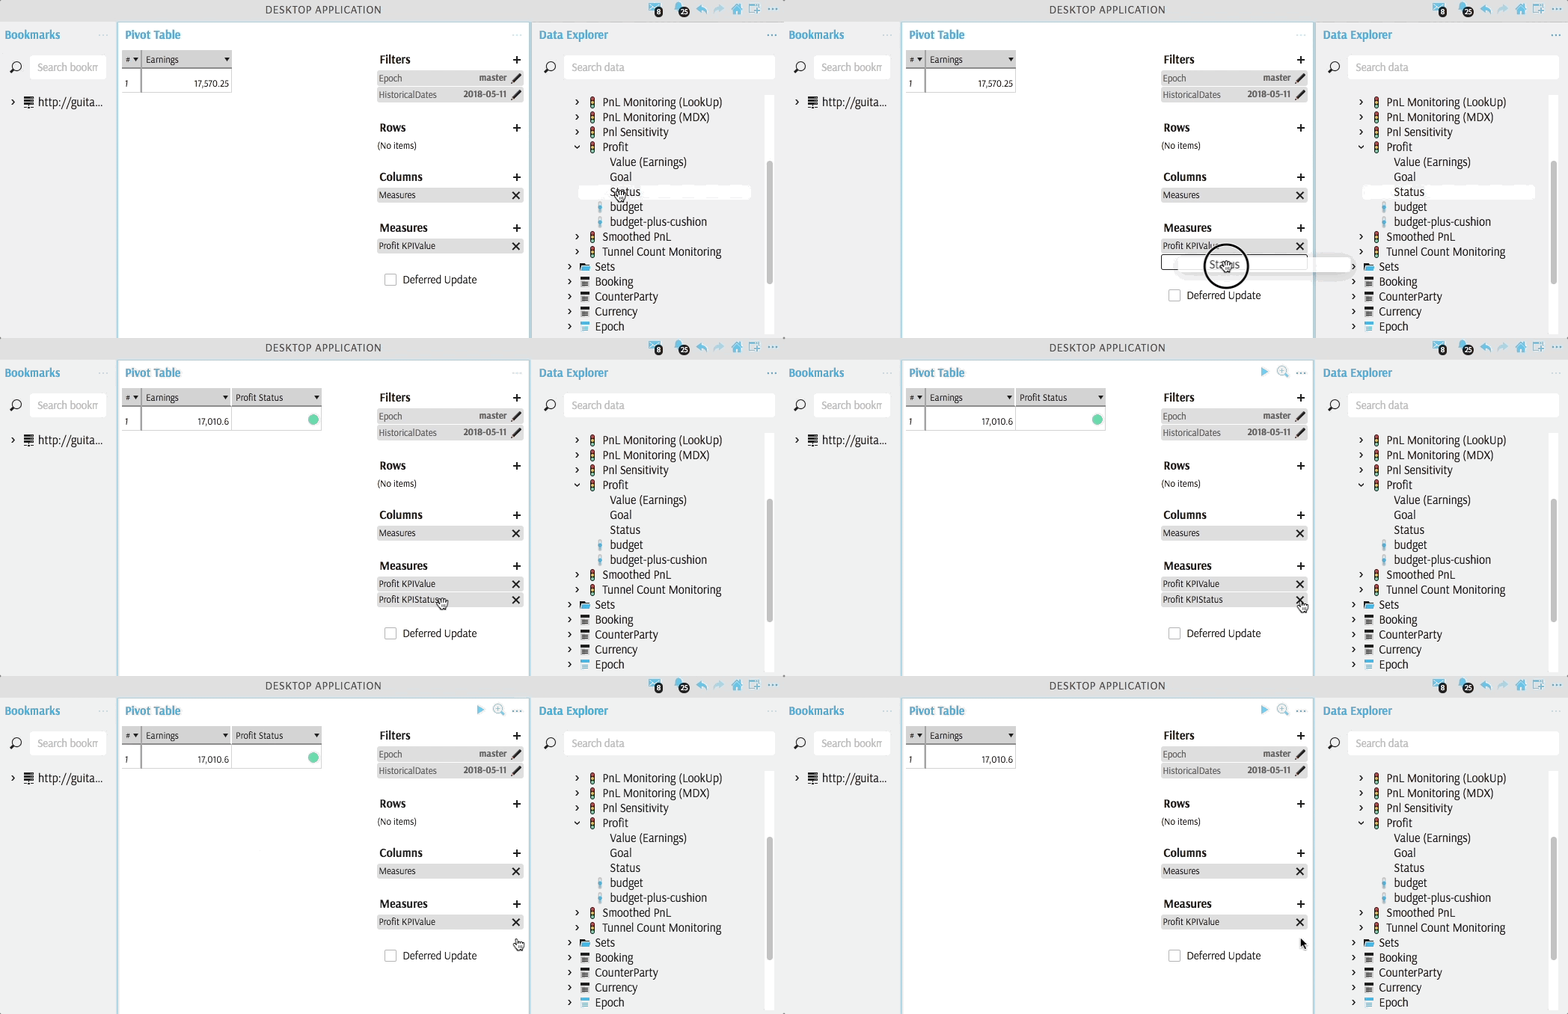
Display KPI status
To display a KPI Status, drag it directly into the table:
Differences with a Tabular View
Differences between a Pivot Table and a Tabular View are summarized in this comparison table
