Table Layout
Header Style
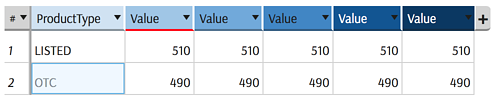
The Header Style popup allows you to change the background, text, and border colors for Column Headers. For example, this Tabular View uses a blue background and red border:
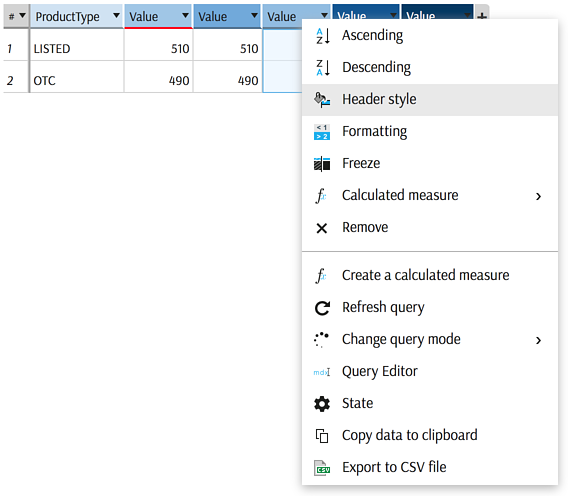
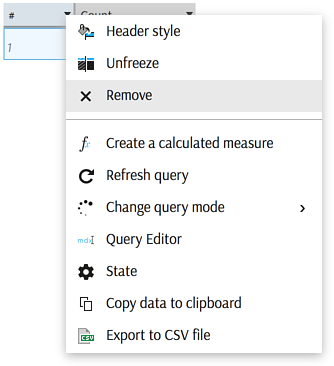
Right click on a column header in Tabular View or Pivot Table to access the Header Style context Menu:
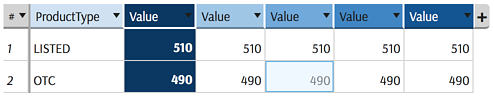
You can combine header styles with Formatting to improve readability, as in the dark-blue column below:
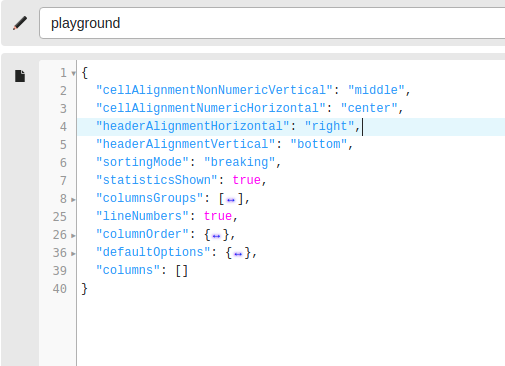
- You can format the alignment of headers and cells in the configuration. Headers can be vertically or horizontally aligned by the
headerAlignmentHorizontalandheaderAlignmentVerticalattributes. To align horizontally you can useleft,rightorcenter. To align vertically you can usetop,bottomormiddle. - Similarly cells can be aligned based on numeric or nonnumeric type with
cellAlignmentNumericHorizontal,cellAlignmentNonNumericHorizontal,cellAlignmentNumericVerticalandcellAlignmentNonNumericVerticalattributes.
Freeze Columns
To lock a column when scrolling data in a widget, right click and select "Freeze".
Move Columns
Columns can be manually reordered. To do this, select the columns to move by dragging over their headers. Once selected, columns can be dragged and dropped where desired.
Remove Column
Right click on a column header and select "Remove" to delete it.
To bring the column back, you must select the measure or dimension again. (See Pivot Table and Tabular View.)
Rename Column
By default the column header displays the measure, formula, dimension name, or the value from the cube.
Double click the header to edit:
By accessing MDX behind the widget, it is possible to rename measures, aggregation levels, create named combinations, and apply virtually any transformation to the data. Read more about editing the MDX using the Mdx Editor
Change width
To manually change the column width, drag its border.
To automatically resize a column to its widest displayed cell, double click on its right border. If the automatically resized column is part of a column selection, all columns from that selection will also be resized. As a consequence, one can automatically resize all columns by selecting the whole table and double clicking on any column.
The automatic resizing only takes into account visible cells and ignores the headers. As a consequence, one can quickly size a whole table in three steps: first select all columns, then double click on the right border of any header to automatically resize the colummn widths, then double click on the header lower bar to automatically resize the header heights.
Advanced users may predefine the column width of a particular column in the State.
Text wrapping
Text wrapping in column headers with long captions will break the text by words initially, and then by letters inside a word if necessary.
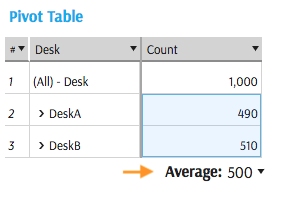
Selection statistics
Since ActiveUI 4.2.0 you can select cell ranges in a Pivot Table and a Tabular View to display simple metrics for the selected cells (Sum, Count, Minimum, Maximum, Average, and Count numbers) below the table:
Advanced users may disable/enable statistics by setting the "statisticsShown" property to false/true in the table’s State.
Be aware that statistics only does simple computations based on the selected cells. Please do not use it to sum up "apples and oranges".
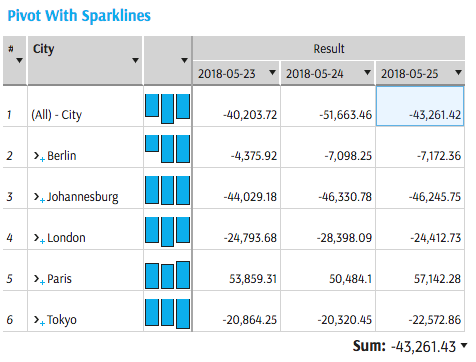
Sparklines
A group of numeric columns can be replaced by sparklines – small column graphs without axes:
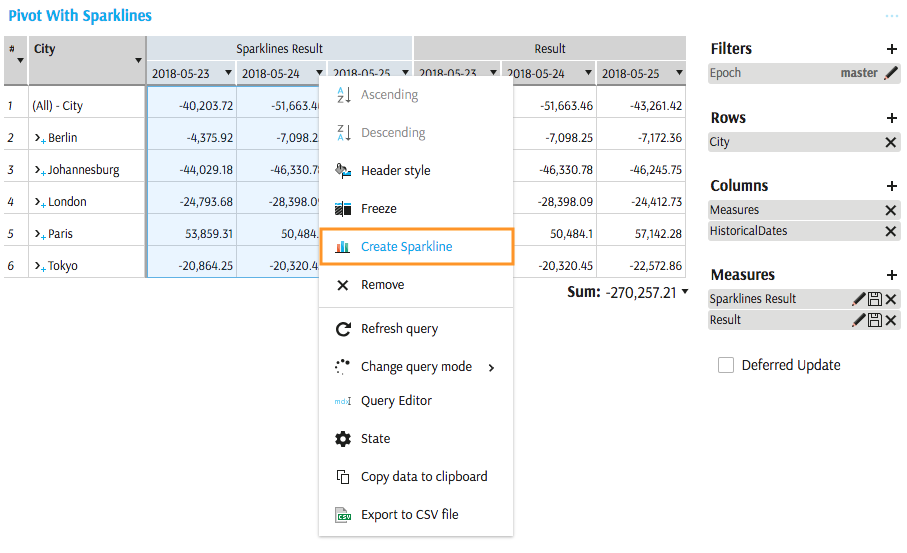
To replace columns with sparklines, select them and then choose "Create Sparklines" from the selection's context menu.
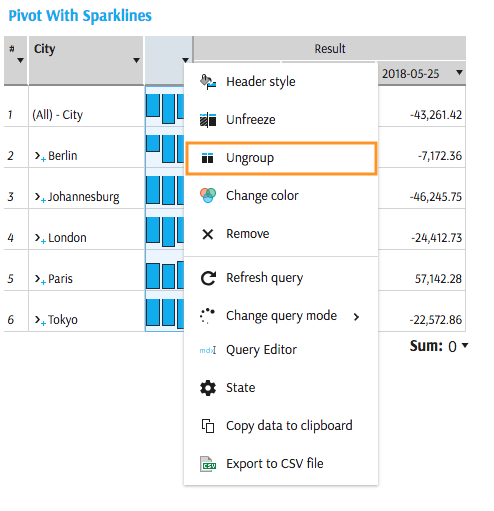
To turn sparklines back into separate columns, select "Ungroup" from the column's context menu:
Show and hide totals
- The Tabular View is a flat representation of your data and therefore doesn't show any total.
- The Pivot Table shows totals by default but you can hide some or all of them, if you need to.
Sub-totals
There are 2 main ways of showing and hiding sub-totals:
The Wizard gives you control over the subtotals that will be asked to ActivePivot.
By default, you can always drag hierarchies (as opposed to levels). This way, you will get all the totals, that you can then hide or show easily.
You can use the "Hide sub-total" and "Show sub-total" context menu option, as shown below (these options will also work assuming that the corresponding subtotals exist, according to the first point).
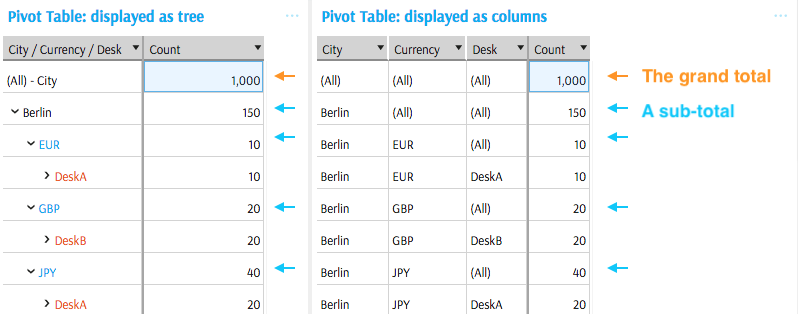
If the pivot table is "displayed as tree", you will find the "Hide sub-total" option on subtotal rows, and the "Show sub-total" option on rows corresponding to the first member of a level where subtotals are hidden (where you would expect this subtotal to be shown).
Advanced users may control the subtotals using the
mdx.hiddenSubtotalscontext value.

If it is "displayed as columns", you can click anywhere within a column to show or hide its subtotals.
Grand totals
You can similarly hide and show the grand total of a pivot table:
- This grand total will be returned by ActivePivot if all children levels are asked with their totals (please refer to the previous tip).
- It can be hidden thanks to the "Hide grand total" context menu option. This option is available on the table header and on the grand total row. When the grand total is hidden, you can get it back by using the "Show grand total" option, available on the table header.
Advanced users may control the grand totals using the
mdx.hiddenGrandTotalscontext value.