Monitor List
What is a Monitor?
Monitors are ActiveMonitor services listening for KPI status updates. You may configure their behaviors to fit your business process, for example, by setting observation frequency or assigning them a Workflow.
Instances of Monitors are running on server to:
- watch for KPI status transitions,
- trigger Workflows.
You may configure Monitors behaviour:
- limit the scopes of data where KPI status may raise an alert,
- set observation frequency,
- script Monitor logic using MDX.
Monitor list
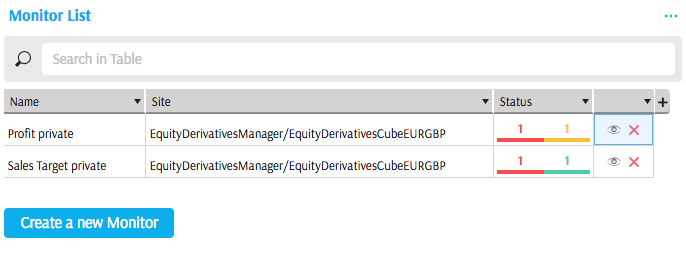
Monitor list is a widget displaying existing Monitors and their KPI Status statistics. You can open it from the dock or the widgets panel.

Explore these actions in the Monitor List:
Create Monitor
Usually, monitors are created automatically when rules are mapped to workflows and submitted in the Rules Editor.
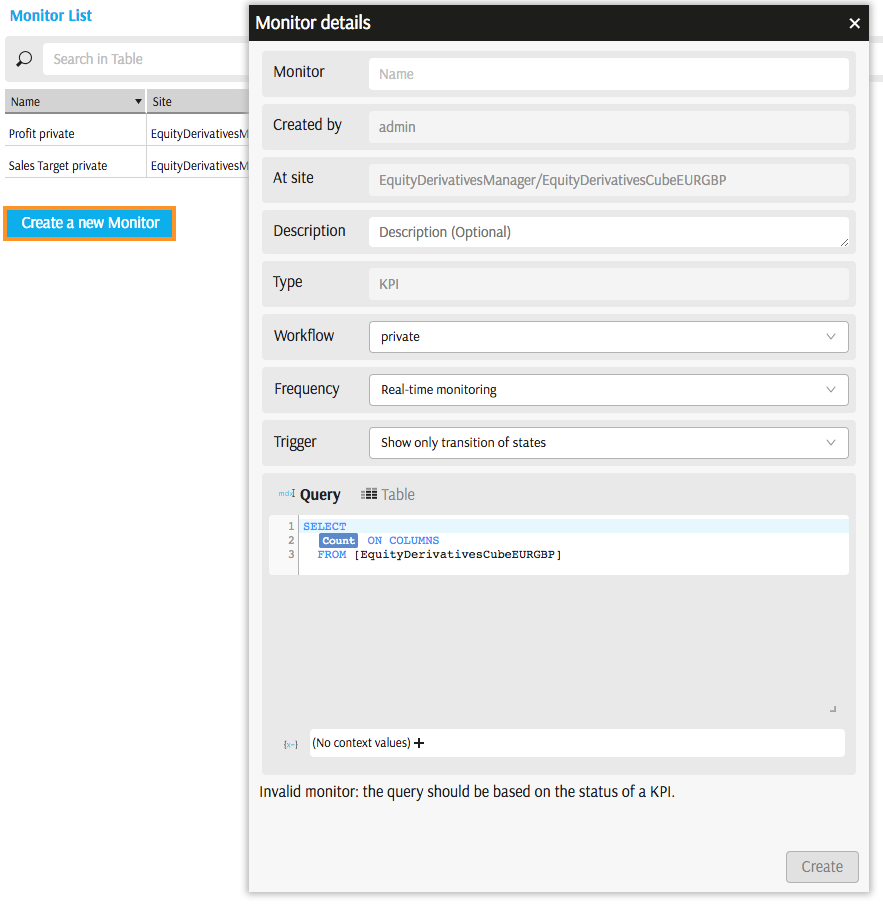
Advanced users may create Monitors manually. Click "Create a new Monitor" button in the Monitor List widget, and you will see the Monitor View popup:
Monitor View

In the Monitor View you may:
Give your Monitor a name.
When Rules Editor creates Monitors for you, it combines KPI name and workflow name in the new monitor's titles, since these are the primary determinants of a Monitor. You can rename the automatically created monitors.
Add a description (optional)
Select a workflow from the list of workflows configured in your organisation.
Set observation frequency:
- Real-time monitoring means continuous observation, KPI status transitions trigger workflows automatically
The following features are under development:
- Manual monitoring implies monitor needs to be initiated manually.
- Scheduled monitoring means monitor is checking statuses periodically
Set trigger:
- Show only transition of states. With this filter, only KPI status changes generate events. KPI Goal or value changes will be discarded if they do not impact the status. This is the default filter selected in the Monitor popup.
- No filter. Anytime KPI Goal or KPI Value change an event is generated. While it can be useful to receive historical changes of values across time, this option might generate a large volume of events, so choose it with care.
Insert an MDX query or build it in the Table. MDX should return KPI status on columns and the necessary aggregation levels on rows, for example,
SELECT
  {
    KPIStatus(
      "Sales Target"
    )
  } ON COLUMNS,
  NON EMPTY [Currency].[Currency].[Currency].Members ON ROWS
  FROM [EquityDerivativesCubeEURGBP]
  WHERE [Geography].[City].[ALL].[AllMember].[New York]
- You may let the monitor apply Context Values when checking for KPI Status.
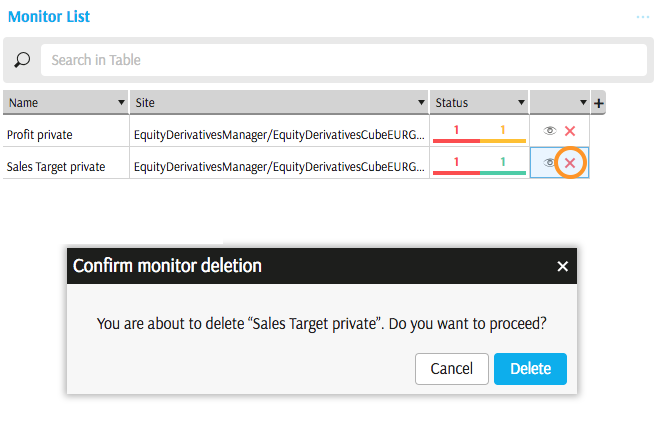
Remove Monitor
You can remove a Monitor from the Monitor List:

Please consult with your product development team to learn more about the implementation of audit mechanism for the Monitors in your organisation.
View/Edit Monitor
Click "eye" icon to edit the Monitor settings in the Monitor View:

