Frequently Asked Questions
General
How can I cancel an action I just did?
Using the undo feature available through a dashboard action or keyboard shortcut.
How do I open a bookmark? Nothing happens when I click on it.
Interactions are different whether the bookmark is a dashboard or a widget/filter: see how to launch a bookmark
My pivot table or tabular view result is empty or partial. How can I display the complete content?
Measures, filters and context values can affect your query result. Make sure that all of those elements are defined as expected. Otherwise, follow the instructions below.
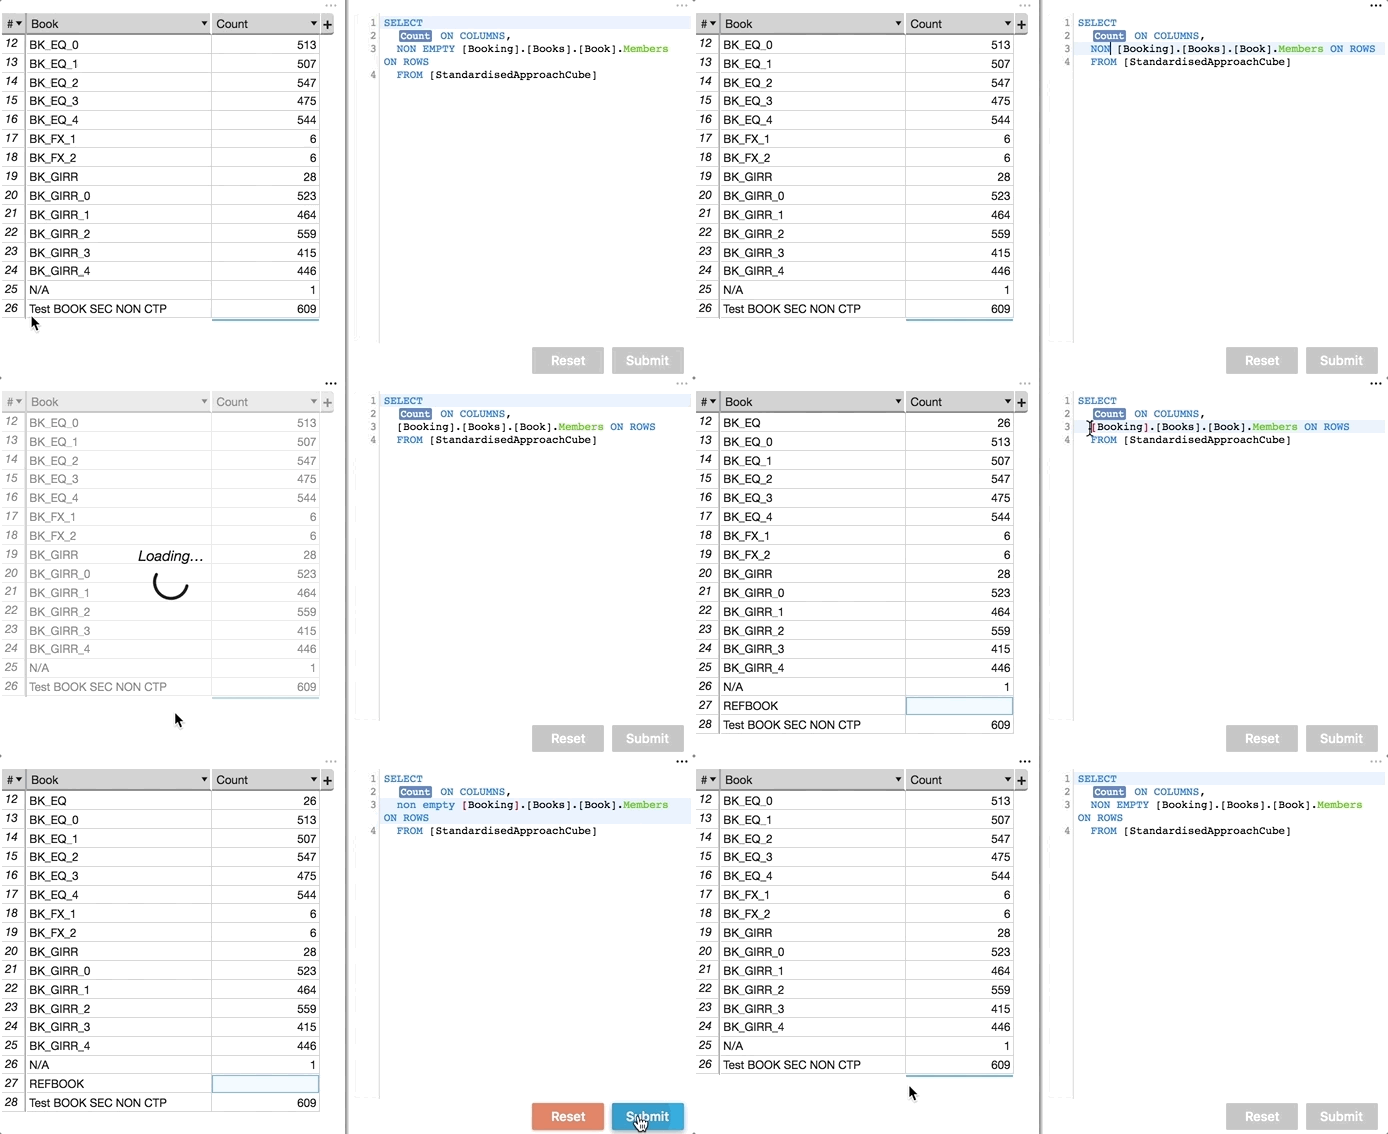
By default, most of the MDX-based widgets remove "empty rows or columns" using the NON EMPTY keyword. If you want to display the full result, including empty rows/columns, you must remove the NON EMPTY keyword from the query axes using the Mdx Editor.
How do I share a bookmark with a colleague?
In order to share a bookmark and make it visible to a colleague or a group of colleagues, you need to set the correct permissions on your bookmarks).
Sharing bookmarks using URL is possible and needs to be implemented by your product development team.
Measure
How do I create a custom measure?
Custom measures can be created using the Formula Editor.
How to see the difference in a measure between 2 days?
Using the Formula Editor or MDX directly, it is possible to calculate such difference: See how to implement day-to-day difference
Widgets
What is the difference between a tabular view and a pivot table?
Differences between a Pivot Table and a Tabular View are summarized in this comparison table. For details, please refer to Pivot Table and Tabular View reference pages.
How can I show or hide totals in a pivot table?
Please refer to the Show and hide totals section to find out about the different ways to show and hide totals from a Pivot Table.
How can I add a title to a widget?
Click on the title to edit. If you cannot see the title, click the more icon, ..., in the top right corner of the widget and select "Show title bar".
How can I move a widget to a different location?
Drag the widget by the title and drop it where desired. If you cannot see the title, click the more icon, ..., in the top right corner of the widget and select "Show title bar".
Please check an illustration on this page: Moving widgets
Filters
Why is my top filter disappearing when I am interacting with one of the widgets in my dashboard?
The Dashboard filters panel only shows filters that are common to all widgets in a dashboard. If you locally change a widget's filter so that it is not the same as in other widgets, then there are no dashboard filters because there are no longer any filters common to all widgets. Read more about Dashboard and local filters
Why do I only see data from a specific date? Why is there some default filters?
Some hierarchies may be configured as a slicing hierarchy if it does not make sense to aggregate across all members of the hierarchy (for example, dates or value of inventory). Read more about default filters.
Chart
How do I add multiple layers or measures to a chart?
Explore the Charts Gallery for detailed examples.
Can I convert a table to chart or a chart to table?
You can create a table from a chart using the Show data context menu option. Creating a chart from a table is not yet possible.
Definitions
What is a cube?
From Microsoft System Center:
An OLAP cube is a data structure that overcomes the limitations of relational databases by providing rapid analysis of data. Cubes can display and sum large amounts of data while also providing users with searchable access to any data points. This way, the data can be rolled up, sliced, and diced as needed to handle the widest variety of questions that are relevant to a user’s area of interest.
In concrete terms, a cube contains dimensions, hierarchies, levels, measures, KPIs and sets. See OLAP cube for more details.
What is the difference between a slicing and aggregatable hierarchy?
- A regular hierarchy is considered aggregatable: this means it is possible to aggregate data across all members of the hierarchy. For example, consider a geographical hierarchy with a turnover measure: as a user, you would expect to see the worldwide aggregated turnover across all countries.
- On the contrary, a slicing hierarchy is not aggregatable at the top level: this means it does not make sense to aggregate data across all members of the hierarchy. For example, consider a date hierarchy with a measure that outputs the current bank account balance for a given date: it does not provide any meaningful information to aggregate the bank account balance across all dates.
What is an "epoch"?
Epoch is an instrumental dimension allowing you to explore different states of the data. Different epochs reflect different snapshots of the cube.
Epochs are particularly useful:
- when data updates arrive in real-time and you need to walk back in time and see data as it was in the past.
- when you would like to apply changes to the data and analyze what-if scenarios.
Epochs are configured to the organization's needs. Talk to your product development team to tailor the dimension to your needs.
What is the difference between a dimension, a hierarchy, and a level?
- Dimension is a logical group of attributes, for example, Geography. Think of it as of a logical "folder" containing hierarchies.
- Hierarchy is a sub category of a dimension and represent a precise type of data. For example, "City" or "Territory" could be hierarchies for the "Geography" dimension.
- Level is a sub category of a hierarchy. Levels have a specific order with a parent-child relationship. If the hierarchy contains one level, it will be displayed as a flat attribute in the pivot table. On the other hand, if it contains multiple levels, adding a hierarchy to a pivot table would display the first level and allow users to expand each member against the next level and display sub totals. For example, a "Territory" hierarchy has "Region" as the top level. "Region" expands into "Country" at the second level, and "Country" may have "City" - at the leaf level. See the Pivot Table page.
What is the difference between a member and a measure?
- Measures compute and aggregate information from the data. For example, total number of records or average size of orders.
- Members are attributes or categories of a level. For example, "New York" or "London" would be members of the "City" level. Another example with a "Calendar" hierarchy that contains two levels, Year and Date. The values "2016," "2017," and "2018" would be Members of the level "Year." The values "1 May 2018," "2 May 2018," etc. would be Members of the level Date.
What is the difference between a calculated member, a calculated measure and a formula?
- A calculated member is a generic term used to describe a member which expression is defined in MDX. Most of the time, a calculated member will be defined in the
WITHMDX clause of the query. - A calculated measure is calculated member defined on the
Measureshierarchy. - A formula is another term for calculated measure.
What is the difference between a slicer and a subselect?
Both slicers and subselects represent MDX filters.
- Slicers are defined as a member or a tuple of members in the
WHEREclause. They cannot contain a filter on a hierarchy that is already used on the rows or columns axis. - Subselect are defined as an inner
SELECTstatement and allow for more complex expression to be defined as a filter.
The wizard will generate a slicer whenever the hierarchy you are filtering on is not in the main rows/columns axes and the filter is a monoselection (i.e. a single member). Otherwise, when the hierarchy is displayed on rows/columns or when the filter is not a monoselection, the filter will be created as a subselect.
Technically, in ActivePivot, subselects will translate as "SubCubes" whereas slicers won't.
Most of the time, writing a filter as a slicer or as a subselect will make no difference. However, this has an impact when you implement day-to-day difference for example.
What is the difference between expand, drill down, drill in and drillthrough ?
Let's consider the following pivot table:
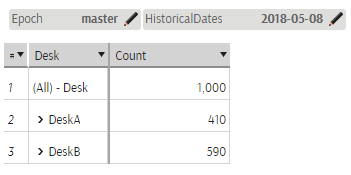
- Expanding
DeskAwill keep the current data and decompose the measure against the direct children ofDeskA.
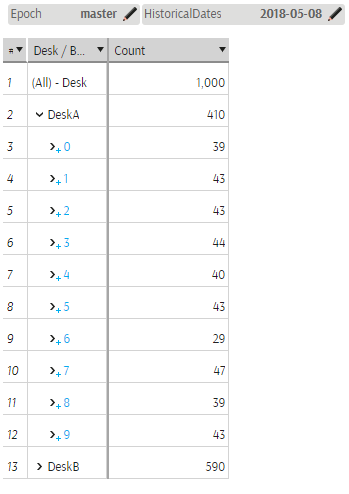
- Drill downing
DeskAwill filter byDeskAand only display the next levelBookId.
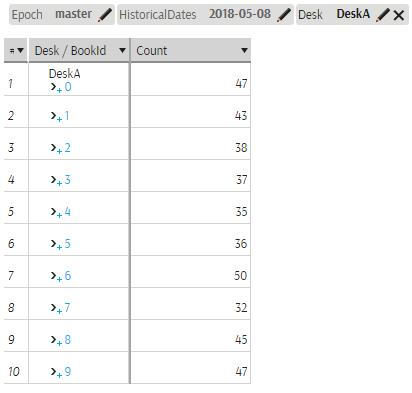
- Drill in
DeskAwill filter byDeskAand remove the rows axis.

- Drillthrough
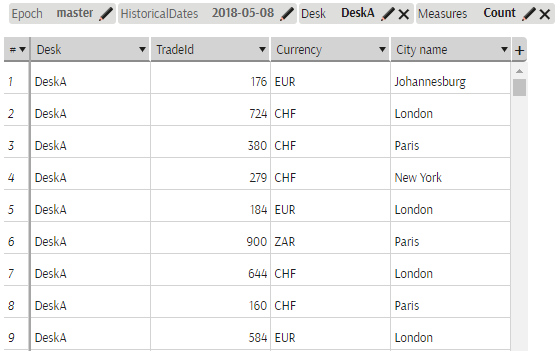
DeskAwill reveal the underlying facts that contributed to that cell.
What is the State context menu?
The State context menu often is not intended to be used by end users. This menu allows to fine-tune settings and configuration of widgets.
What is lazy loading?
Lazy loading is a technique used in Pivot Table and Tabular view widgets to defer the download of data until it is needed. Therefore table's rows and columns are only downloaded from the server when the user scrolls and looks at them in the screen. This dramatically improves performance compared to fetching the complete result.
Example: if a table has one million rows, the framework will download about 2000 rows (lazy loading) and render about 30 rows (lazy rendering). In your project, cardinalities might be different depending on how lazy loading is configured but it remains conceptually the same.
Lazy loading is configurable per project/widget. Ask your product development team.
MDX
Is there any resources available to learn MDX?
See listed available resources
Does ActiveUI SDK provide any help when writing MDX?
Yes. ActiveUI SDK provides syntax validation through its MDX Editor. There are also available keyboard shortcuts that provide automatic completion or indentation.
