Why use the query plan
- Diagnose slow queries: Understand which steps take the longest.
- Identify dependencies: See how measures depend on each other.
- Optimize partitioning: Check if the partitioning strategy is effective.
- Detect issues: Spot cyclical measure definitions or excessive result sizes.
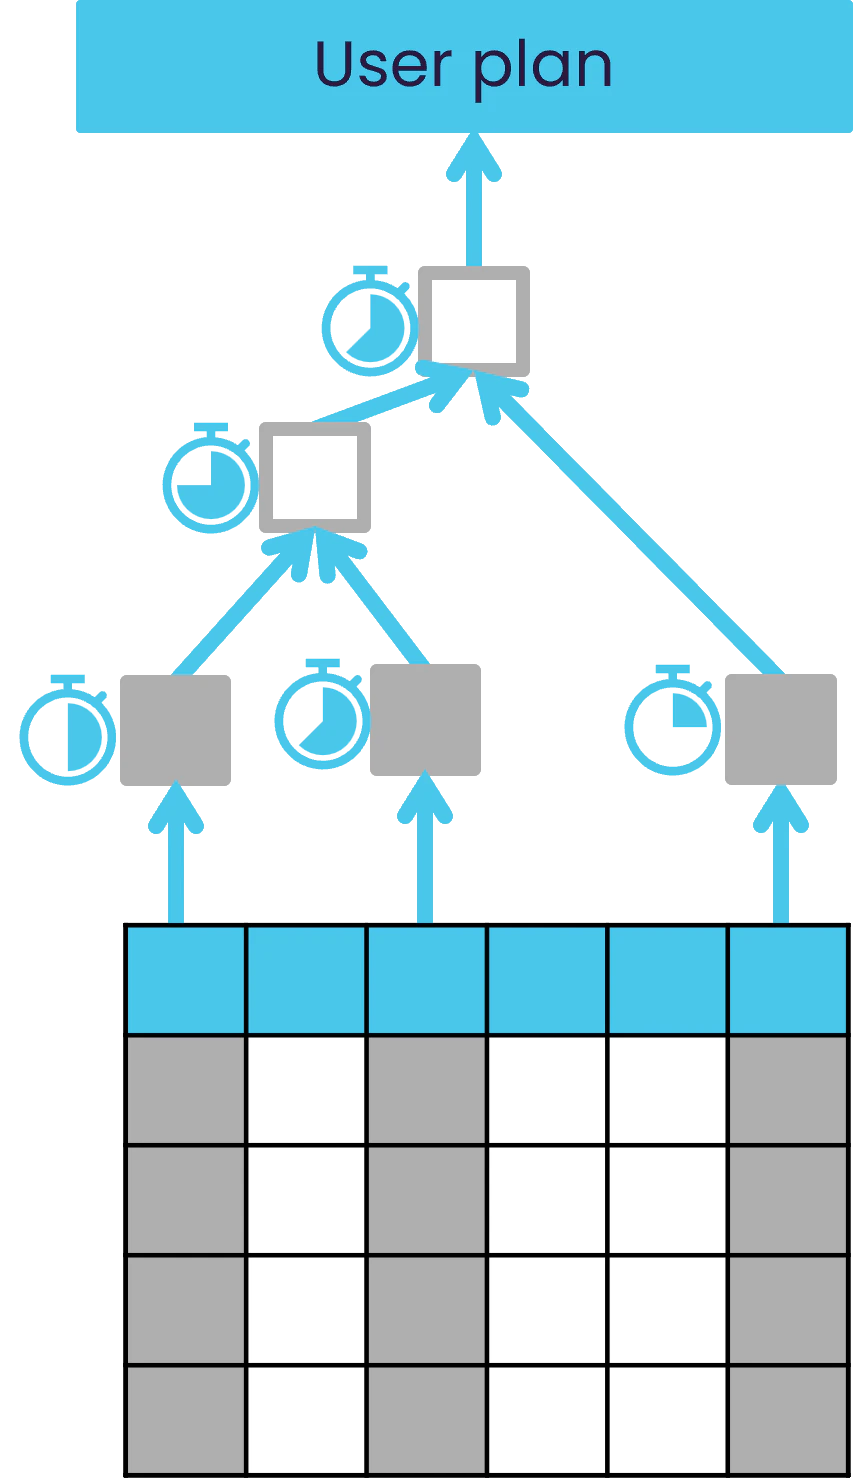
What information does the query plan provide
- Dependencies: Shows the calculation order for measures.
- Execution times:
- Start time: When a step begins.
- Elapsed time: How long the step takes.
- Result size: Number of points retrieved at each step.
- Partitioning strategy: Indicates constant, value, or modulo partitioning.
- Retrieval method: Whether data comes from cache, datastore, or post-processor.
How to analyze the query plan
- Look for long steps: High elapsed time indicates a bottleneck.
- Check result size: Large result sets may explain slow performance.
- Review partitioning: Ensure partitioning matches datastore configuration.
- Identify retrieval type:
- Cache retrieval = fast.
- Primitive retrieval = datastore scan (slower).
- Post-processor retrieval = additional computation.
- Upload query plan output.
- Visualize dependencies and timing.
- Spot problematic steps quickly.
- Check when an aggregate provider is used.
- Understand how a query is distributed in a horizontal setup.
When to use the query plan
The query plan is most useful when:- Dashboards or widgets load slowly.
- Queries return fewer results than expected.
- You suspect inefficient partitioning or retrieval methods.