- Understand the requirements
- Understand the context
- Understand the problem
- Fine-tune the solution
1. Understand the requirements
Clarify what matters most for the project. This ensures that optimization efforts remain focused.- Faster data loading
- Faster query execution
- Reduced memory usage
- A balanced trade-off constrained by the available hardware
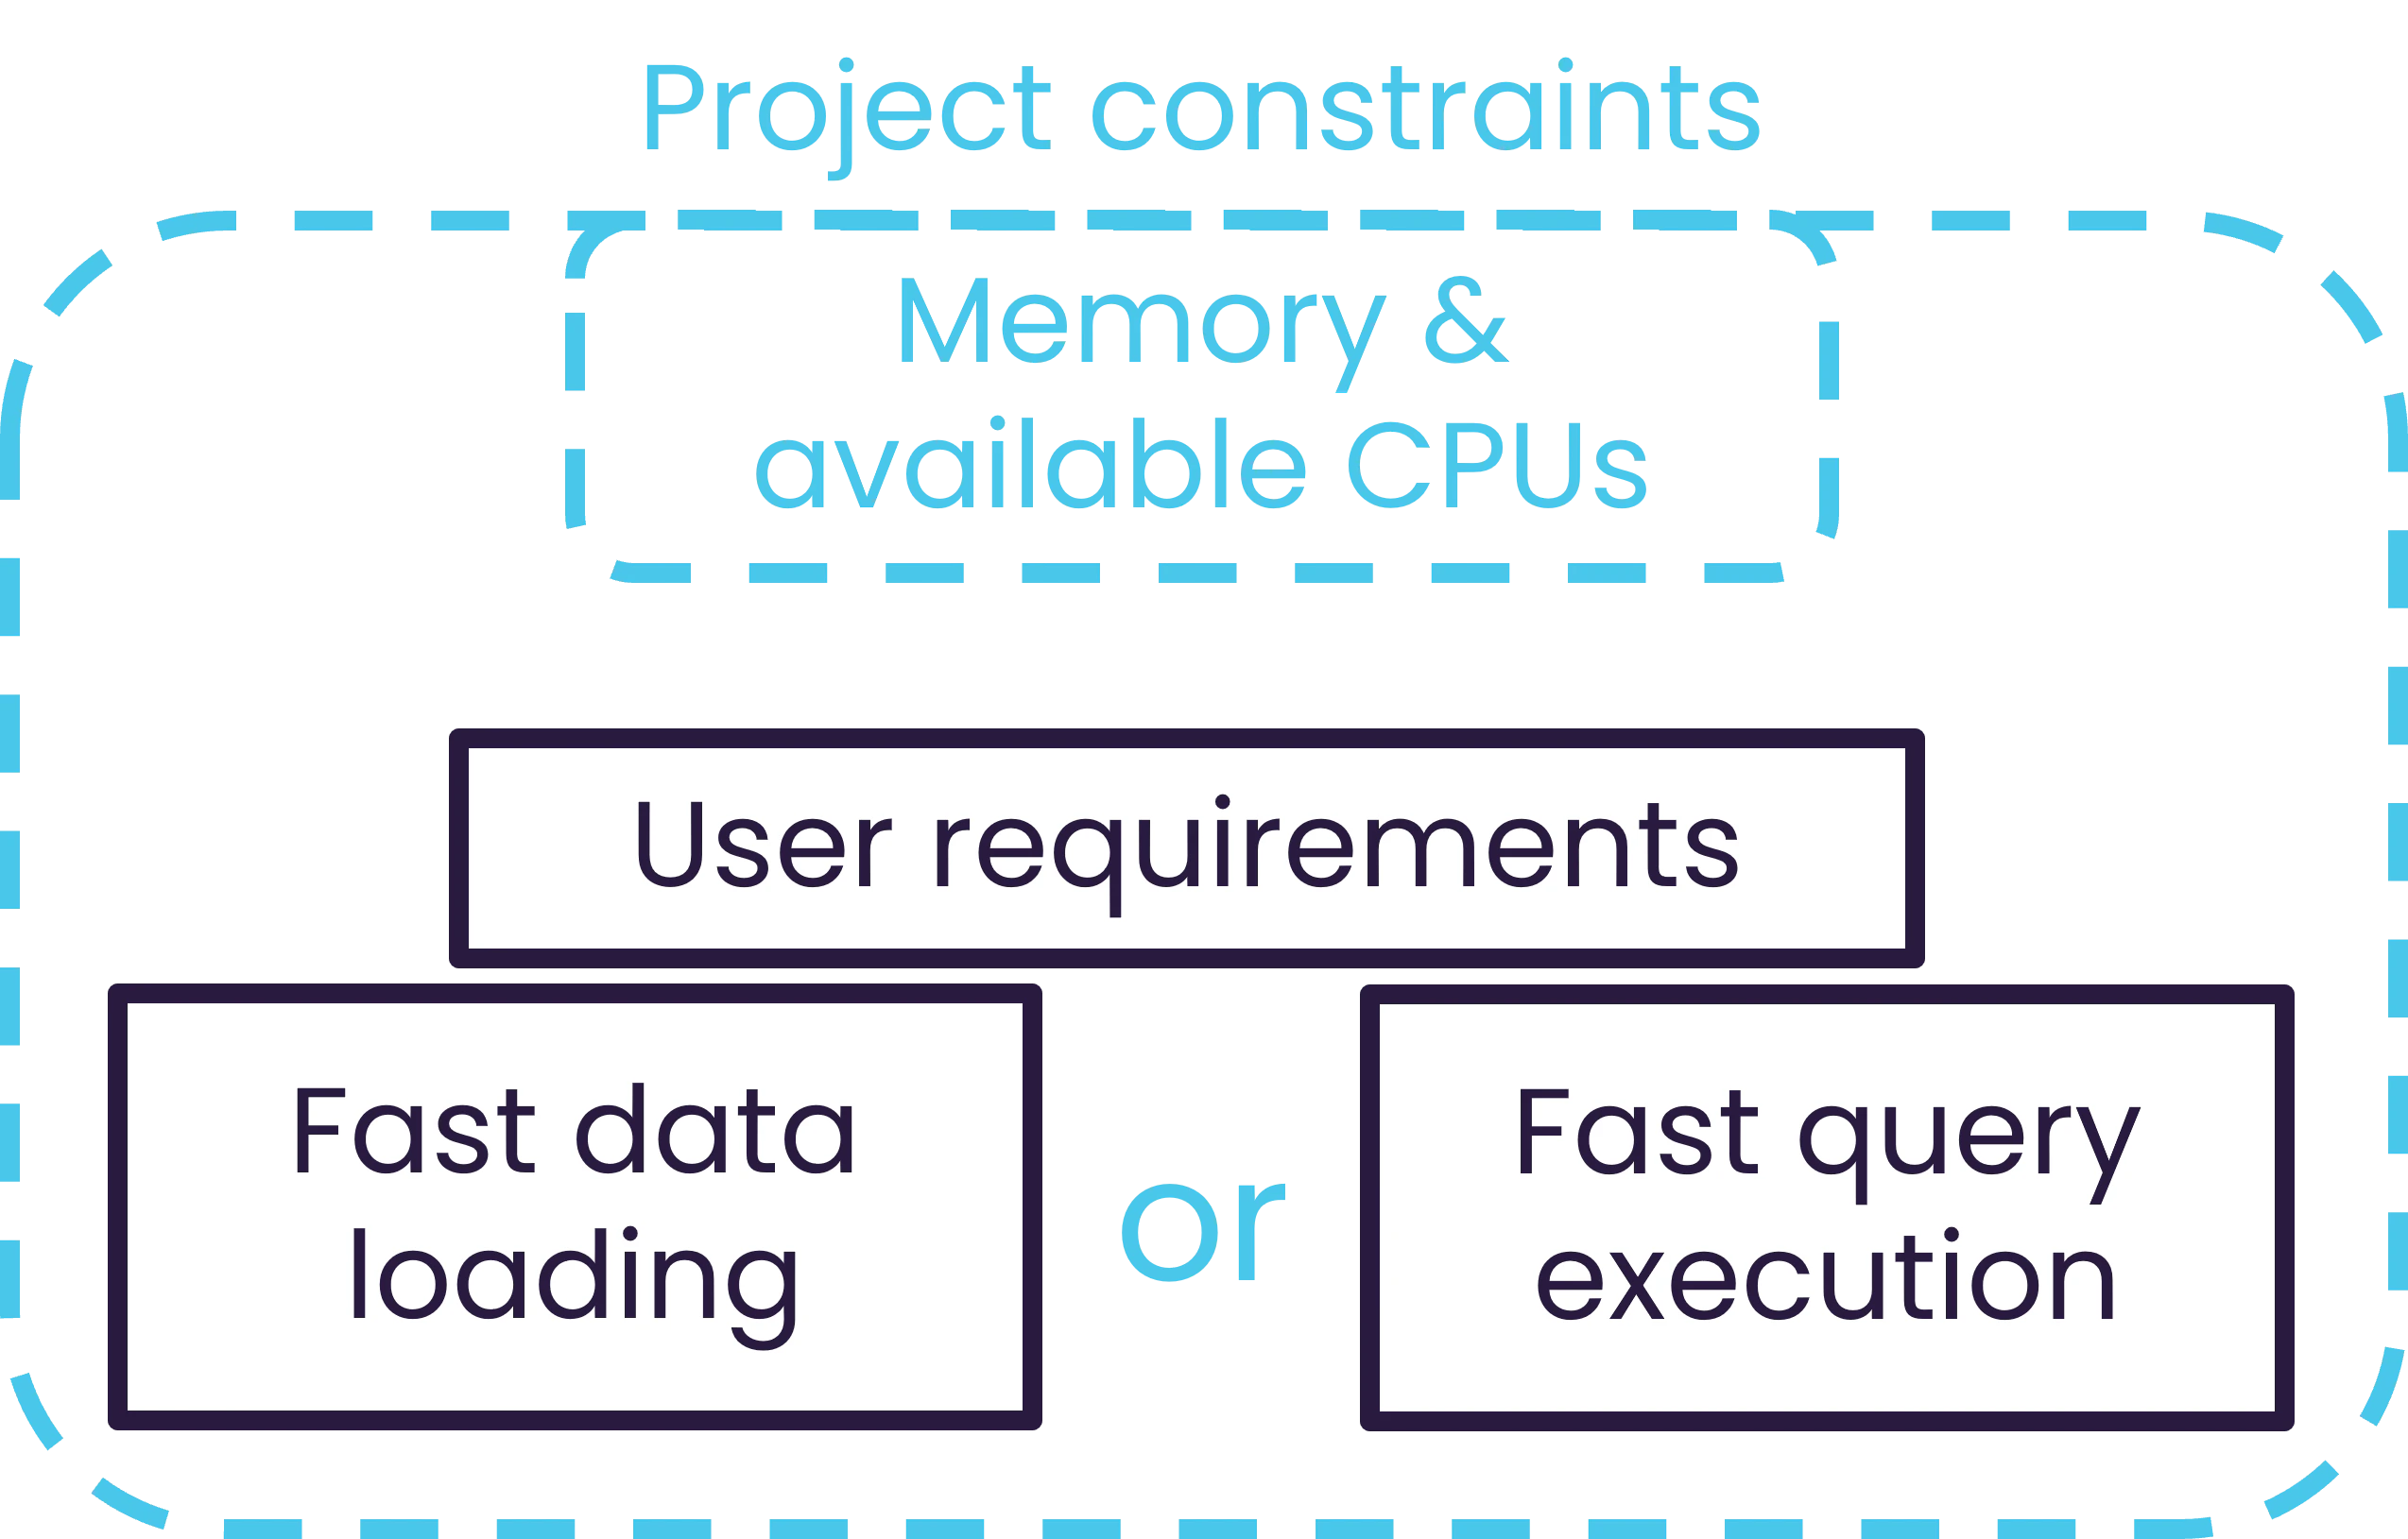
Performance optimization requires balancing different constraints.
2. Understand the context
Every Atoti deployment is different. Troubleshooting starts with gaining full visibility into:- The underlying data and data sources
- The data model and datastore configuration
- The aggregate providers and how the cube is used
3. Understand the problem
Performance issues rarely happen without reason. When performance changes, either suddenly or gradually, investigate what has recently changed:- new code or configuration updates,
- increased data volume,
- spikes in user activity, or
- unexpectedly large or complex queries.
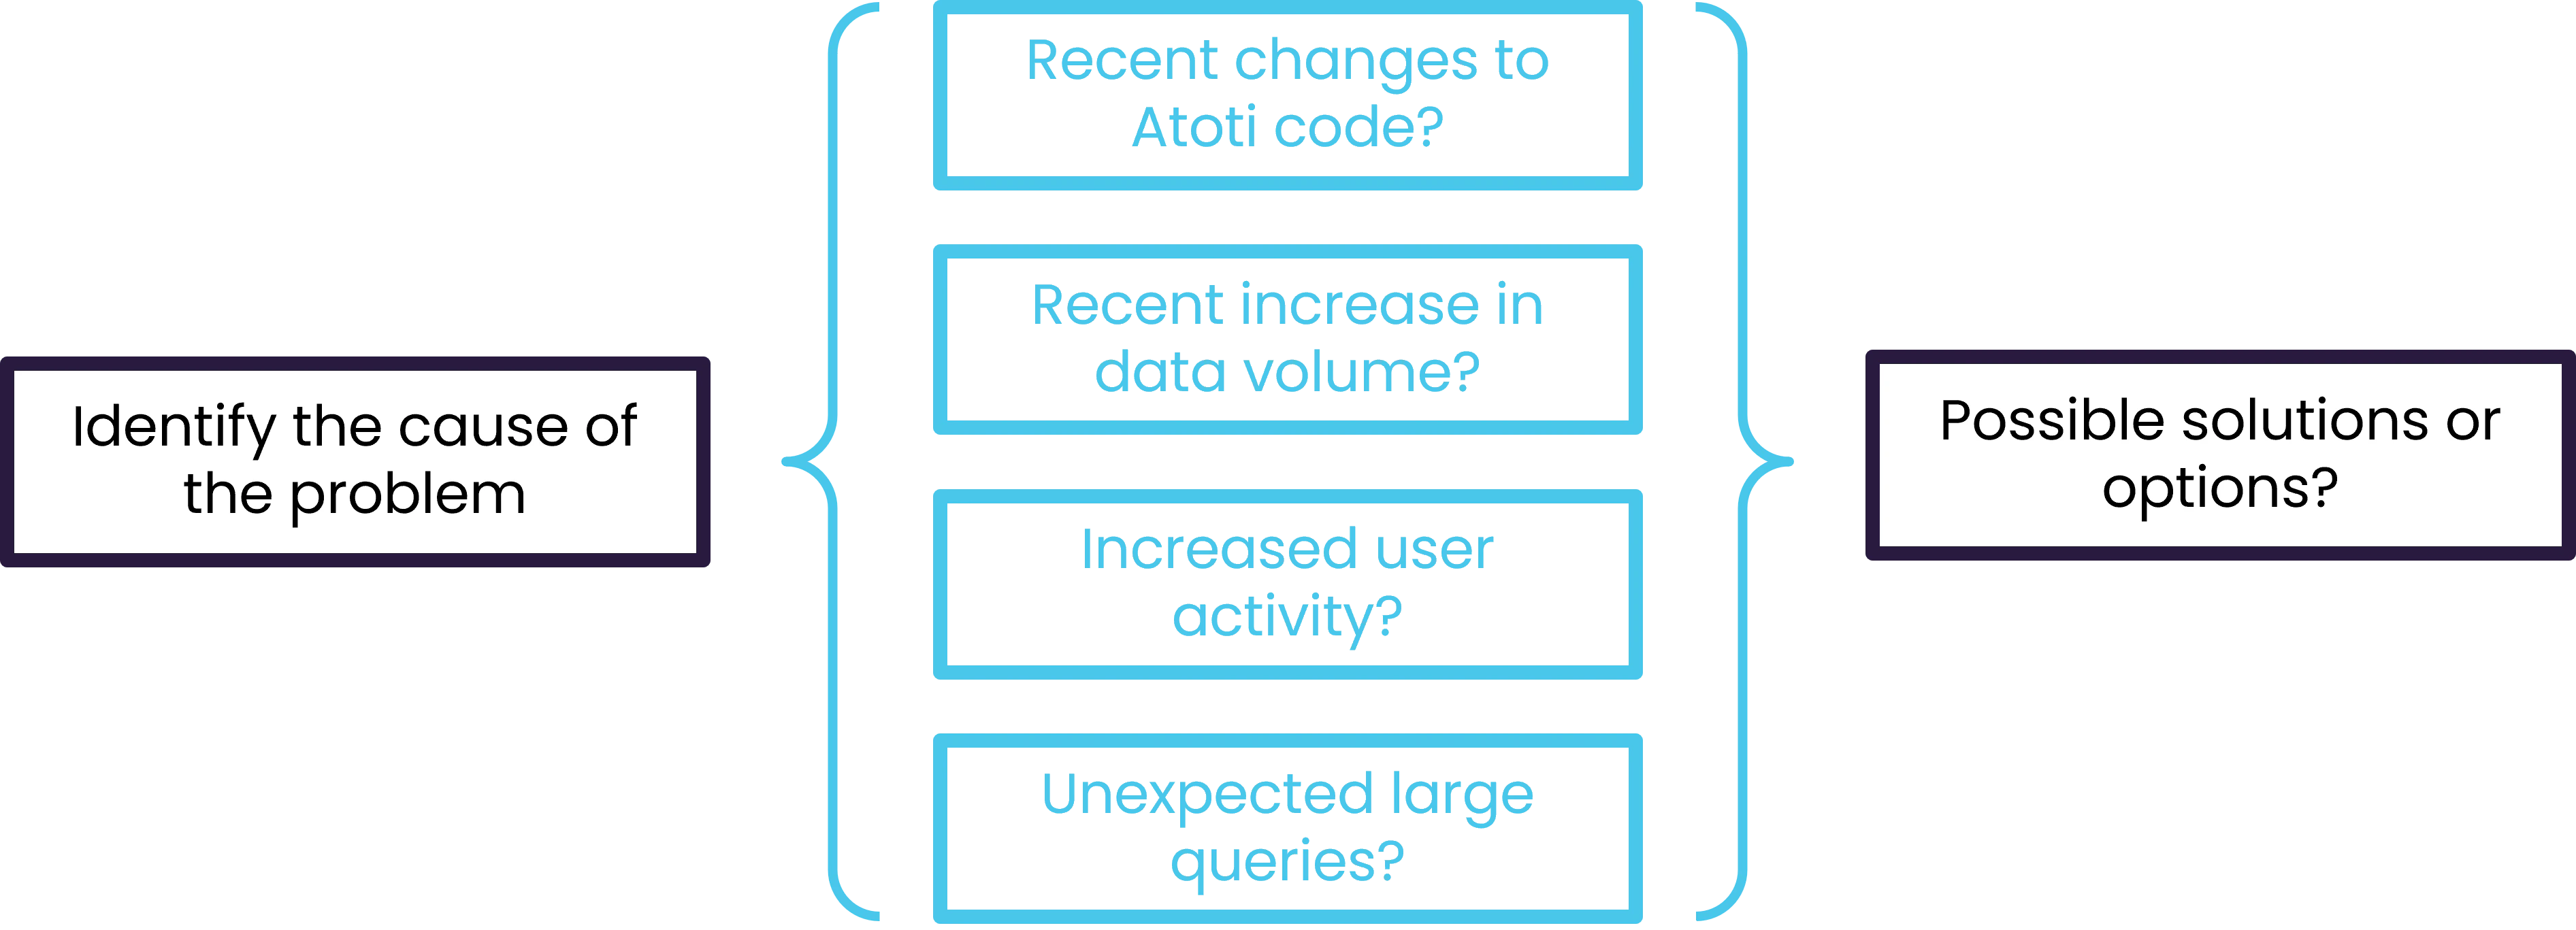
Common causes of performance issues.
4. Fine‑tune the solution
Once the problem is clear, refinements should be made methodically. Atoti tuning is most effective when performed in small, isolated steps:- Change one parameter or configuration at a time,
- Test the impact immediately,
- Observe the results,
- Repeat as needed.
Which strategies can help optimize performance?
The right strategy depends on the type of problem and the context of the project. Hardware constraints, such as available memory and CPU cores, set the boundaries within which all optimization decisions must operate. Most strategies involve a tradeoff between loading speed and query speed. This tradeoff is most visible in two areas covered in the data and query journeys:- Aggregate providers: pre-aggregating data during loading reduces the work required at query time. Queries run faster, but loading takes longer.
- Partitioning: the partitioning strategy affects both how quickly data is written to the datastore and how efficiently queries read it back.