How is multidimensional data organized and queried in Atoti?
Atoti provides a semantic layer using an OLAP cube enabling fast aggregation, data access and queries. A cube introduces some key concepts:- Dimensions: Categories like time, geography, product, counterparty.
- Hierarchies: Structures that organize elements within a dimension to enable intuitive data navigation. Common examples include Year → Quarter → Month or Year → Month → Day.
- Levels: Sets of members with similar properties. For example, Year → Quarter → Month → Date.
- Measures: Quantitative data like P&L, VaR, Exposure.
What is a hierarchy?
A hierarchy contains a list of similar items or members. For example a currency hierarchy may contain the members EUR, GBP, USD, etc.
Table 1: The currency hierarchy and its members
Each hierarchy member is distinct and represents a unique value.
What’s the difference between a single-level and a multi-level hierarchy?
A hierarchy can contain a single level or several levels.- A single-level hierarchy has only one grouping level, such as a currency hierarchy.
- A multi-level hierarchy contains more than one level. A date hierarchy is a common example with the levels year, quarter, month, and date.
For example, the following are members of a date hierarchy:
- 2025 / Q1 / January
- 2025 / Q2 / April / 26th
- 2025 / Q3
- 2025
Table 2: The multi-level date hierarchy and its levels
What is a dimension?
A dimension is a group of related hierarchies.For example, the hierarchies “Currency”, “Date”, and “Trader Location” could be grouped into a dimension “Trades”.
Table 3: The trade dimension and its hierarchies
Most dimensions contain more than one hierarchy. Some of these hierarchies can be multi-level and some hierarchies are single-level.
A level of a hierarchy can belong to more than multi-level hierarchy, depending on your needs. For example:
The dates dimension contains two multi-level hierarchies:
- YMD with levels for Year, Month and Date
- WD with levels for Week, and Day
Which kinds of hierarchy are supported by Atoti?
Atoti supports specific forms of hierarchies: By structure:- Balanced: the number of levels for each path is the same, and data exists only at the lowest level
- Unbalanced: the paths are of differing depths, and data can exist at any level
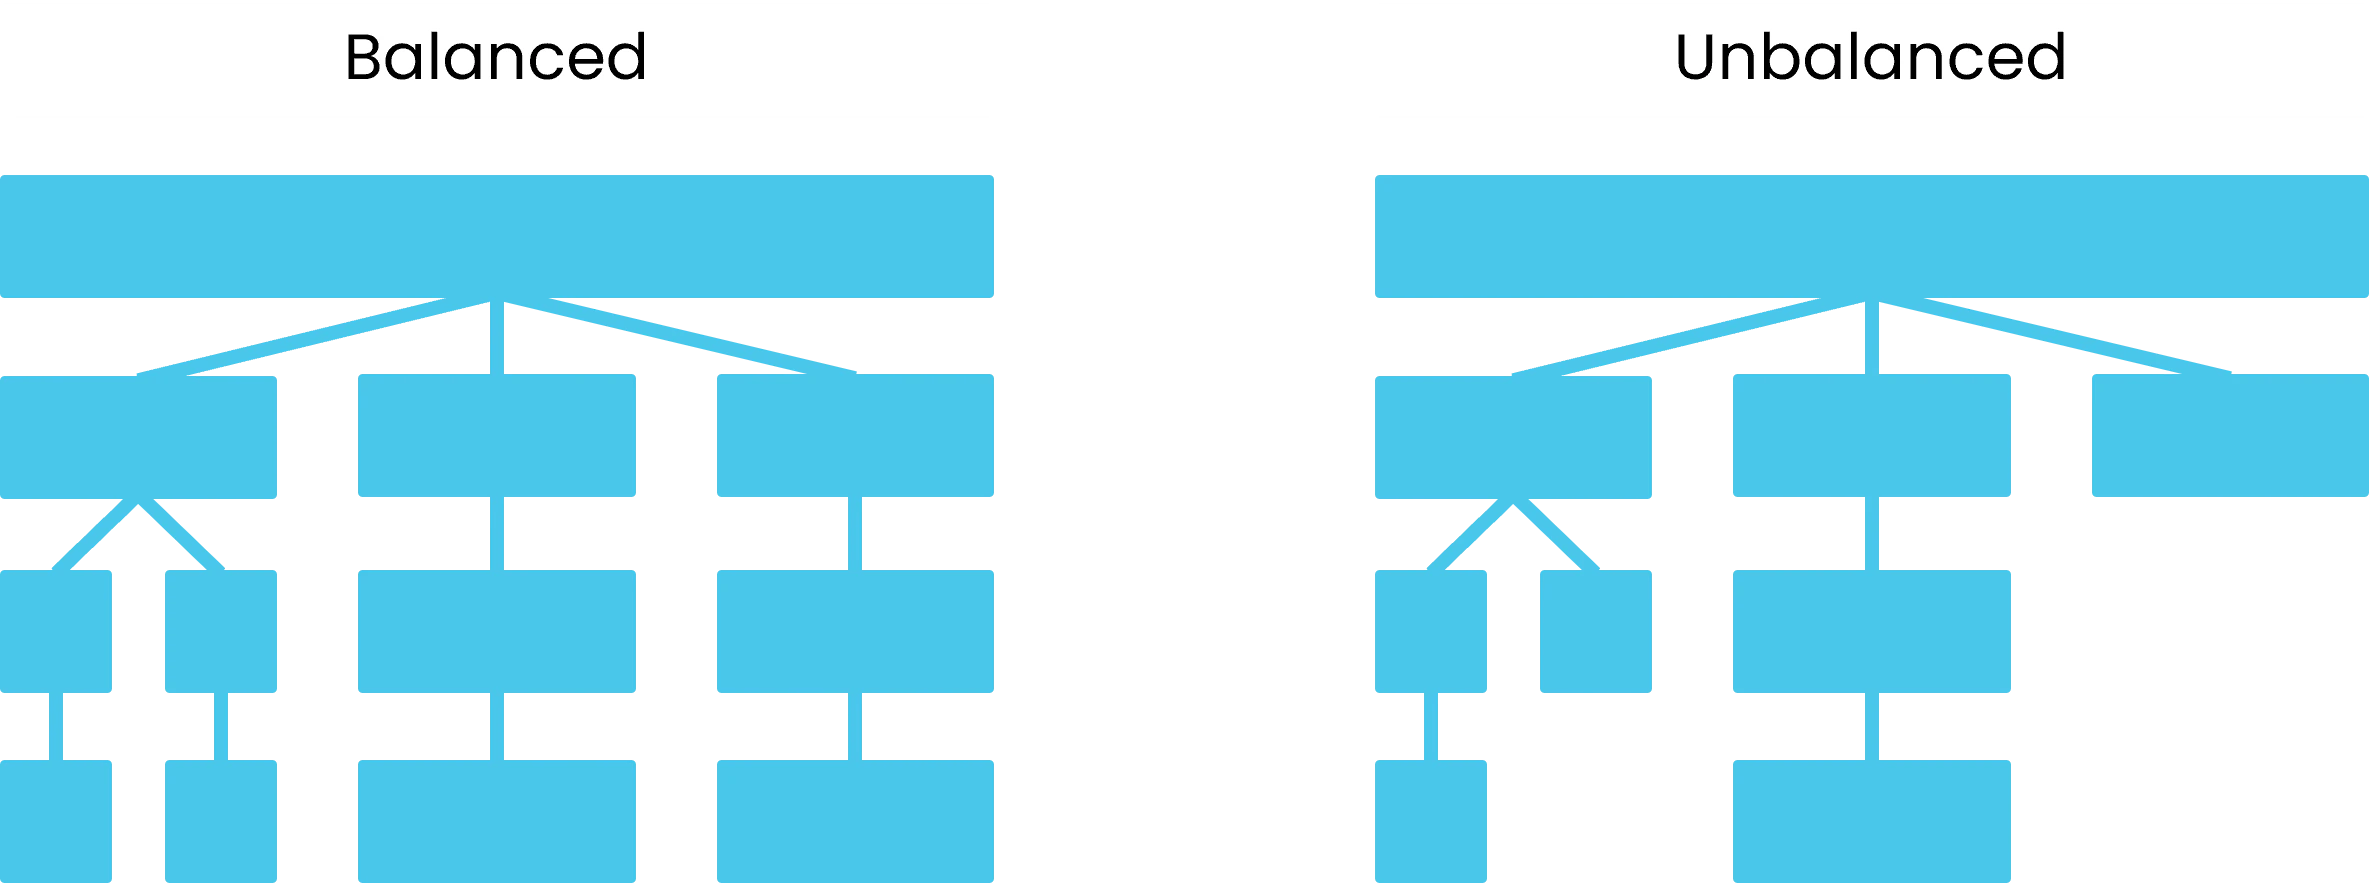
A balanced and an unbalanced hierarchy.
In the example below, there are three paths of equal depth. However, two paths bypass parent levels. It is unsupported by Atoti.
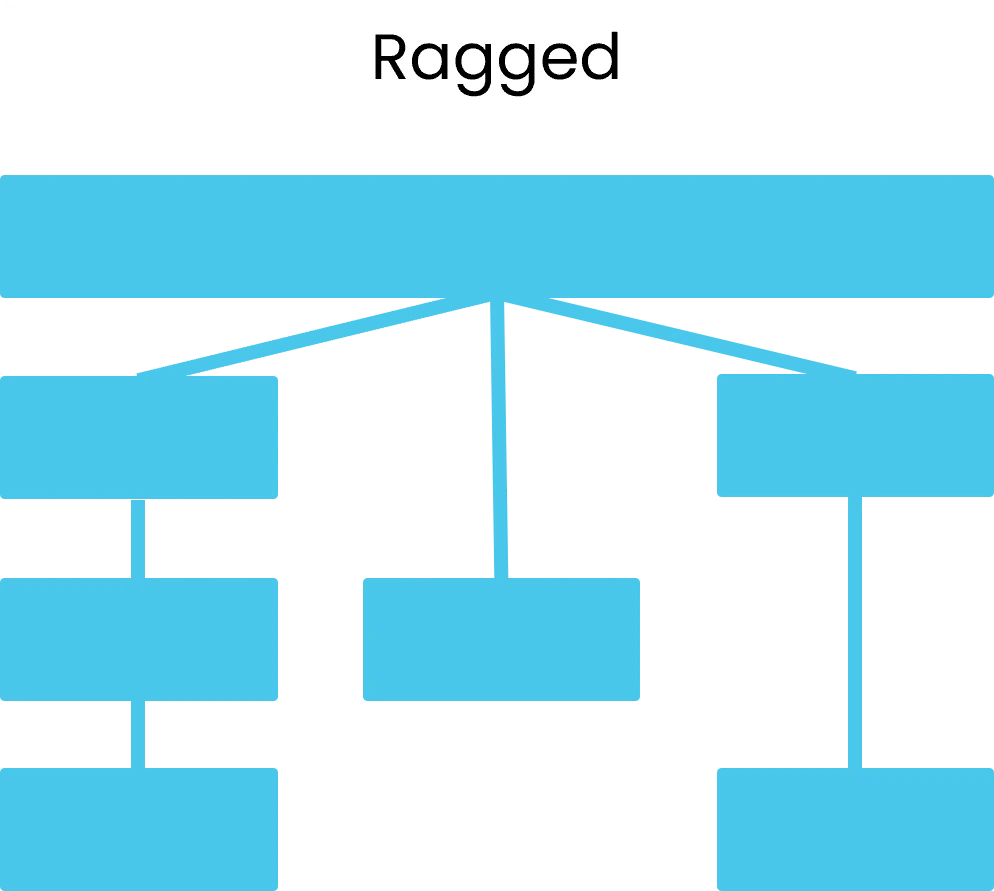
Ragged hierarchies are not supported by Atoti.
What is a slicing hierarchy?
A slicing hierarchy replaces the standard top member with a default member.When to use a slicing hierarchy
The data in a hierarchy can sometimes be sensibly summed or aggregated. For example, sales data in the geography hierarchy can be summed to give a global sum. The aggregated value is in AllMember for a hierarchy.
Table 4: AllMember and other members for the geography hierarchy
Not all hierarchies can be aggregated in this way. Some data cannot be easily summed, for example the sales figures for different currencies cannot be summed without taking into consideration fluctuating exchange rates. In this case, the hierarchy can be set as a slicing hierarchy.
For non-slicing hierarchies, the AllMember is used as a default for the hierarchy. When no specific member of the hierarchy is selected, AllMember is displayed. For slicing hierarchies, a slicing member is displayed as the default in place of AllMember.
Table 5: Default members for the quarter and currency hierarchies
Common uses of slicing hierarchies include:
- currency: retrieve aggregated values for a single currency at a time
- date: retrieve the values for AsOfDate (or another date) by default
Related reading
Find out how to set a slicing hierarchy:Where do hierarchy members come from?
Hierarchy members come from table fields or from definitions created during cube configuration. There are three ways to create hierarchy members.Members from table fields
Some hierarchy members come directly from table columns. A table hierarchy uses values found in the data model. For example, a Country level can include members such as France, Germany, and Japan if these values appear in a country column. These members support filtering. Selecting the France member limits the analysis to records associated with France.Members created from static definitions
Some hierarchy members are created using a fixed list of values defined during configuration. The members do not depend on values in the data model. A manual hierarchy stores these predefined members. Manual hierarchies are useful when the categories needed for analysis do not exist in the source data and do not change at runtime. Examples include business structures defined by a specific reporting framework.Members created programmatic logic
Some hierarchy members are defined using logic that evaluates data. These members do not come from table fields and are not part of a fixed list. They are constructed at runtime or during setup. A derived hierarchy contains these programmatically defined members. This type of hierarchy is useful when grouping rules require calculations, thresholds, or context values. Examples include:- Maturity buckets that group trades into periods such as less than one week, one month, or one year.
- Threshold-based buckets that sort items into low, medium, or high categories.
- Groupings based on business logic, such as scenario or simulation parameters that are not present in the data source.
What is data bucketing?
Data bucketing is a technique used to group detailed raw data into broader categories, or “buckets”, to simplify analysis and make patterns easier to detect. Bucketing reduces the complexity of raw data. Instead of analyzing every individual data point, buckets group data into meaningful ranges or categories.- Time-based buckets: Data is not analyzed by individual days or months. It is grouped into quarters or years. For example, data from the months can be bucketed into Q1, Q2, Q3, and Q4 to observe seasonal trends.
- Threshold-based buckets: Buckets group data based on numeric thresholds. For instance, risk categories might be classified as low, medium, or high depending on credit or other ratings.
- Contextual buckets: Buckets are also defined using business logic. For example, bonds are grouped into short, mid and long term depending on the maturity dates.