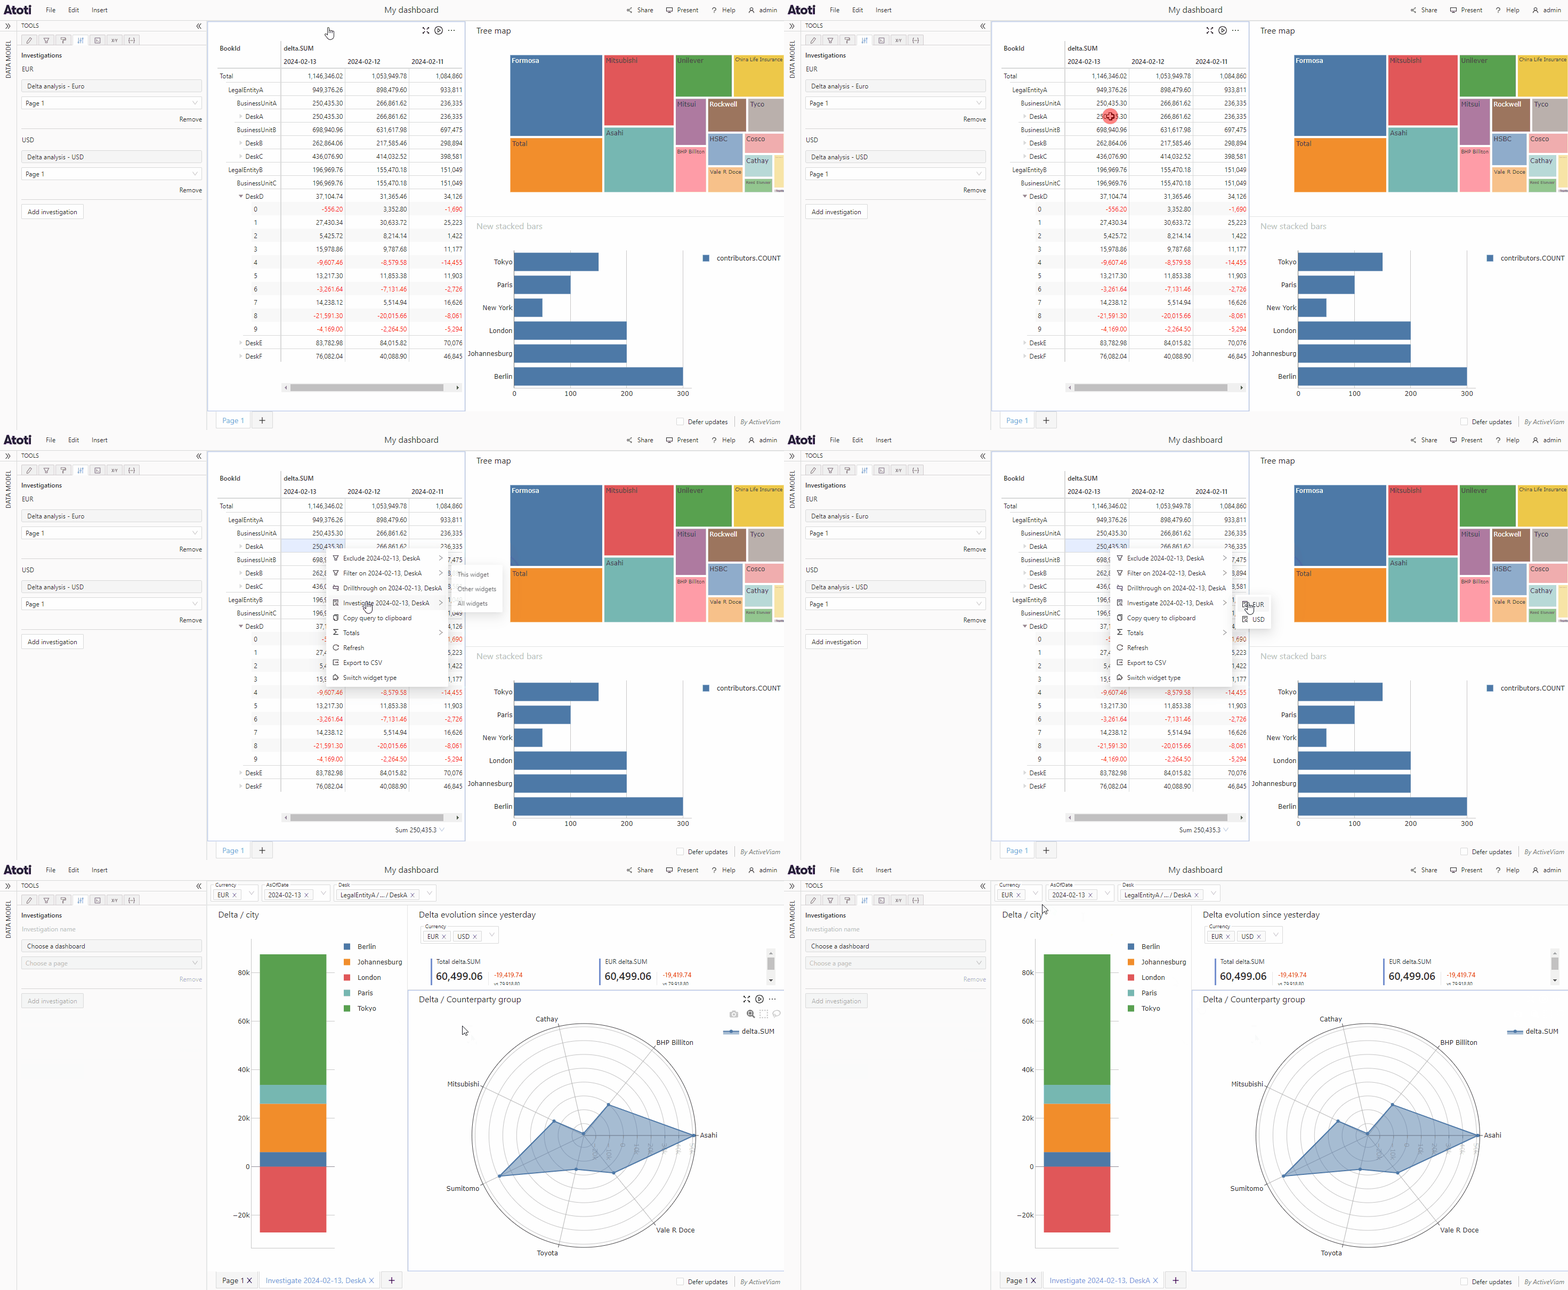

Create an investigation dashboard
Investigations are based on a page in a dashboard. This can be a dashboard already in use, or specifically created to be used in an investigation.Open the behavior tab
The Behavior tab is accessed from the Tools, next to the data model on the left of the application. Click on its icon to open it.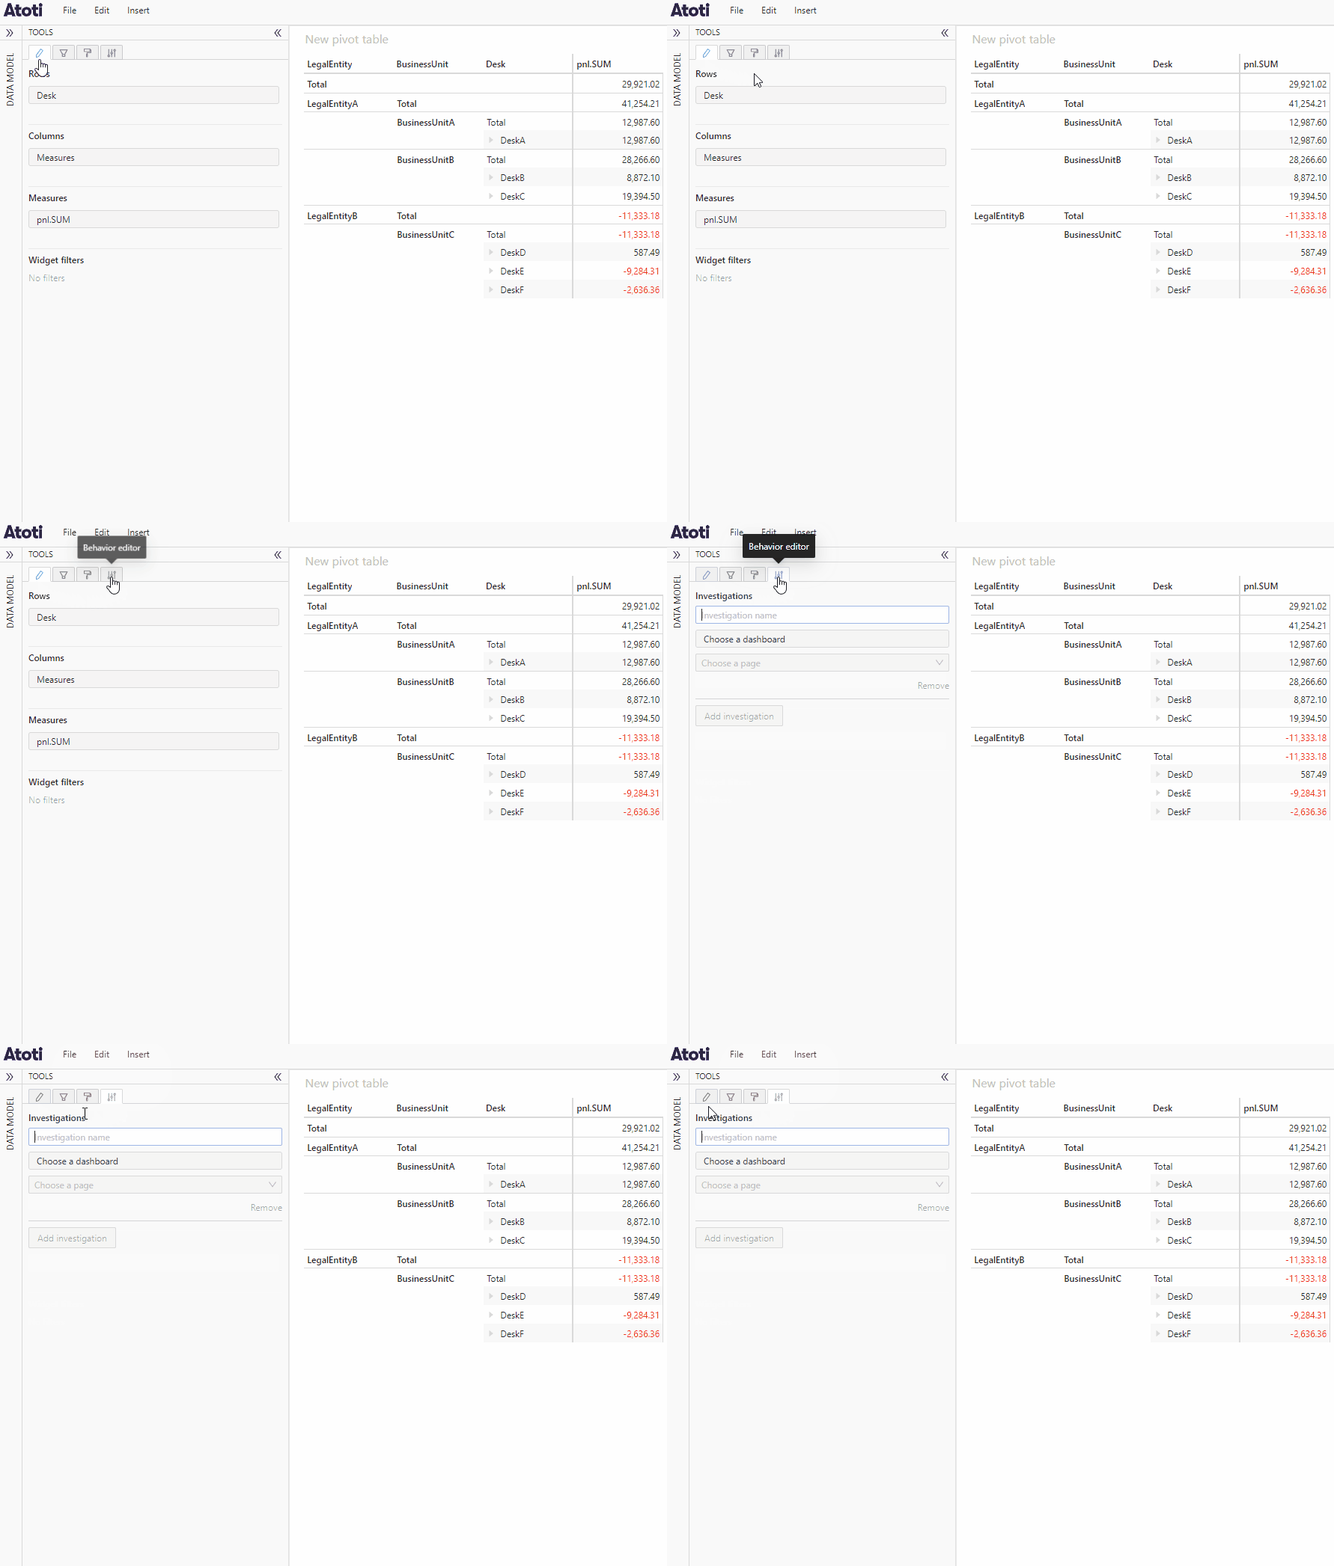
Configure an investigation
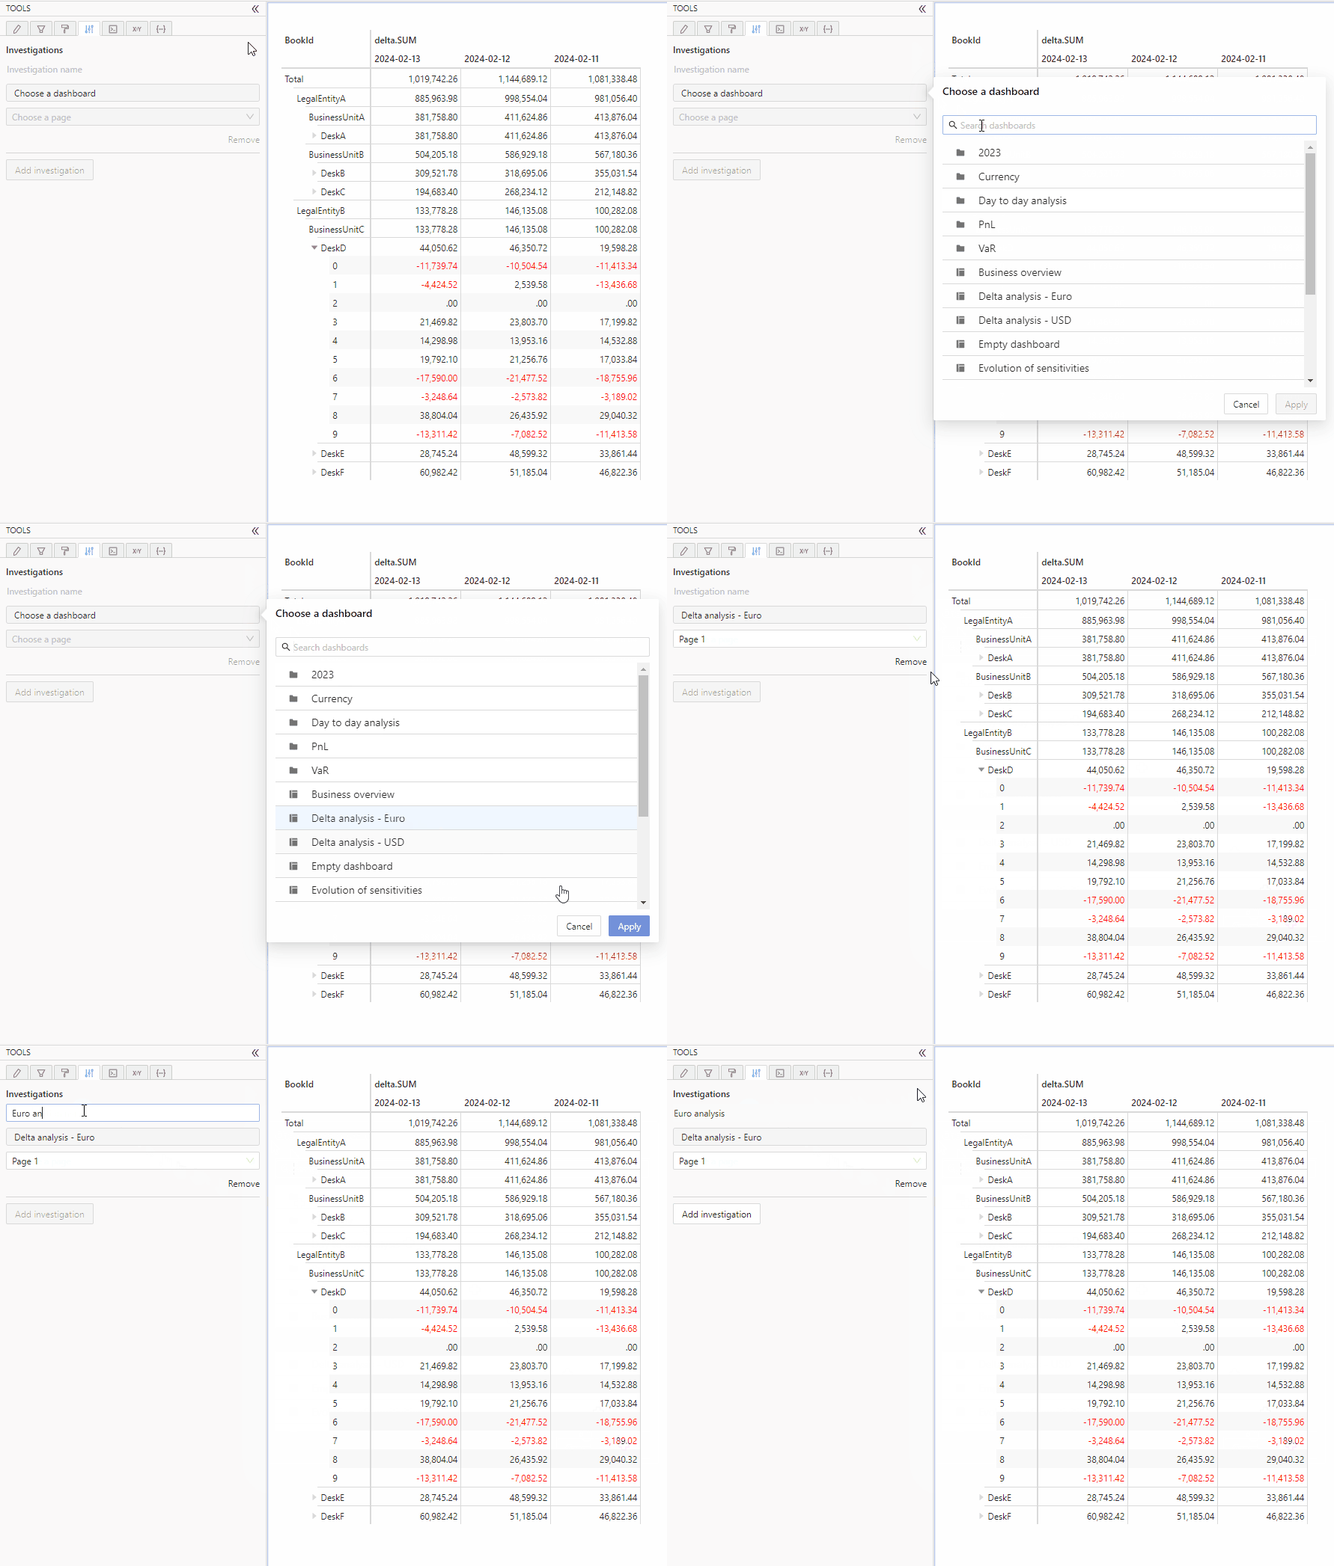
To add an investigation to a widget:- Click the Behavior icon, next to the data model on the left of the application.
- Type in the name of your investigation. It will allow you to find it in the Investigate menu item, in case you add multiple investigations.
- Choose the dashboard to use for your investigation. Note that you can create and save a dedicated dashboard beforehand if needed. To know how, you can read Create a dashboard.
- If the dashboard page to use for your investigation is not the first page of the chosen dashboard, then select it.
- Repeat the steps above to create multiple investigations.
Use an investigation
Once you have configured it, to use your investigation right click a table cell or chart point you wish to investigate. In the dropdown menu choose which of the investigations you would like to use. This will open a new page with the selected investigation.