Epoch Chart
Example
Summary of settings
- Type of chart: Lines
- Mapping of "y" attribute: pnl.FOREX
- Mapping of "x" attribute: Epoch_as_Date
Step-by-step instruction
Add a new Chart Widget
Select "Lines"
If there are multiple cubes connected to your application, you must select the cube you want for the chart.
Map the "x" attribute to Epoch.
Map the "y" attribute to the relevant measure, in this case pnl.FOREX.
Let's focus on a single Trade: on the main filter panel, create a new filter on Trade and select one trade, in this case 55.
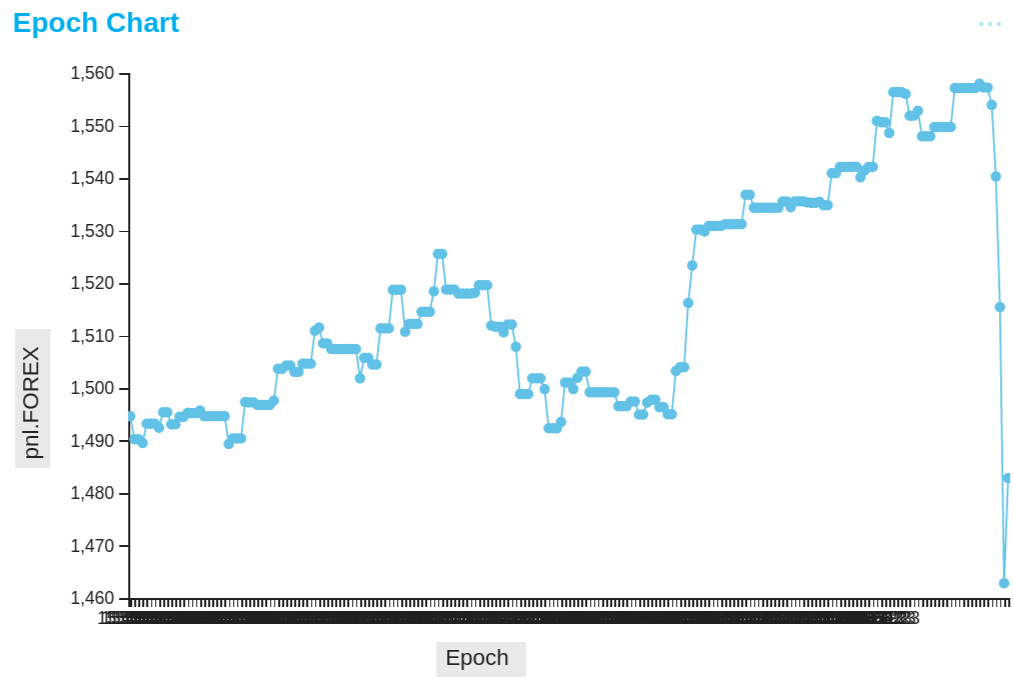
The initial chart displays each Epoch side-by-side and the Epochs on the X axis are not interpreted as dates: this is because Epochs are referenced by their unique id in ActivePivot and are returned as such. We must force the conversion to date with a calculated measure. We'll create that measure with the help of a Tabular View.
Right click on the chart, select "Show Data" and choose the option "Below the current widget". This will create a new Tabular View widget with the same underlying MDX as the chart.
On the Tabular View, add a new column, choose formula, clear the formatting ("Format Number As") and use the following expression to convert each Epoch into a date:
CDate(
  [Epoch].[Epoch].CurrentMember.MemberValue
)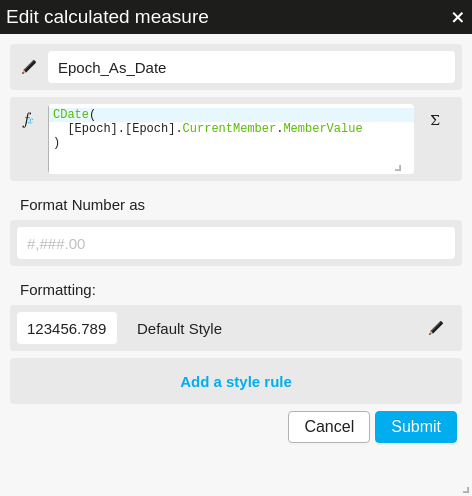
Overview of the dashboard so far (Tabular View moved to the right):
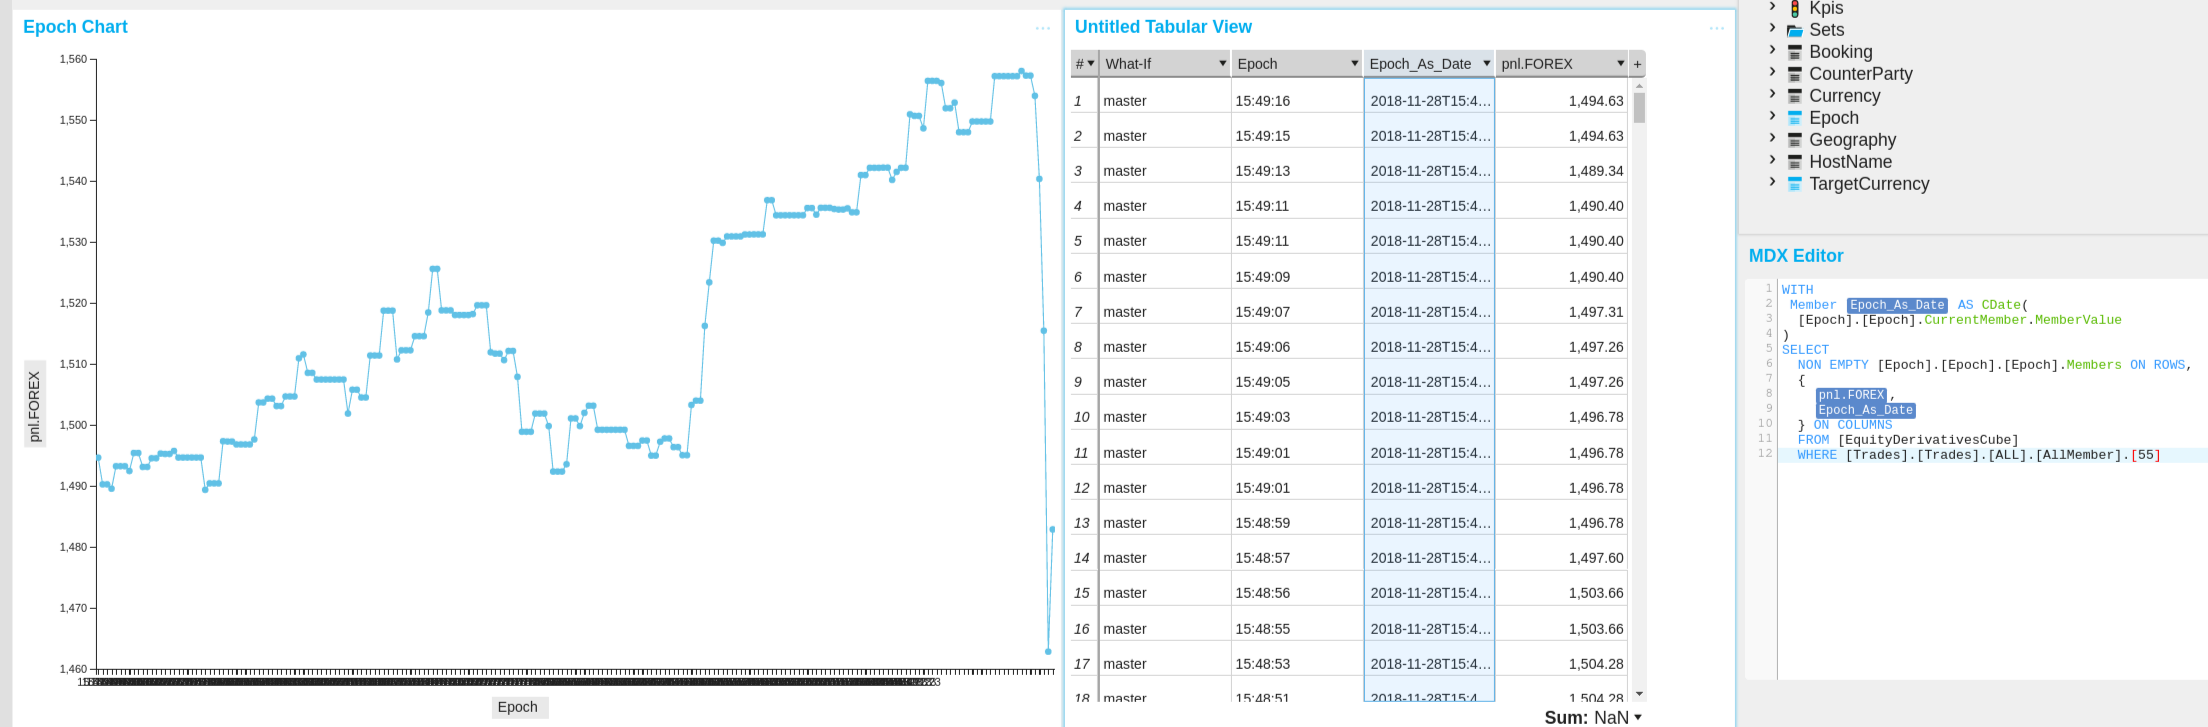
Focus on the Tabular View and copy the underlying MDX from the query editor.
Focus on the Chart and paste the underlying MDX in the query editor.
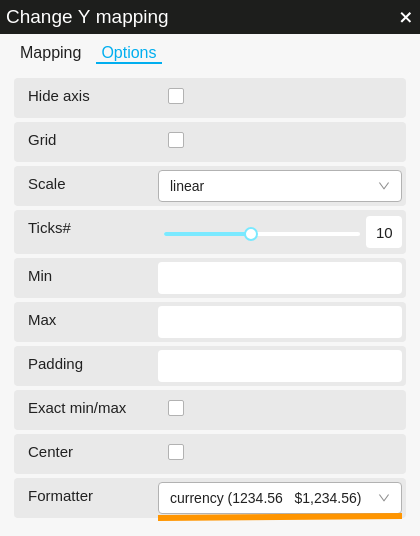
Right click on the Chart, select "State" to open the chart configuration. In particular, focus on the "mapping" section and update it to map the X axis to the new calculated measure:
"mapping": {
    "x": {
      "from": [
-       "[Epoch].[Epoch].[Epoch]"
+       "[Measures].[Epoch_As_Date]"
      ]
    },
    "y": {
      "from": "Value"
    },
    "split": {
      "from": [
        "numeric"
      ],
      "numericMembers": [
        "[Measures].[pnl.FOREX]"
      ]
    }
  }
Click on the Y axis pnl.FOREX button, select options and choose the currency formatter.
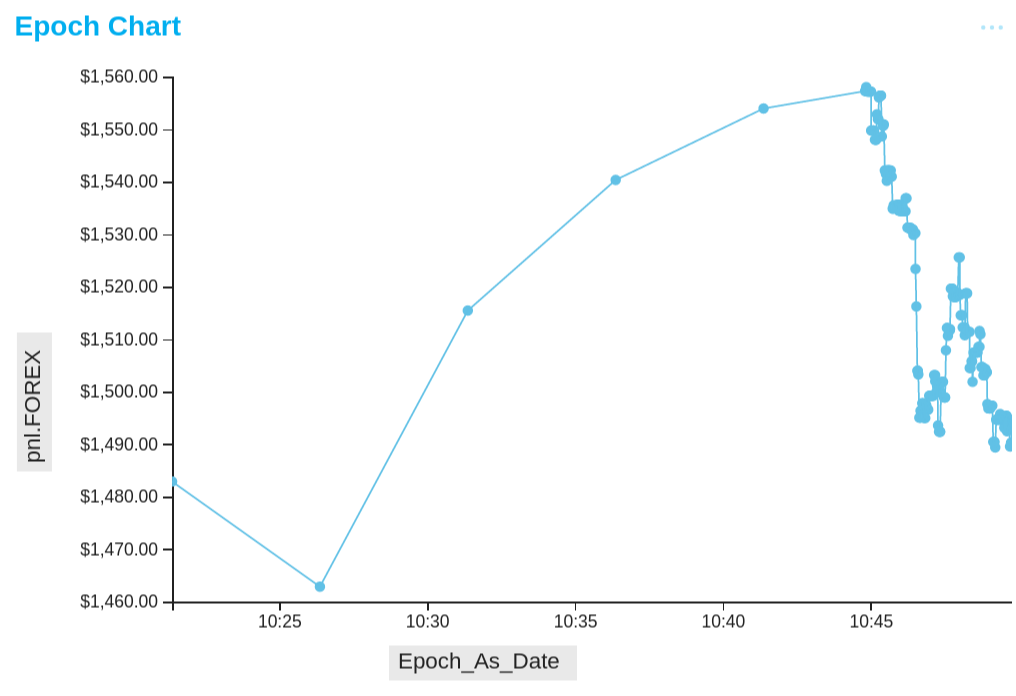
The chart is complete:
Back to Chart Gallery
Appendix
The appendix contains code snippets for advanced users.
MDX:
WITH
 Member [Measures].[Epoch_As_Date] AS CDate(
  [Epoch].[Epoch].CurrentMember.MemberValue
)
SELECT
  NON EMPTY [Epoch].[Epoch].[Epoch].Members ON ROWS,
  {
    [Measures].[pnl.FOREX],
    [Measures].[Epoch_As_Date]
  } ON COLUMNS
  FROM [EquityDerivativesCube]
  WHERE [Trades].[Trades].[ALL].[AllMember].[55]
JSON:
{
  "configurations": [
    {
      "handlers": {
        /* ... */
      },
      "type": "combo-line",
      "mapping": {
        "x": {
          "from": ["[Measures].[Epoch_As_Date]"]
        },
        "y": {
          "from": "Value"
        },
        "split": {
          "from": ["numeric"],
          "numericMembers": ["[Measures].[pnl.FOREX]"]
        }
      },
      "legend": {
        "display": "hidden"
      }
    }
  ]
}