This section outlines your available choices when creating limits. In particular, it
focuses on the following fields of the Limit Structure panel:
Field Name
Description
Rule
The supported limit rules are: - Greater Than: The limit has a breach status when the measure value is greater than the specified value. - Less Than: The limit has a breach status when the measure value is less than the specified value.
Warning
Enables or disables warning status when utilization reaches a specified percentage of the limit value. This is useful when you want to monitor when limits have high utilizations, for example, over 80%.
Warn when utilization reaches % of a limit
The warning threshold defines how close the value is to the limit before triggering a warning. The KPI status is displayed as an amber triangle in the pivot table when the status is a warning.
For example, for a “greater than” limit of 10,000 and a warning set at 90%, a warning is generated when the value reaches 9,000, which means there is 10% of the limit remaining before a breach.
For a “less than” limit of 10,000 and a warning set at 90%, a warning is generated when the value reaches 11,000, which means there is 10% of the limit remaining before a breach.
Value/Absolute Value
Sets whether the measure value should be interpreted as an absolute value when comparing to limit value. This is useful, for example, when you want to set sensitivity limits, which can be positive or negative numbers, but should be monitored as an absolute value.
In essence, you have the following options available when designing a limit:
Rule: Choose between Greater Than and Less Than.
Warn utilization reaches % of a limit: Choose between true and false. If true, specify the percentage.
Absolute Value: Choose between true and false.
This means that there are 8 possible combinations that can be used when designing a limit:
The following section visualizes what this means for your limits.
Overview
In the following examples we will use similar data to illustrate the different combinations of limit
design. The data is as follows:
the limit value will be 1,000 or -1,000
when used, the warning threshold will be 80% of the limit value
In the cases where the limit uses an absolute value, the visualization of both the negative and the
positive limit will be the same, so only one diagram is required.
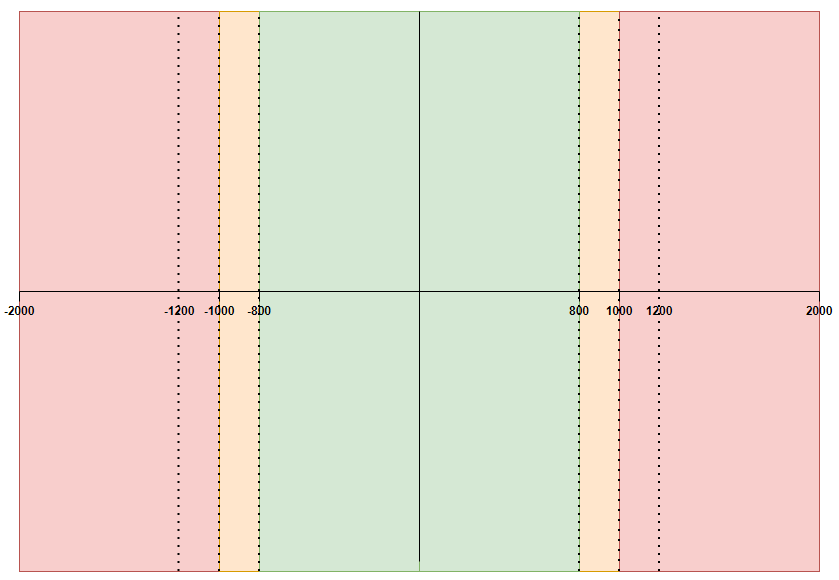
In the following diagrams, given the scenarios for each case, the colored zones illustrate
numerical regions where the limit will:
breach, denoted by red zones
warn, denoted by amber zones
pass, denoted by green zones
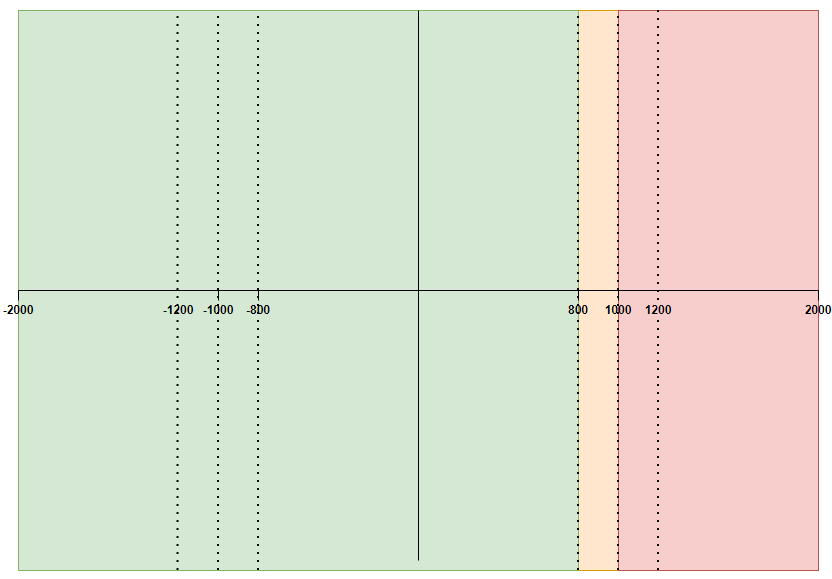
Case 1
Rule
Warning
Absolute Value
GREATER_THAN
True (80%)
True
Diagram
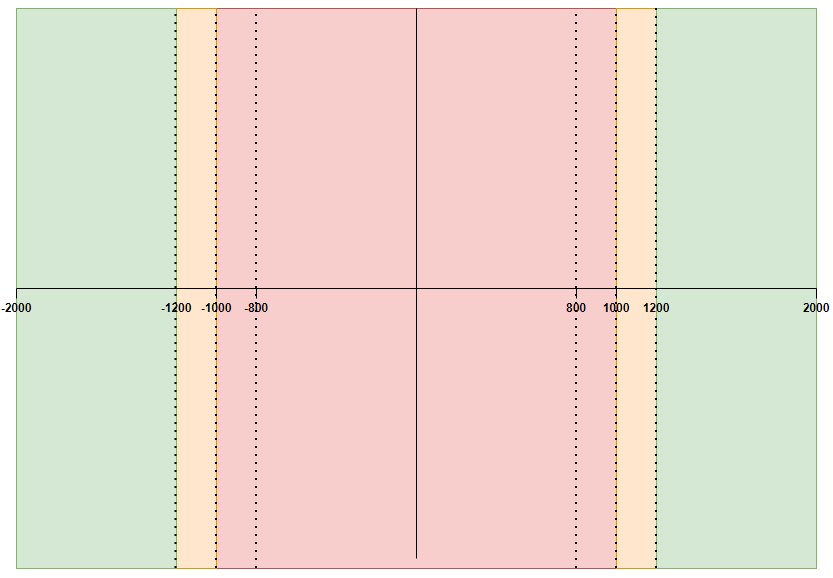
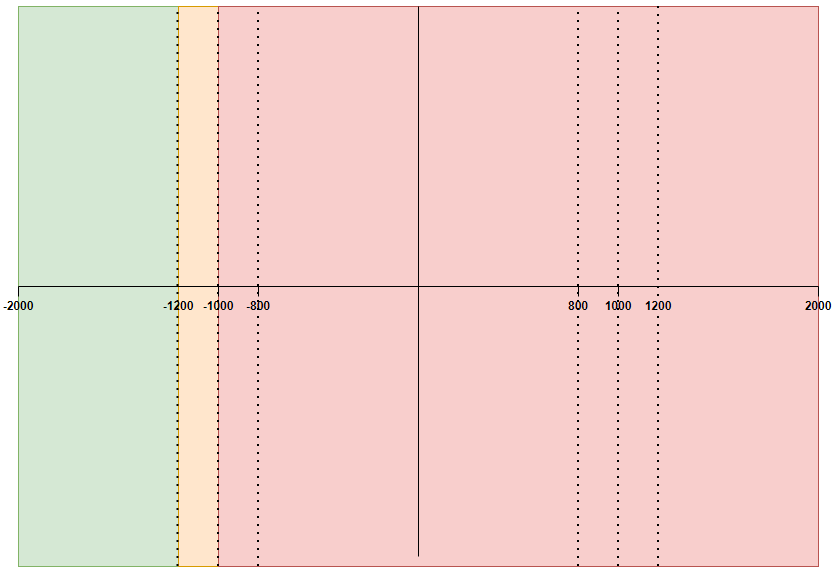
Case 2
Rule
Warning
Absolute Value
LESS_THAN
True (80%)
True
Diagram
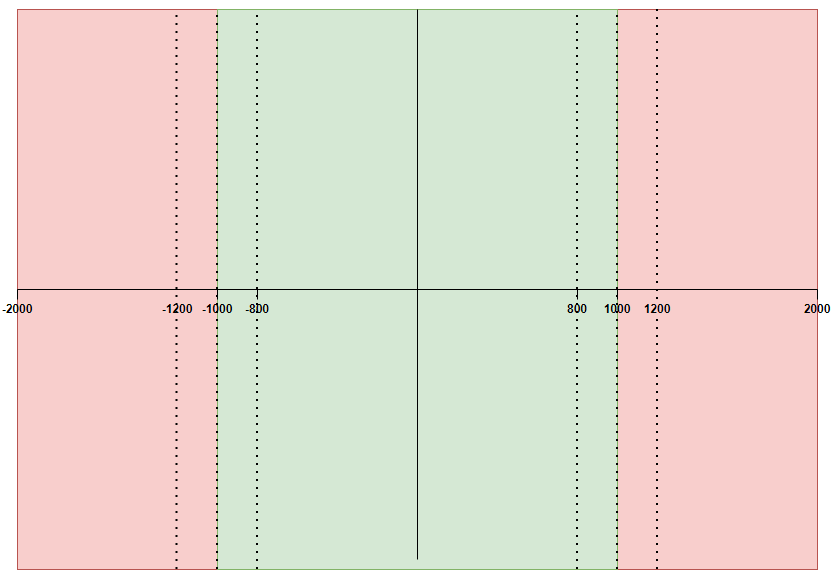
Case 3
Rule
Warning
Absolute Value
GREATER_THAN
False
True
Diagram
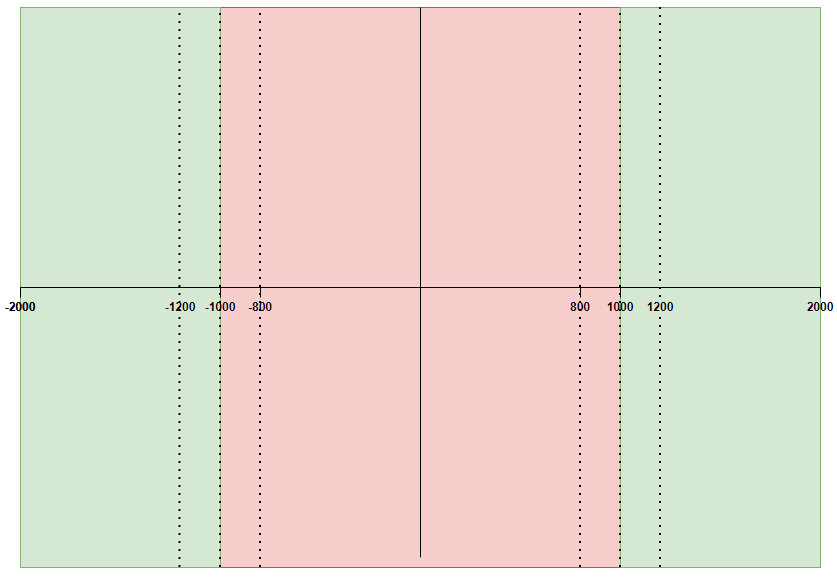
Case 4
Rule
Warning
Absolute Value
LESS_THAN
False
True
Diagram
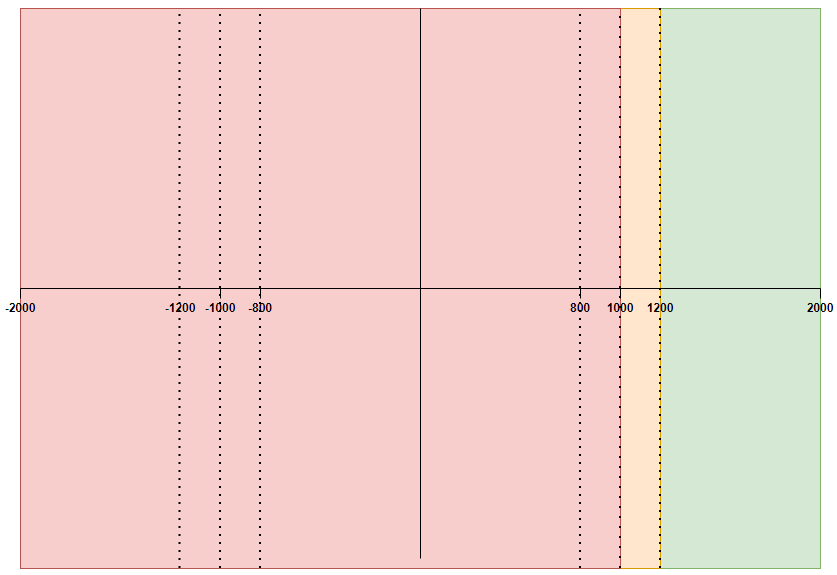
Case 5
Rule
Warning
Absolute Value
GREATER_THAN
True (80%)
False
Diagram
Positive Limit Value (1,000)
Negative Limit Value (-1,000)
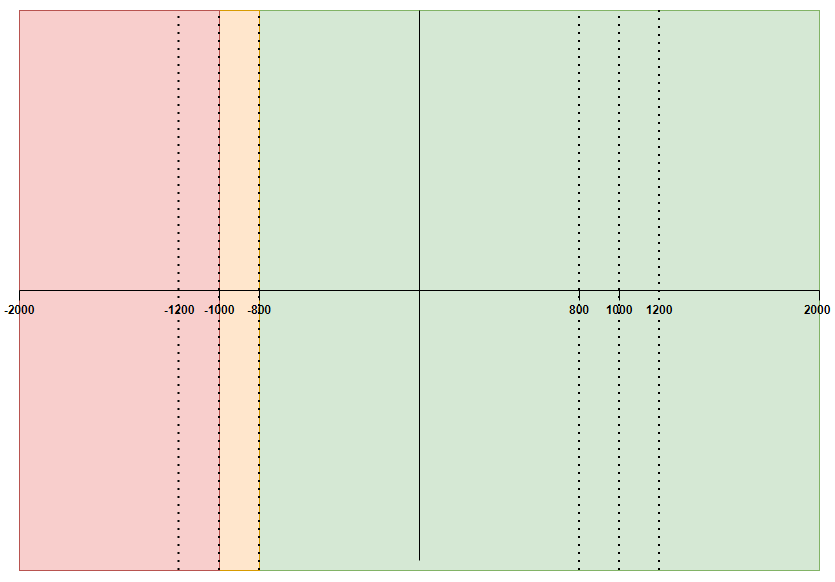
Case 6
Rule
Warning
Absolute Value
LESS_THAN
True (80%)
False
Diagram
Positive Limit Value (1,000)
Negative Limit Value (-1,000)
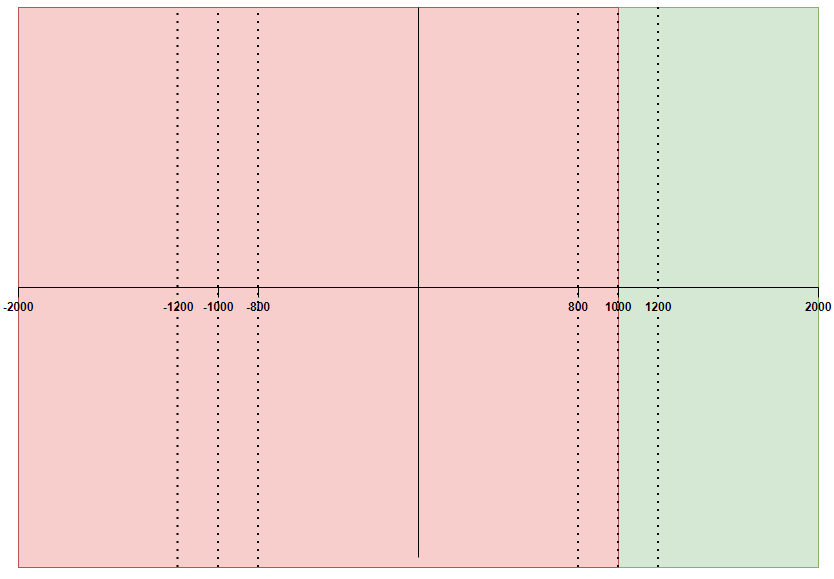
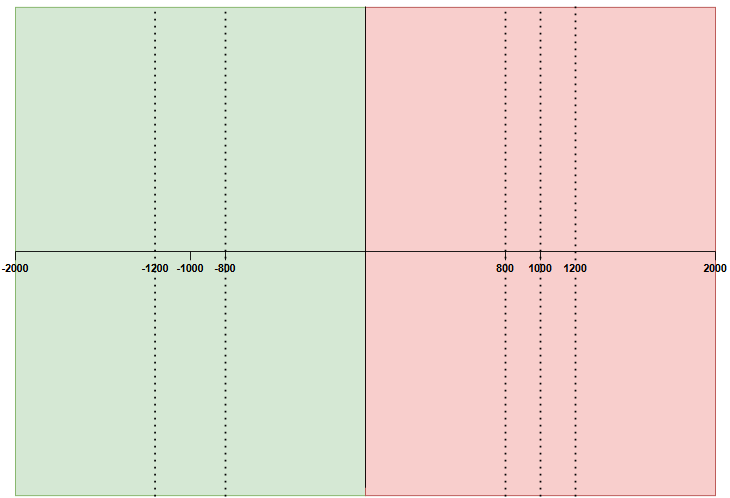
Case 7
Rule
Warning
Absolute Value
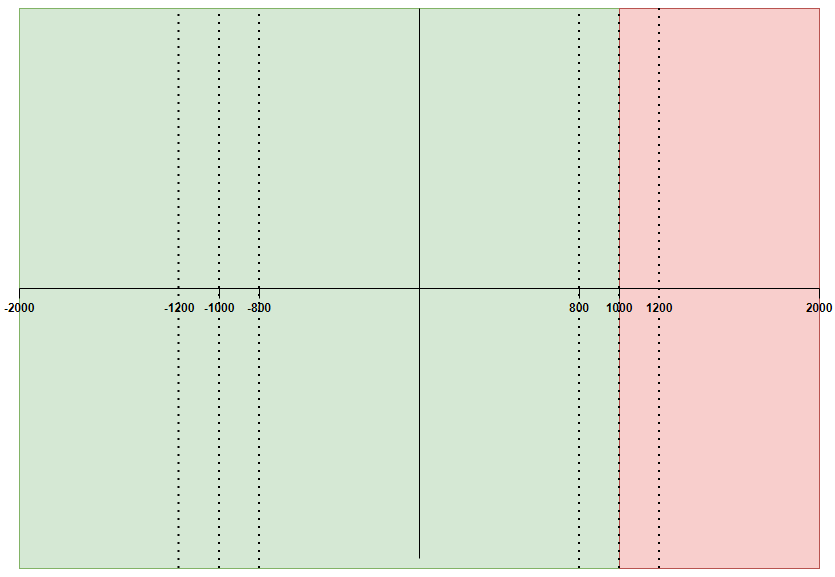
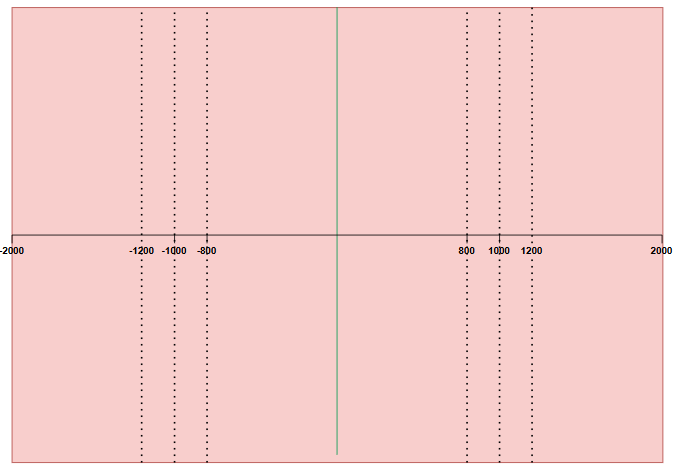
GREATER_THAN
False
False
Diagram
Positive Limit Value (1,000)
Negative Limit Value (-1,000)
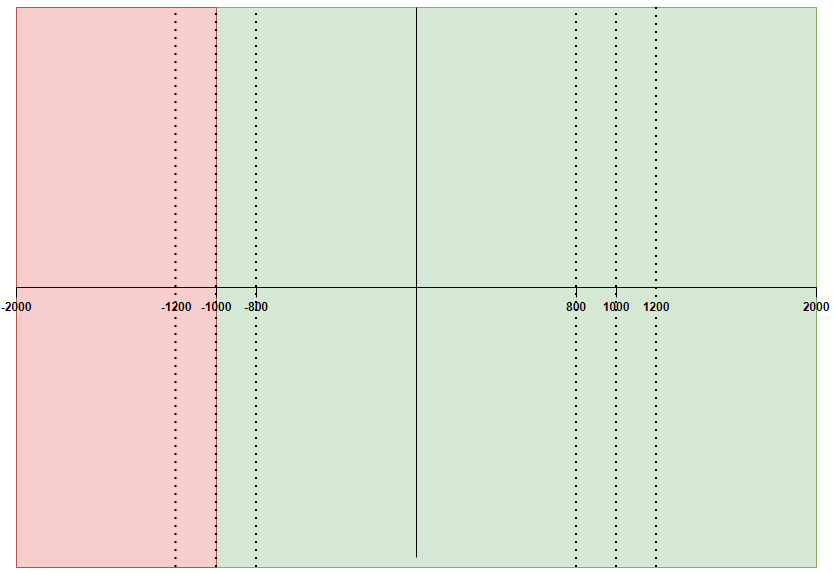
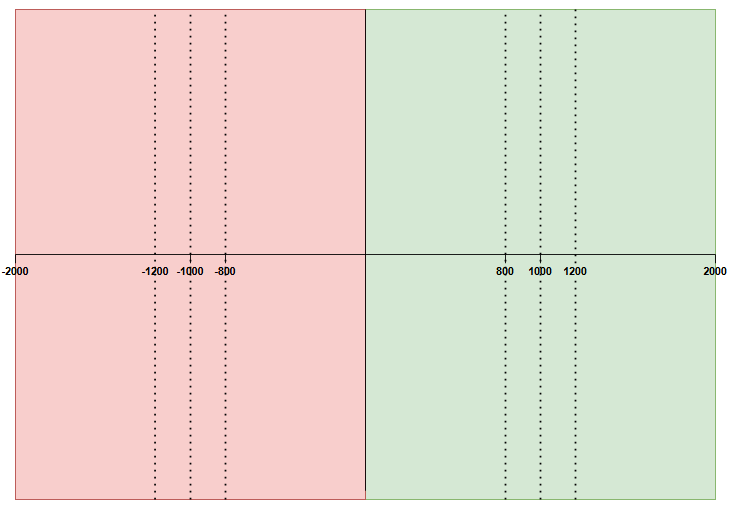
Case 8
Rule
Warning
Absolute Value
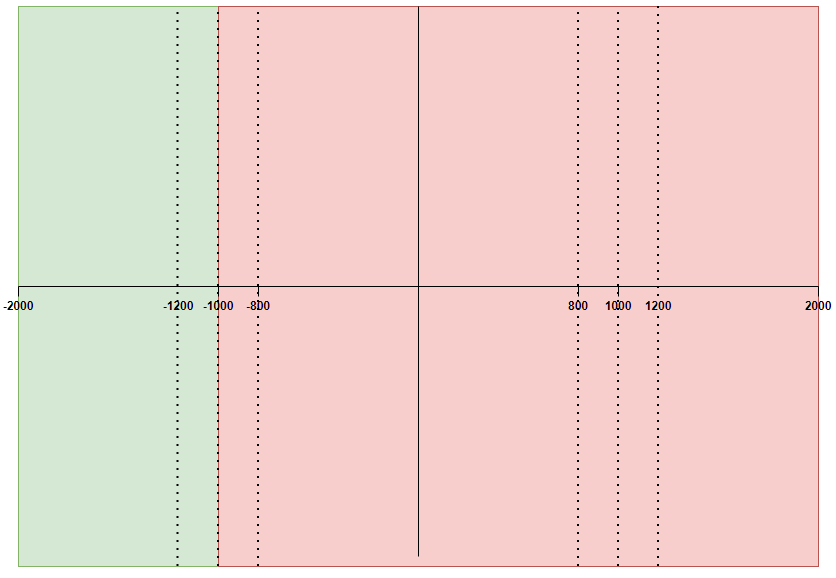
LESS_THAN
False
False
Diagram
Positive Limit Value (1,000)
Negative Limit Value (-1,000)
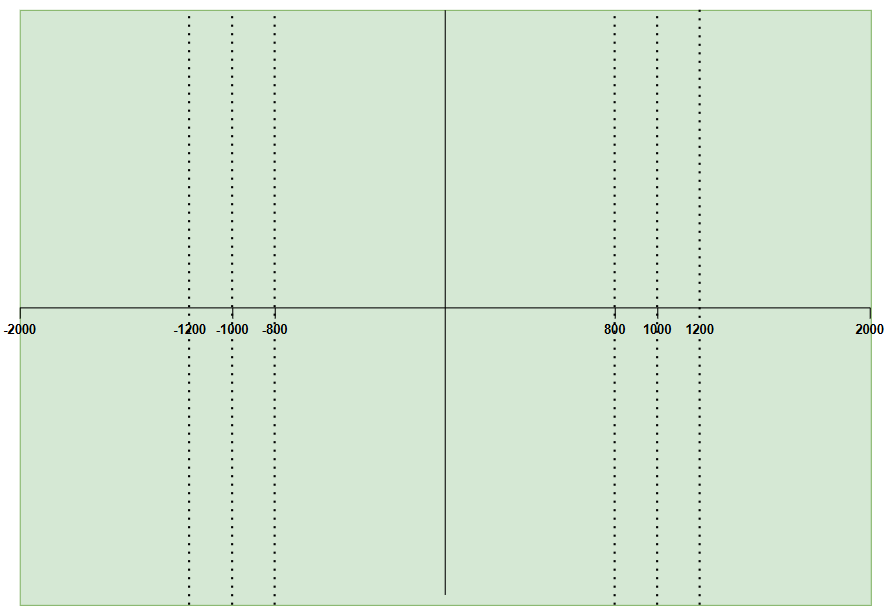
Setting the limit value to 0
We will also consider four special cases where the limit value is 0. When the limit value is 0, it is not possible to
generate a warning. This is because the calculation of the warning range multiplies the warning threshold by the limit
value, which always results in zero in this case. This also means the utilization
cannot be calculated due to the zero denominator.
It is also not possible for breaches to occur when the limit value is 0, the rule is set to LESS_THAN, and the
absolute value is set to True, as the measure value will always be greater than or equal to 0. This is shown in
Zero case 4 below.