Inventory
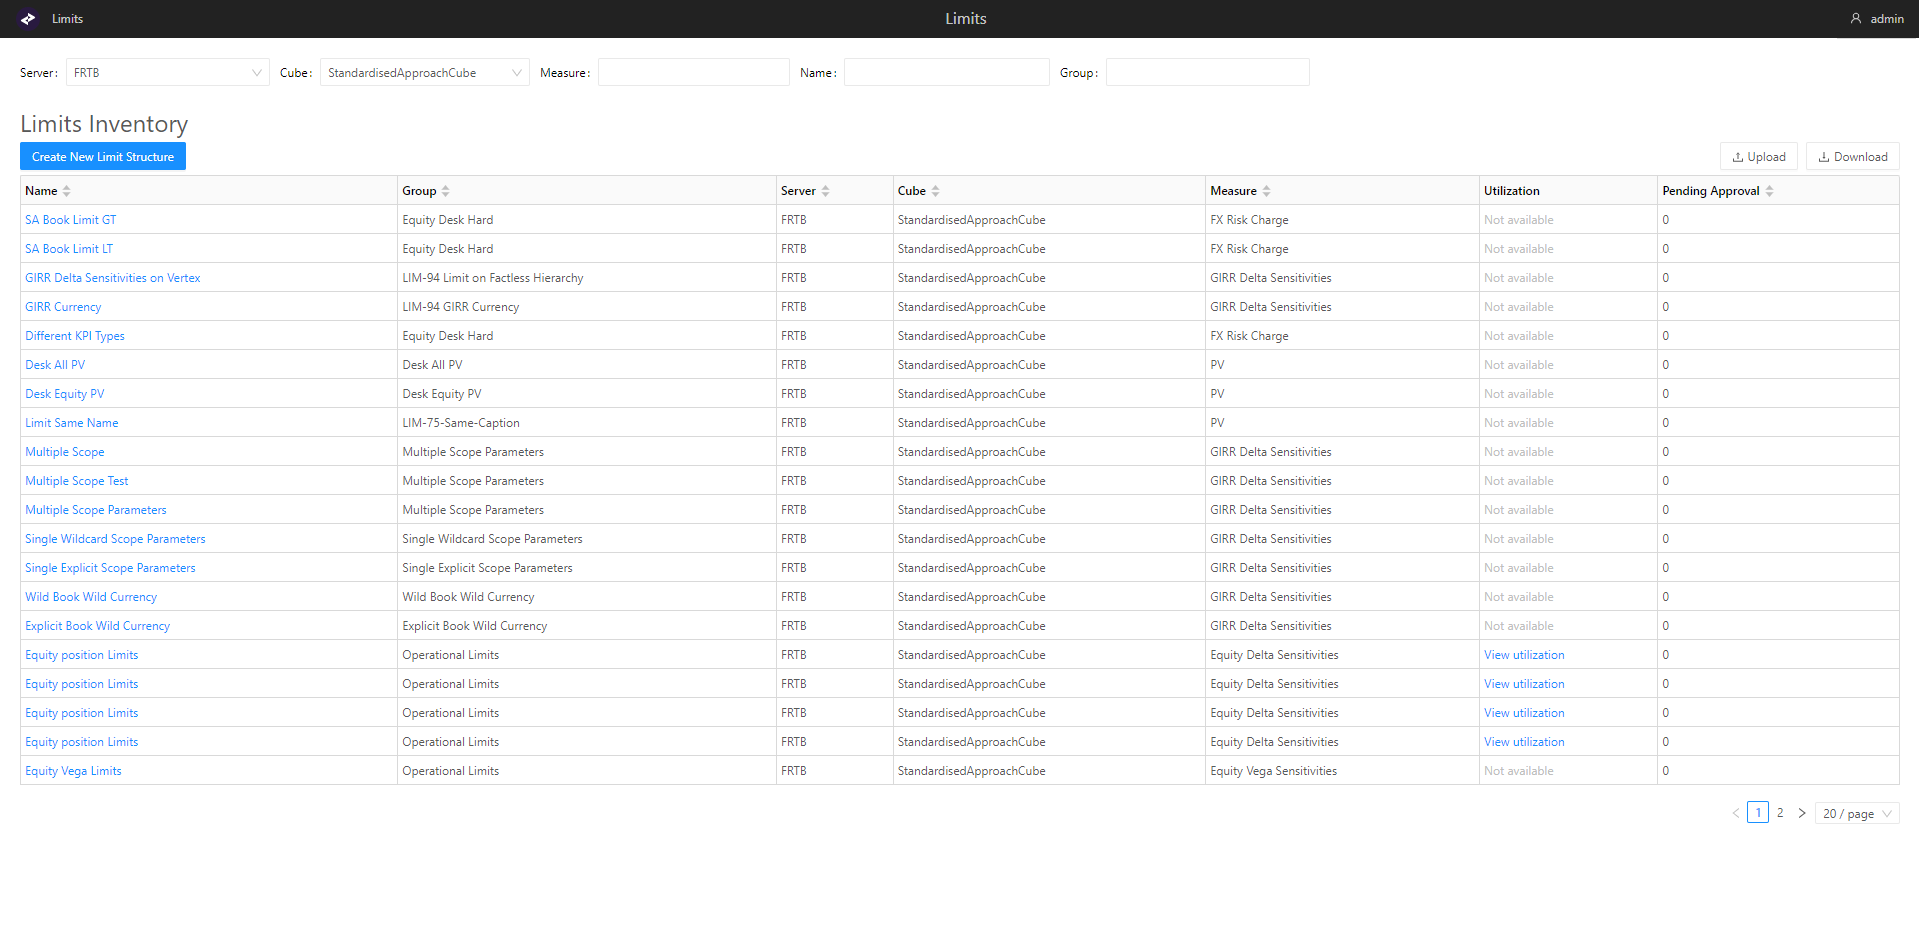
The Inventory screen is where you can view and edit your existing limits, and create new ones.
The screen contains a table with a list of your limits.
Table columns
note
The number and order of columns in the Limits Inventory table differ from the input CSV file. You can still upload an input CSV file despite differences in columns and order.
| Field Name | Description | Example |
|---|---|---|
| Name | The KPI name created in the business cube. | SA Desk Limit |
| Group | Name of a group of limits. Group is a way of organizing similar limits. | Equity Desk |
| Server | The server where the limit is created. | FRTB |
| Cube | Name of the business cube for the KPI/Limit. | StandardisedApproachCube |
| Measure | The measure of the KPI. | FX Risk Charge |
| Utilization | To help investigate exceptions, for each limit, a link can be made to a dashboard in the Business Cube through a configuration setting. If the association is defined, clicking View Utilizations in this column displays the associated dashboard. For more details, see Utilizations. | |
| Pending Approval | Indicates the number of limits withing the limit structure that require approval. | 0 |
Filters
At the top of the screen you can filter the content of your table by setting the following:

| Field Name | Description | Example |
|---|---|---|
| Server | The server where the limit is created. | FRTB |
| Cube | Name of the business cube for the KPI/Limit. | StandardisedApproachCube |
| Measure | The measure of the KPI. | FX Risk Charge |
| Name | The KPI name created in the business cube. | SA Desk Limit |
| Group | Name of a group of limits. You can use this field to group similar limits. | Equity Desk |
Screen buttons
- Create New Limit Structure: Opens a form where you can enter and select information for your new limit structure.
- Upload: Allows you to add new limits to the table by specifying a CSV file from files on your local machine.
- Download: Exports the table into a CSV file. All limits are exported, regardless of any filters applied.
Utilizations
The Utilizations column lets you investigate the utilization of limits.
To help investigate exceptions, for each limit, a link can be made to a dashboard in the Business Cube. The link from the limit name to the Business Cube dashboard is defined in a configuration file. If the association is defined, clicking View utilizations will display the associated dashboard.
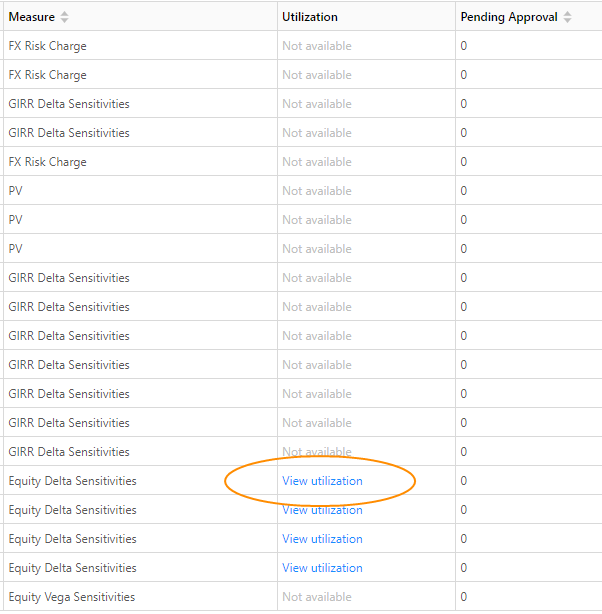
For example, a dashboard builder may create a dashboard called “JTD Limits Utilization” for investigation. You can then configure Atoti Limits to establish a link between this dashboard and “JTD Limits”. As a result, clicking View Utilizations in the relevant row in the Inventory screen would display the “JTD Limits Utilization” dashboard.
For details on this configuration setting, see utilizationDashboards in UI Settings.