Definition of Dimension
An OLAP cube is an array of data understood in terms of its different dimensions. OLAP is an acronym for Online Analytical Processing. It is a computer-based technique for analyzing business data in the search for business intelligence. A cube can be considered as a generalization of a three-dimensional spreadsheet. For example, a company might wish to summarize financial data by product, by time-period, and by city to compare actual and budget expenses. Product, time, city and scenario (actual and budget) would be the data dimensions. Cube is a shortcut for multidimensional dataset, given that data can have an arbitrary number of dimensions. The term hyper-cube is sometimes used, especially for data with more than three dimensions. Each cell of the cube holds a number that represents some measure of the business, such as sales, profits, expenses, budget and forecast. OLAP data is typically stored in a star schema or snowflake schema in a relational data warehouse. In Atoti, the in-memory relational data storage is called the datastore. The data can then be analyzed through the cube: we look at the measures, organized by dimensions. Measures are derived from the numerical elements of the records. Those are aggregated (by sum, average, or other summarizing operations) to get a general overview on the data. Dimensions are the elements of the records that allow to classify the data: they are the criteria by which data is grouped and/or filtered before summarization.Definition of Hierarchy
The elements of a dimension can be organized within hierarchies. A hierarchy is a set of parent-child relationships, where each parent typically summarizes its children. Parent elements can further be aggregated as the children of another parent. For example May 2005’s parent is Second Quarter 2005 which is in turn the child of Year 2005. Similarly, cities are the children of regions; products roll into product groups and individual expense items into types of expenditure.Note that the dimension and hierarchy concepts exposed here are the same as defined by the XMLA and MDX standards, with a dimension being a collection of one or several hierarchies.Consequently, it is possible (in either Excel or Atoti UI) to have hierarchies neatly grouped by parent dimensions, instead of just having a large flat list of analytical axes.
Definition of Level
A level is a specific depth within a hierarchy. If you take the example presented above:then the levels would beMay 2005’s parent isSecond Quarter 2005which is in turn the child ofYear 2005
Year, Quarter, Month.
Definition of Member
A member is a specific value at a given level of a hierarchy. For example,May 2005.
A hierarchy often has a single general member, that can summarize all data: that member is called AllMember.
If a hierarchy has no AllMember (for example, a currency hierarchy where it makes no sense to compute an
all-currencies grand total), then the hierarchy is said to be slicing.
Different Types of Hierarchies
Hierarchies can be differentiated into four types:- symmetrical (or balanced)
- asymmetrical (or unbalanced)
- ragged
- network
Symmetrical Hierarchies: Supported
The symmetrical, or balanced, hierarchy is the most common type. In a balanced hierarchy, the parent of each member comes from immediately above that member. Additionally, the lowest levels on all branches of the hierarchy are the same (hence the balanced/symmetrical name). The diagram below shows a symmetrical hierarchy. It is symmetrical because the termination of every branch is at Level 3.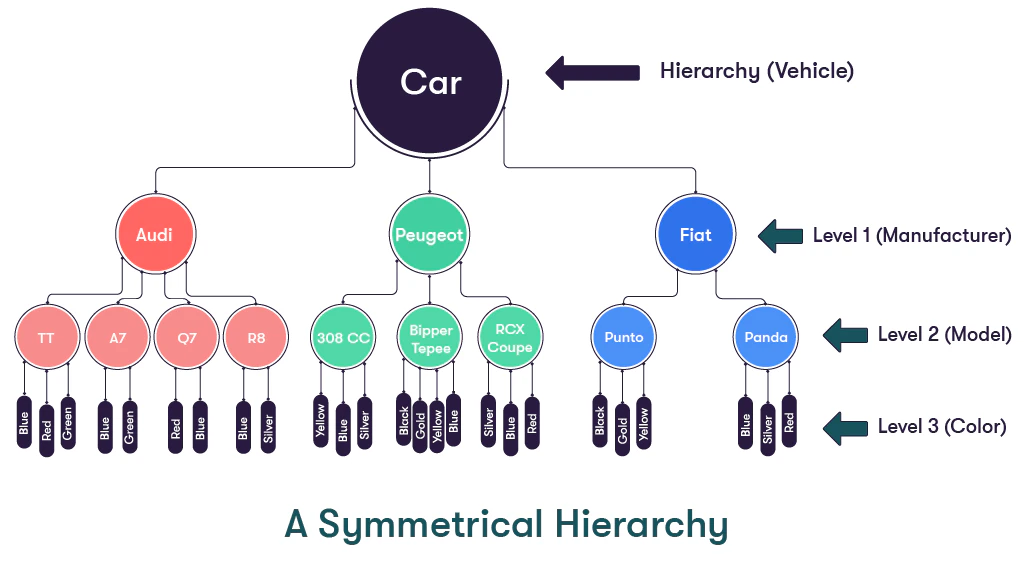
Unbalanced Hierarchies: Supported
In an unbalanced hierarchy, the parent of each member comes from immediately above that member, as is the case for a symmetrical hierarchy. However, with an unbalanced hierarchy, not all the branches contain the same number of levels. For example, while the lowest level for one branch may be Level 2, other branches may have lowest branches of Level 3 or more. Such a hierarchy can also be referred to as an Asymmetrical Hierarchy. The diagram below shows a (very simple) unbalanced hierarchy. It is unbalanced because Mercury and Venus do not possess any moons, so their branches terminate at Level 1, whereas Earth and Mars (who do have moons) have their branches extended to Level 2.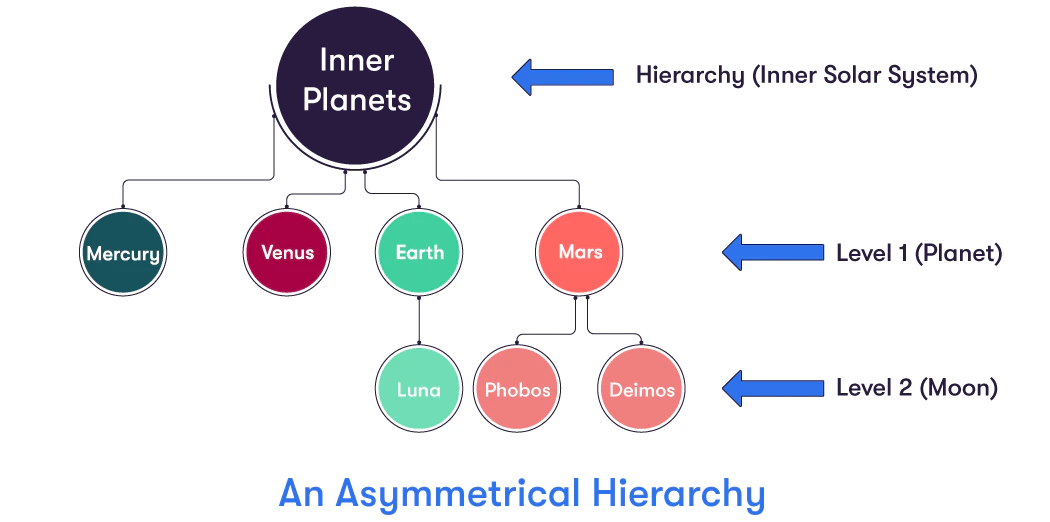
Ragged Hierarchies: Not Supported
In a ragged hierarchy, the parent of a member can come from any level above the level of the member itself, not just from the level immediately above. A good example of such a hierarchy would be the following geographical one, involving the USA and Washington DC. It is ragged because Washington DC has USA as its parent. USA is two levels above Washington DC, and not in the level immediately above, as it has to be for the hierarchy to be symmetrical.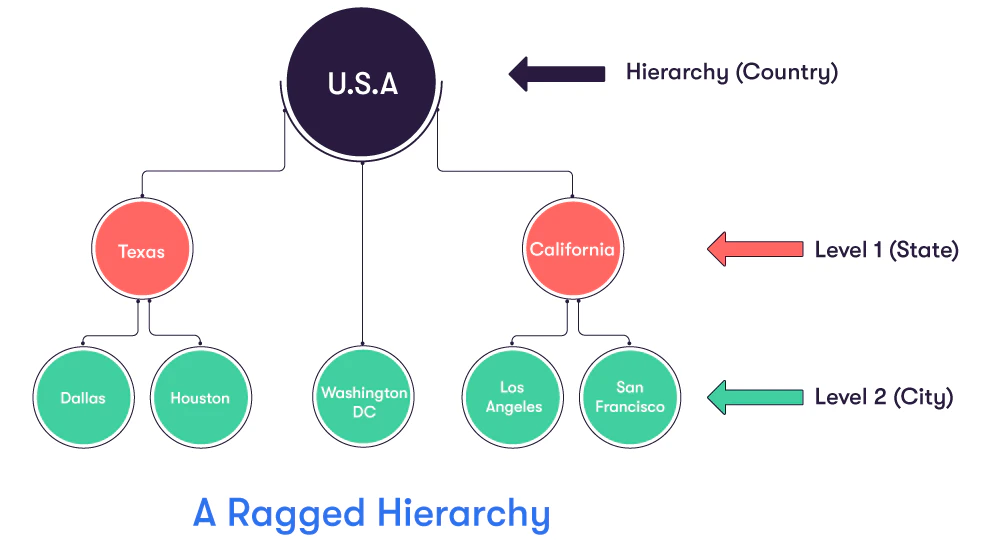
Network Hierarchies: Not Supported
In a network hierarchy, nodes can contain more than one parent. A family tree is a common example of a network hierarchy.Factless Hierarchies
Factless is a flag that can be set inAxisHierarchyDescription to change how the members of the hierarchy are
loaded.
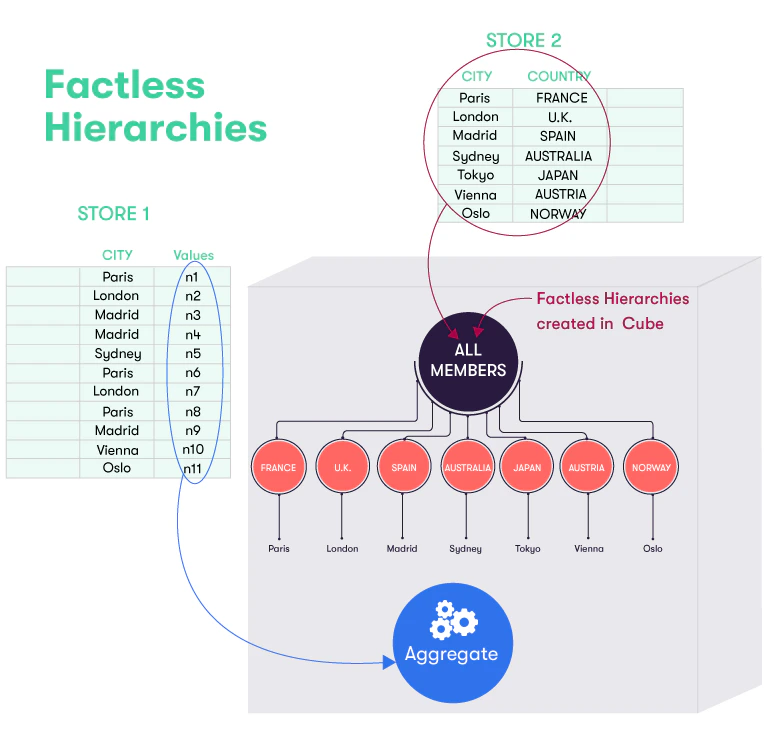
The levels of a factless hierarchy use fields of the selection that can be found in joined tables rather than in
the fact table.
The hierarchy directly discovers its members from this joined table, making its feeding much faster than when it is
fed from the facts.
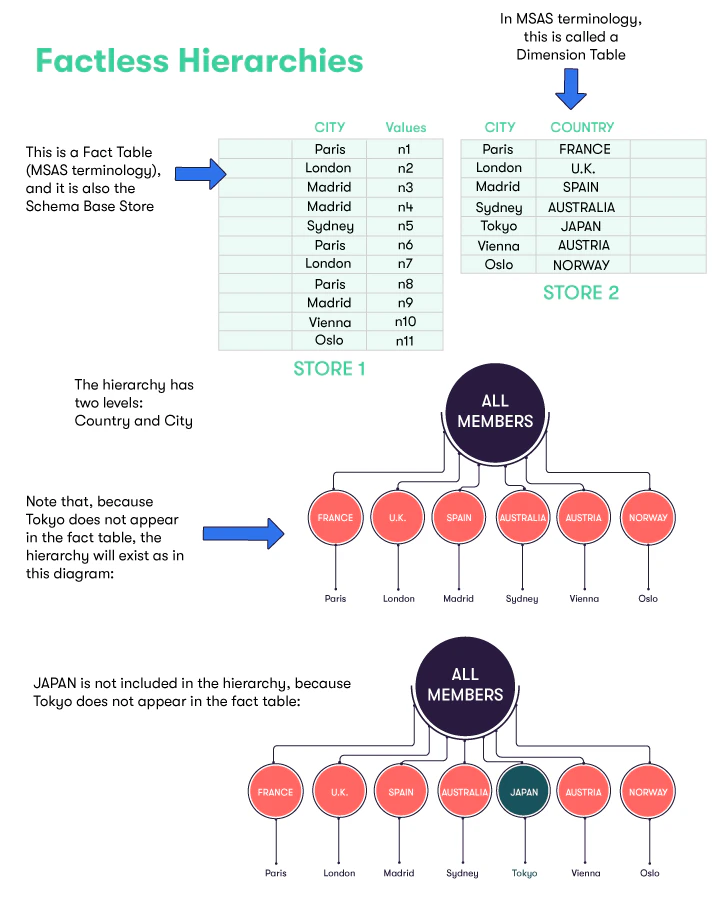
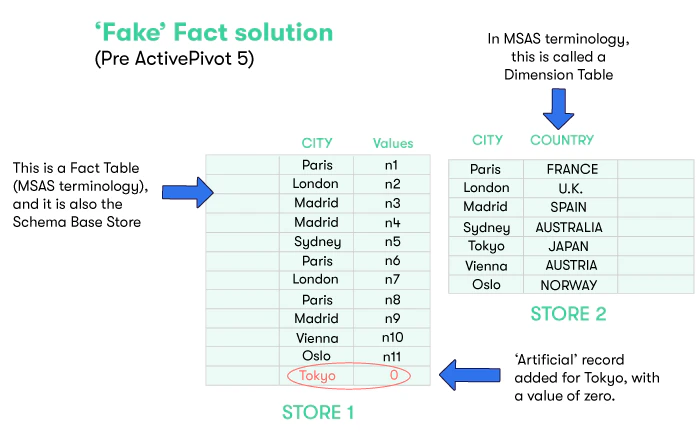
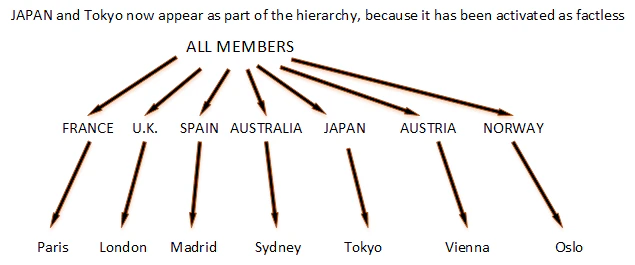
All the values of the table will be found in the hierarchy, including those with no associated fact in the base
table, thus explaining the term “factless”.
By default, all hierarchies that can be factless will automatically set the factless flag.(See
ActivePivotDescription.setAutoFactlessHierarchies).
This feature can be disabled globally, through the definition of the ActivePivotDescription, or for a particular
hierarchy, through AxisHierarchyDescription.setFactless(false). In this case, only the members with associated
facts will be loaded in the hierarchy.
For a more detailed description take a look at the javadoc of IAxisHierarchyDescription.setFactless.
An example is worth a thousand words:
Analysis Hierarchies
Analysis hierarchies allow to define a hierarchy structure (number of levels) and content (members on those levels) programmatically. The naming convention may be confusing for some people. By “Analysis Hierarchy” here we don’t mean any hierarchy available in the cube for “analysis”, but those special hierarchies that are not derived from facts. The concept of “Analysis Hierarchy” is fairly advanced and Atoti offers several ways to simplify its implementation (see Copper Hierarchies). Custom measures are necessary to make use of analysis hierarchies. The analysis hierarchy members can be viewed as parameters for a post-processor evaluation procedure.Virtual hierarchies
A virtual hierarchy has both a smaller memory footprint and faster commit times than a (non-virtual) hierarchy. The main use case is a hierarchy with millions of members in an application where the memory footprint or the server start time is a concern. For example, a tradeId hierarchy. When a (non-virtual) hierarchy is created, it collects all the members from the database and stores them in the cube. This can be a problem when the hierarchy has millions of members (such as the tradeID), as this increases the memory usage and the loading time. A virtual hierarchy is a way to implement a hierarchy without storing its members in the cube. This allows the virtual hierarchy to be as lightweight as possible. It will also accelerate the loading of the hierarchies. It is important to note that the reduced memory usage comes with some limitations. Some operations likeLead or Lag are not supported. For others, the query will be forced to do some database queries
because the result can not be computed solely with pre-aggregated data.
Retrieving all the members of a virtual hierarchy on one of the levels or searching for a specific member, for example,
is an operation that will trigger a database query.
To get the best experience, we strongly advise to use Atoti UI as a visualization tool but most of Excel functionalities
are supported.
To qualify a hierarchy as virtual, simply call the method virtual() of the HierarchyBuilder.
By default Atoti looks for hierarchy levels that have members with a numeric or string type.
Use a custom member-name-to-discriminator parser for other types of levels,
for example dates.
It can be set through the level builder calling the method withMemberNameParserPluginKey(String pluginKey).
- member navigation between hierarchy members, as performed in
LeadandLagmeasures, are not allowed - If MDX expressions describe a member expression the full member path must be provided
- MDX expressions including a virtual hierarchy that do not include the NON EMPTY keyword will trigger a database query.
- A virtual hierarchy cannot be slicing