Subplots Example
Example
Summary of settings
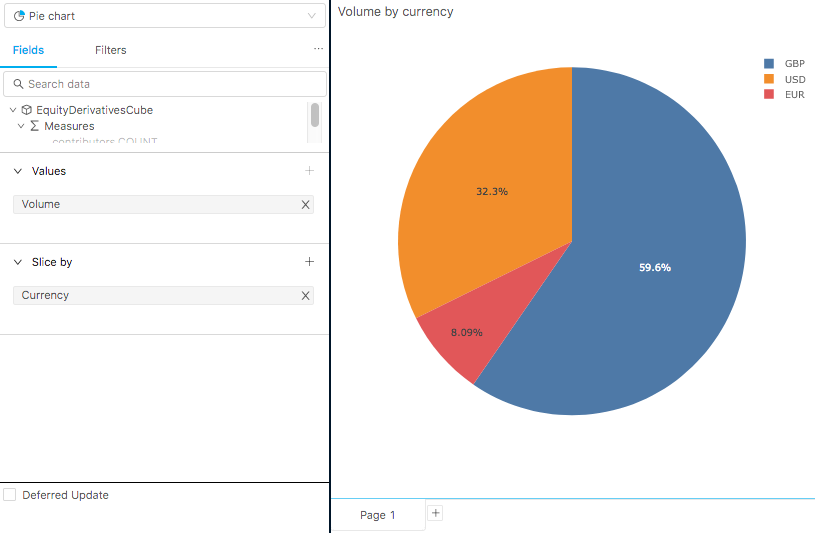
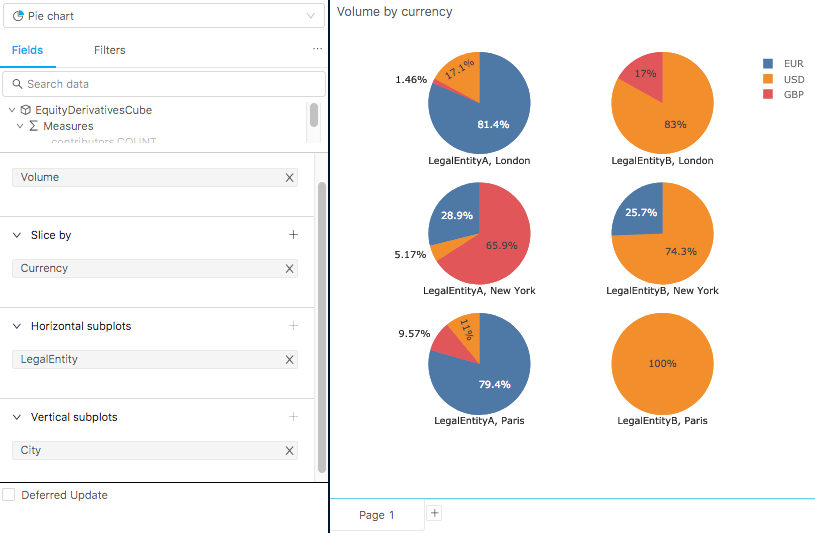
- Type of chart: Pie chart
- Values: Volume
- Slice by: Currency
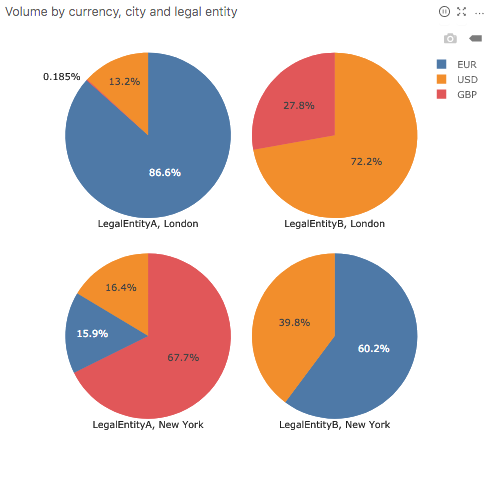
- Horizontal subplots: LegalEntity
- Vertical subplots: City
Step-by-step instruction
Add new Chart Widget
If there are multiple cubes connected to your application, you must select the cube containing the data that you will use in this chart.
Switch type to Pie chart
Add Volume to Values. Note that you can use any measure or formula instead.
Add Currency to Slice by.
At this stage, the volume is displayed by currency:
Show subplot controls in the Content Editor's Fields.
Select Members you would like to use to break down the chart by adding a hierarchy in the Horizontal subplots and/or Vertical subplots sections of the "Fields" Content Editor tab. In this case members of the dimensions LegalEntity and City.
To restrict data in the view, use Filters
Back to Chart Gallery
Appendix
The appendix contains code snippets for advanced users.
MDX:
SELECT
  NON EMPTY [Measures].[Volume] ON COLUMNS,
  NON EMPTY Crossjoin(
    [Currency].[Currency].[Currency].Members,
    [Booking].[Desk].[LegalEntity].Members,
    [Geography].[City].[City].Members
  ) ON ROWS
  FROM  [EquityDerivativesCube]
JSON:
{
  "type": "container",
  "writable": true,
  "name": "Volume by currency",
  "value": {
    "style": {},
    "showTitleBar": true,
    "body": {
      "configuration": {
        "type": "plotly-pie-chart",
        "mapping": {
          "values": ["[Measures].[Volume]"],
          "sliceBy": ["[Currency].[Currency].[Currency]"],
          "horizontalSubplots": ["[Booking].[Desk].[LegalEntity]"],
          "verticalSubplots": ["[Geography].[City].[City]"]
        },
        "subplotModeEnabled": true
      },
      "query": {
        "serverUrl": "",
        "mdx": "SELECT NON EMPTY [Measures].[Volume] ON COLUMNS, NON EMPTY Crossjoin([Currency].[Currency].[Currency].Members, [Booking].[Desk].[LegalEntity].Members, [Geography].[City].[City].Members) ON ROWS FROM [EquityDerivativesCube]",
        "updateMode": "once"
      }
    },
    "containerKey": "chart"
  }
}