Limits as KPIs
Once a limit has been created, it appears as a key performance indicator (KPI) in the cube. It monitors the location(s) it is scoped to and displays its status using one of three icons.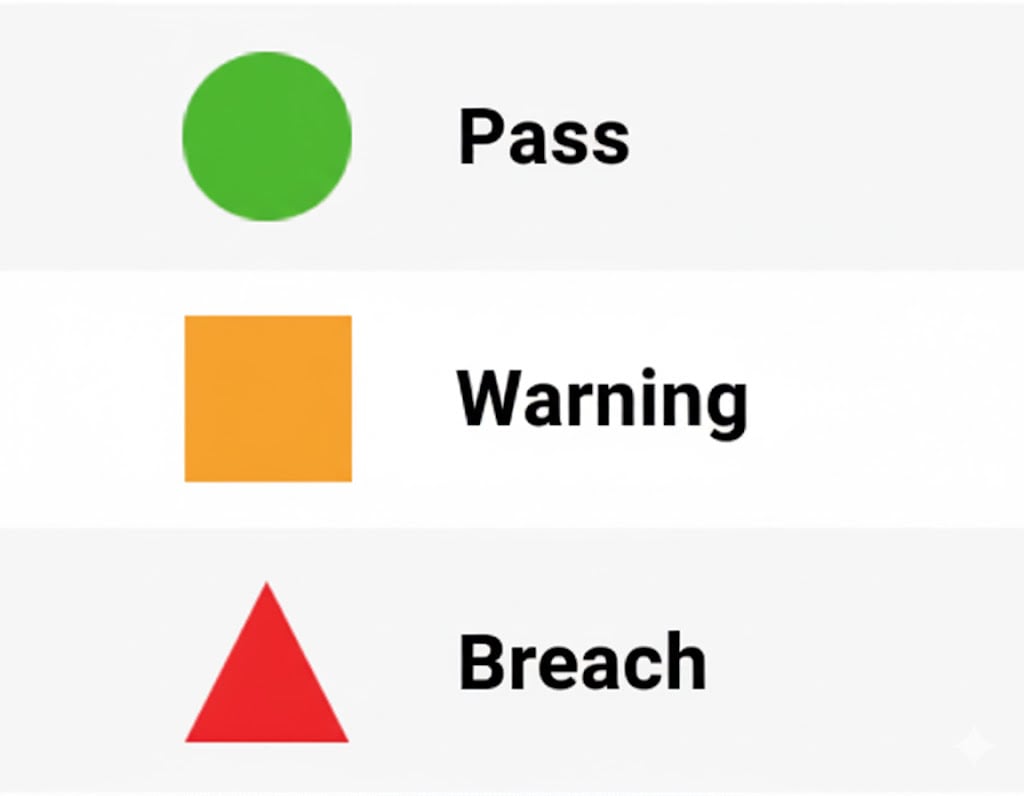
KPI Drawer
KPIs alone may be insufficient to tell users why a limit is in its current status. The KPI Drawer can be used to give more context about the status. Atoti Limits adds a small indicator to all KPI status cells it creates. It is important to note that KPIs not created through Atoti Limits won’t have this functionality. You can find the indicators within the data visualization tabular widgets within your Atoti dashboards. This is the small black triangle located within the KPI status cells, which can be seen in the image below.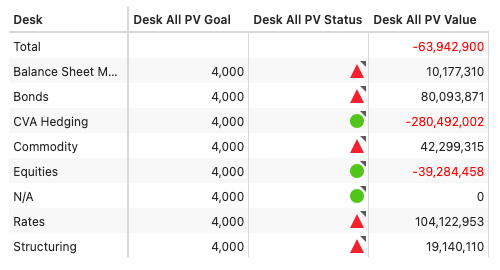
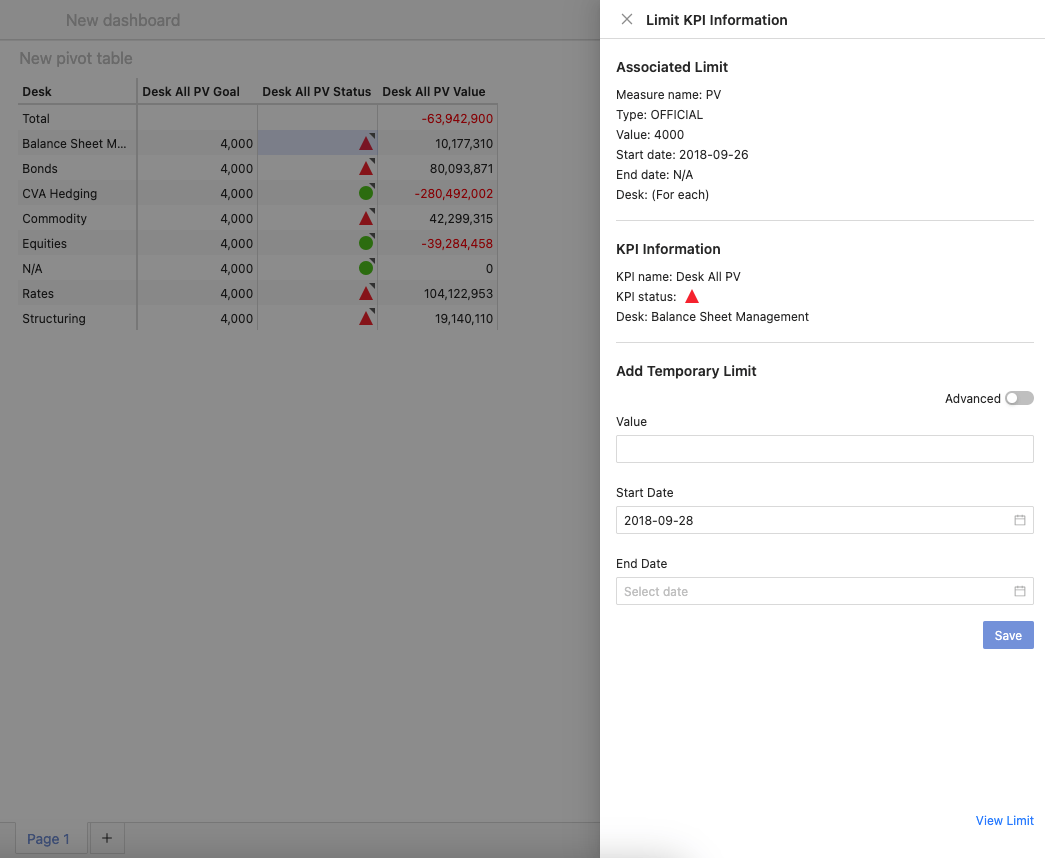
Associated limit
This section displays information about the specific limit used to monitor the KPI you are investigating. It provides details like:- The name of the measure being monitored by the limit
- The type of the limit
- The limit value
- The start and end dates of the limit
- The scope of the limit.