Validating Correctly-Loaded Data with the Data Sanity Check Dashboard
comes with a set of pre-defined bookmarks visualizing the risk metrics. When you launch the application, you can see the list of bookmarks available to you on the left navigation bar. In this tutorial we will talk about the Data Sanity Check summary bookmark: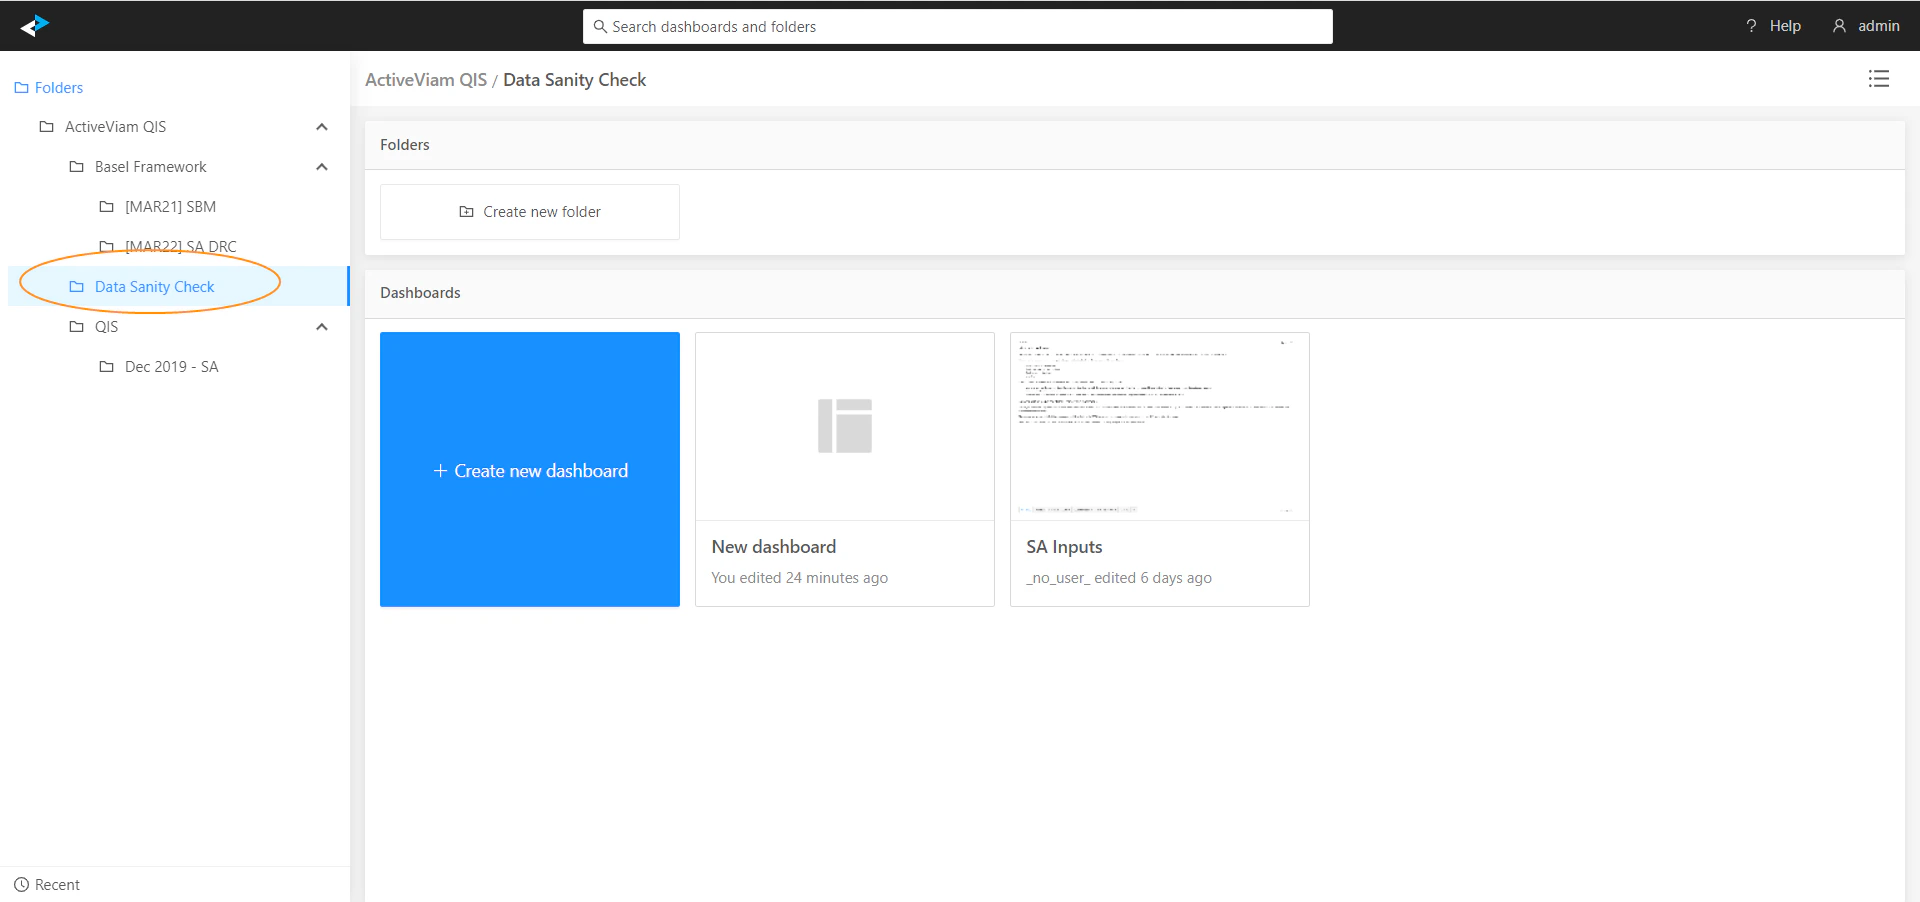
SA Inputs dashboard
In this version of we have pre-configured views for checking the SA Inputs.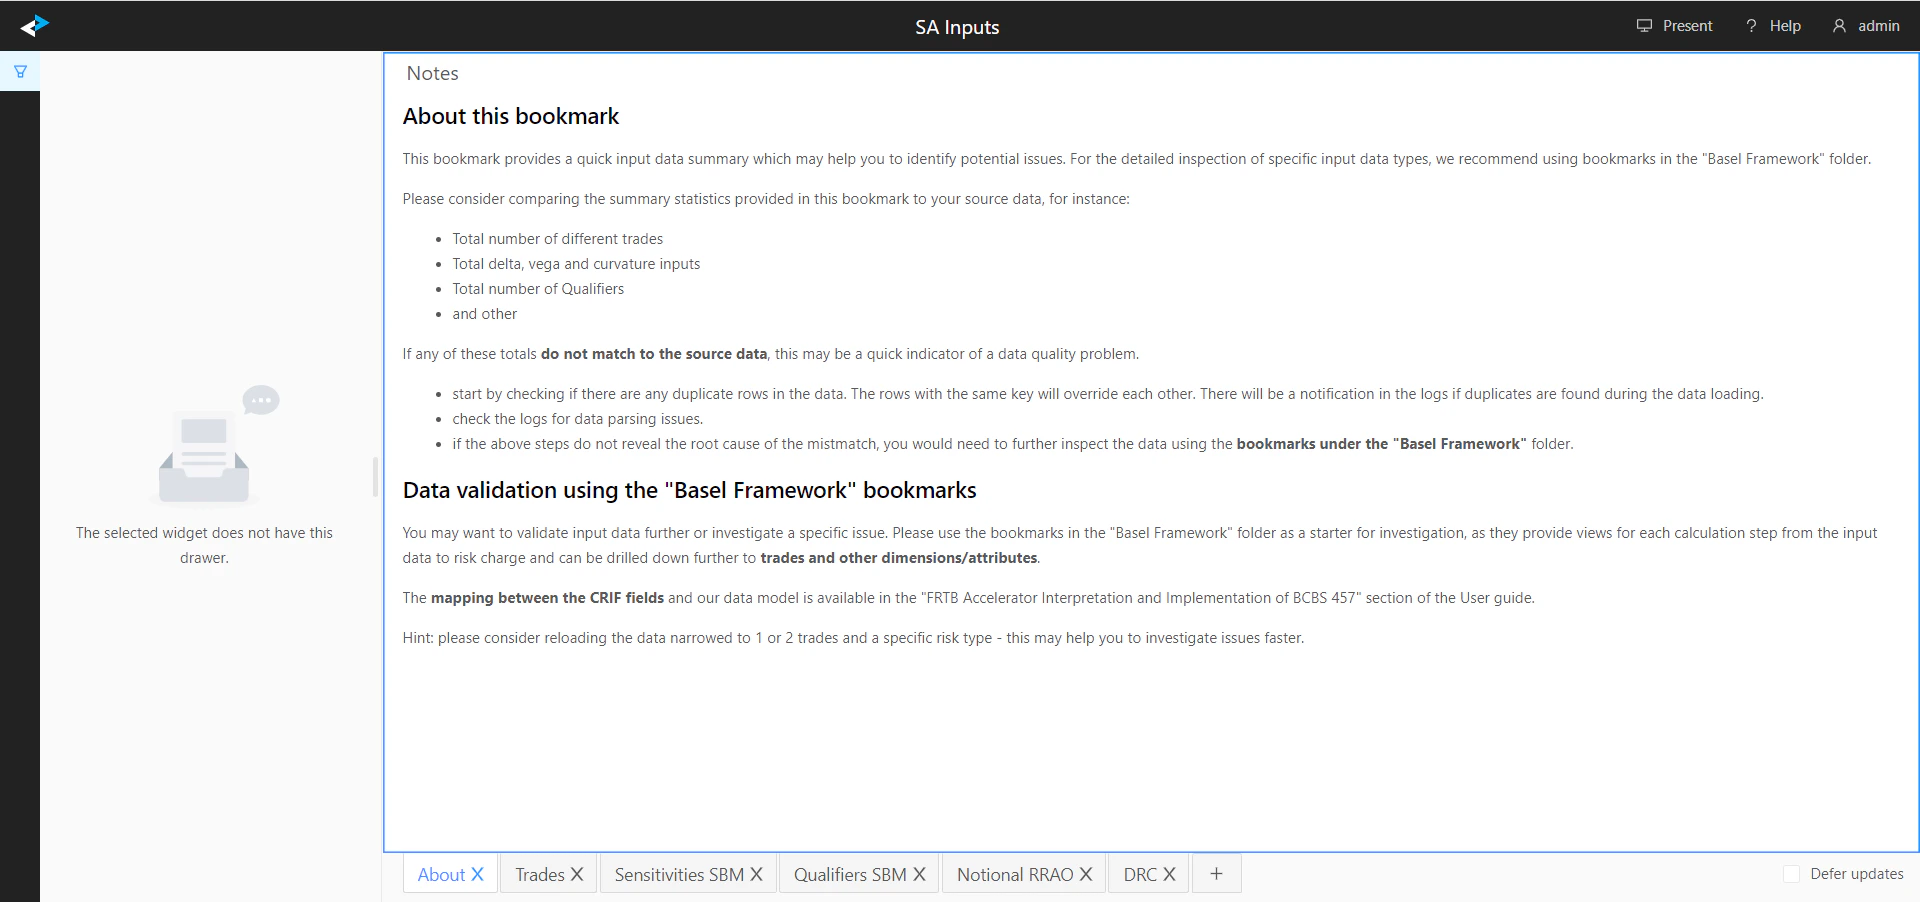
Although this dashboard helps you identify potential issues faster, checking these views does not guarantee that all input fields are populated correctly. The views in this bookmark can help to reveal file parsing errors and provide a quick input data summary.
Further data validation
You may want to validate input data further or investigate a specific issue. For this, use the bookmarks in the “Basel Framework” folder as a starting point. They provide views for each calculation step from the input data through to the risk charge, and you can drill down further to trades and other dimensions or attributes.- Atoti FRTB
- FRTB SA QIS
If you have loaded the data using the Sensitivity files format, you can find the mapping between the CRIF fields and our data model in this section: Interpretation and Implementation of BCBS 457.
See also
- The user interface features in the User Documentation