Dimensions and Hierarchies
Definition of Dimension
An OLAP cube is an array of data understood in terms of its different dimensions. OLAP is an acronym for Online Analytical Processing. It is a computer-based technique for analyzing business data in the search for business intelligence.
A cube can be considered as a generalization of a three-dimensional spreadsheet. For example, a company might wish to summarize financial data by product, by time-period, and by city to compare actual and budget expenses. Product, time, city and scenario (actual and budget) would be the data dimensions. Cube is a shortcut for multidimensional dataset, given that data can have an arbitrary number of dimensions. The term hyper-cube is sometimes used, especially for data with more than three dimensions.
Each cell of the cube holds a number that represents some measure of the business, such as sales, profits, expenses, budget and forecast.
OLAP data is typically stored in a star schema or snowflake schema in a relational data warehouse. In ActivePivot, the relational data storage is called the datastore. The data can then be analysed through the cube: we look at the measures, organised by dimensions. Measures are derived from the numerical elements of the records. Those are aggregated (by sum, average, or other summarizing operations) to get a general overview on the data. Dimensions are the elements of the records that allow to classify the data: they are the criteria by which data is grouped and/or filtered before summarization.
Definition of Hierarchy
The elements of a dimension can be organized within hierarchies. A hierarchy is a set of parent-child relationships, where each parent typically summarizes its children. Parent elements can further be aggregated as the children of another parent.
For example May 2005's parent is Second Quarter 2005 which is in turn the child of Year 2005. Similarly, cities are the children of regions; products roll into product groups and individual expense items into types of expenditure.
Note that the dimension and hierarchy concepts exposed here are the same as defined by the XMLA and MDX standards, with a dimension being a collection of one or several hierarchies.
Consequently, it is possible (in either Excel or ActiveUI) to have hierarchies neatly grouped by parent dimensions, instead of just having a large flat list of analytical axes.
Definition of Level
A level is a specific depth within a hierarchy. If you take the example presented above:
May 2005's parent isSecond Quarter 2005which is in turn the child ofYear 2005
then the levels would be Year, Quarter, Month.
Definition of Member
A member is a specific value at a given level of a hierarchy. For example, May 2005.
A hierarchy often has a single general member, that can summarize all data: that member is called AllMember.
If a hierarchy has no AllMember (for example, a currency hierarchy where it makes no sense to compute an
all-currencies grand total), then the hierarchy is said to be slicing.
Different Types of Hierarchies
Hierarchies can be differentiated into four types:
- symmetrical (or balanced)
- asymmetrical (or unbalanced)
- ragged
- network
Symmetrical Hierarchies: Supported
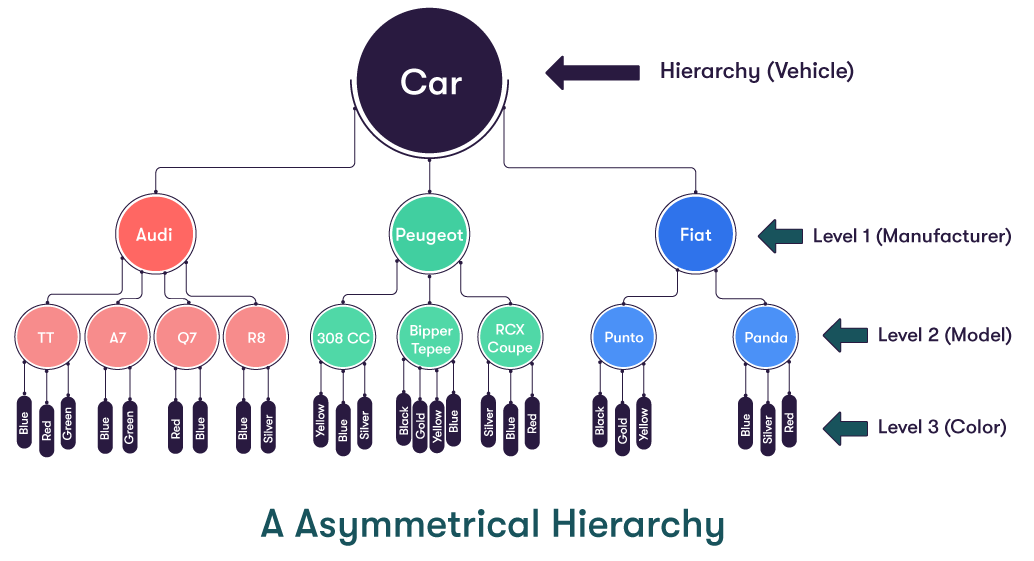
The symmetrical, or balanced, hierarchy is the most common type.
In a balanced hierarchy, the parent of each member comes from immediately above that member. Additionally, the lowest levels on all branches of the hierarchy are the same (hence the balanced/symmetrical name).
The diagram below shows a symmetrical hierarchy. It is symmetrical because the termination of every branch is at Level 3.
Unbalanced Hierarchies: Supported
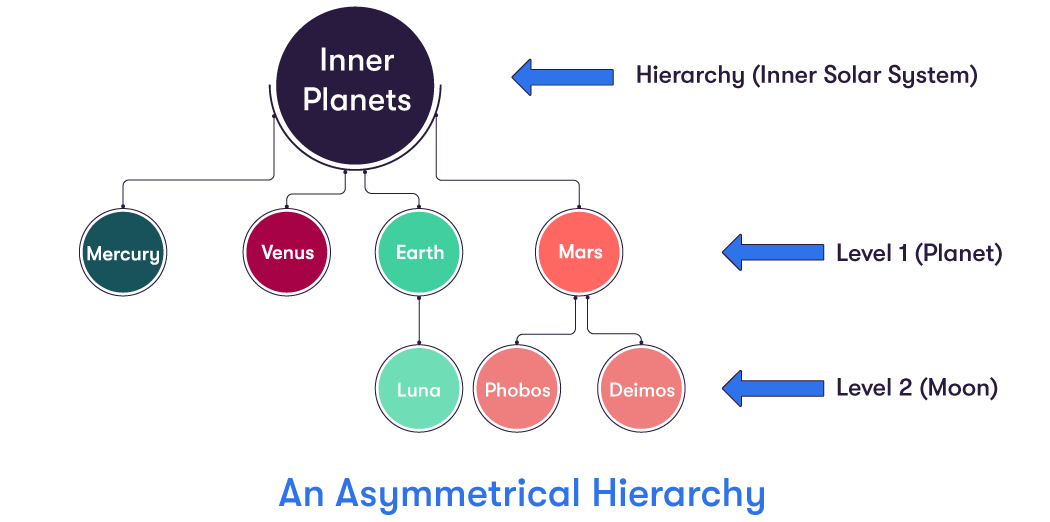
In an unbalanced hierarchy, the parent of each member comes from immediately above that member, as is the case for a symmetrical hierarchy. However, with an unbalanced hierarchy, not all the branches contain the same number of levels. For example, while the lowest level for one branch may be Level 2, other branches may have lowest branches of Level 3 or more. Such a hierarchy can also be referred to as an Asymmetrical Hierarchy.
The diagram below shows a (very simple) unbalanced hierarchy. It is unbalanced because Mercury and Venus do not possess any moons, so their branches terminate at Level 1, whereas Earth and Mars (who do have moons) have their branches extended to Level 2.
Ragged Hierarchies: Not Supported
In a ragged hierarchy, the parent of a member can come from any level above the level of the member itself, not just from the level immediately above.
A good example of such a hierarchy would be the following geographical one, involving the USA and Washington DC. It is ragged because Washington DC has USA as its parent. USA is two levels above Washington DC, and not in the level immediately above, as it has to be for the hierarchy to be symmetrical.
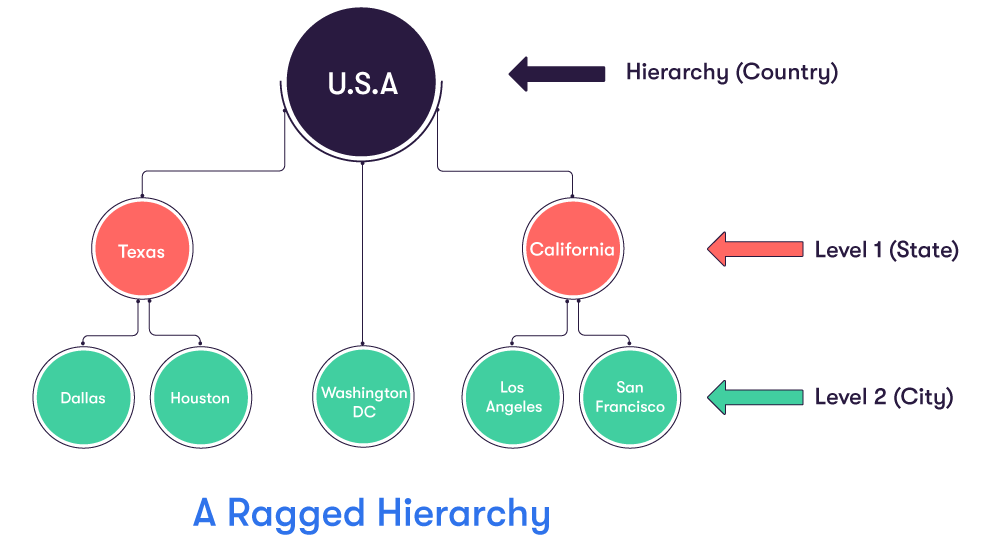
Ragged hierarchies are not supported in ActivePivot. You would add a state node at level 1 in the example to be able to use it as a hierarchy in ActivePivot.
Network Hierarchies: Not Supported
In a network hierarchy, nodes can contain more than one parent. A family tree is a common example of a network hierarchy.
Factless Hierarchies
A factless hierarchy is a hierarchy from which members do not necessarily come from the underlying facts from the base store: the hierarchy rather listens to the store it is based on to discover its members. This means that some of their members can have a contributors count of 0.
For a more detailed description take a look at the javadoc of IAxisHierarchyDescription.setFactless.
An example is worth a thousand words:
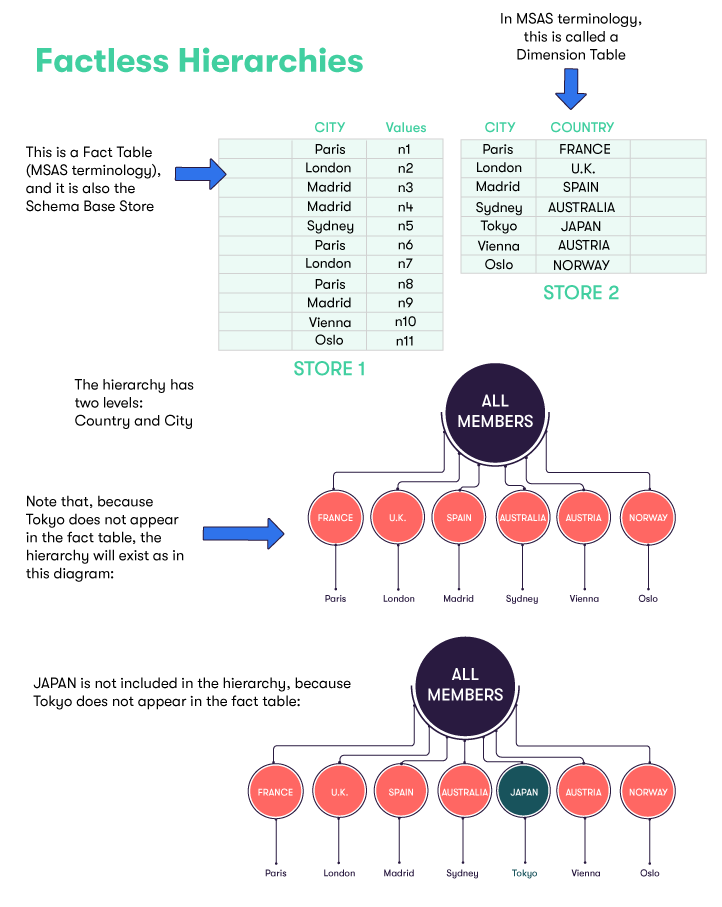
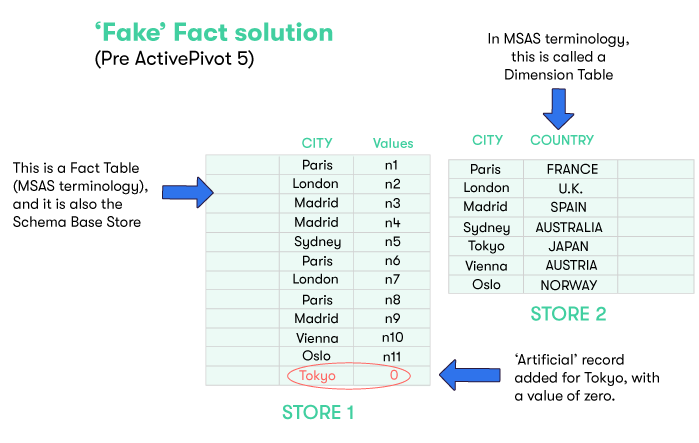
In the diagram above, we have a base store (STORE 1) whose records contain a CITY field. There are six distinct CITY values materialized (through existing records) in that base store : Paris, London, Madrid, Sydney, Vienna and Oslo. In each record, there is another field containing a Measure. The measure for each record is represented in the diagram below by the numbers 'n1', 'n2', etc.
The records in this base store reference those in another store (STORE 2), which we will call the "Country Store", via the CITY field (read more about references). The Country Store contains records that associate each city with the country it is in, which effectively defines the hierarchy for the countries and cities.
In the Country Store, there is a record that associates Tokyo with JAPAN. However, if we considered the countries/cities hierarchy seen through the facts contributed to a cube that depends on this base store, as there are no records in the base store for Tokyo, this JAPAN/Tokyo combination would not show up in the hierarchy.
Now, let's imagine that you would always want to see the full hierarchy as defined in the Country Store when browsing the cube.
Without factless hierarchies, this was dealt with by adding a 'fake' record (fact) in the base store, as shown in the following update of the previous example:
However, the factless hierarchy concept offers a much better way to deal with such a business requirement, whereby you can make sure that the hierarchy seen when browsing the cube is fully defined by the content of a static data referential (such as the one in Country Store in our previous example), as opposed to be defined through what is effectively materialized by the facts contributing to the cube.
In other words, when using factless hierarchies, the data is sent from all relevant stores (not just the base store) to contribute to an ActivePivot cube. The full hierarchies with all relevant members, including those for which there are no facts contributed to the cube yet, are automatically created within the cube.
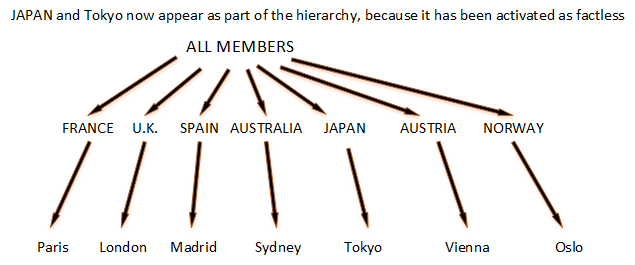
If the hierarchy in our previous example is activated as factless, then the hierarchy seen from the cube will be:
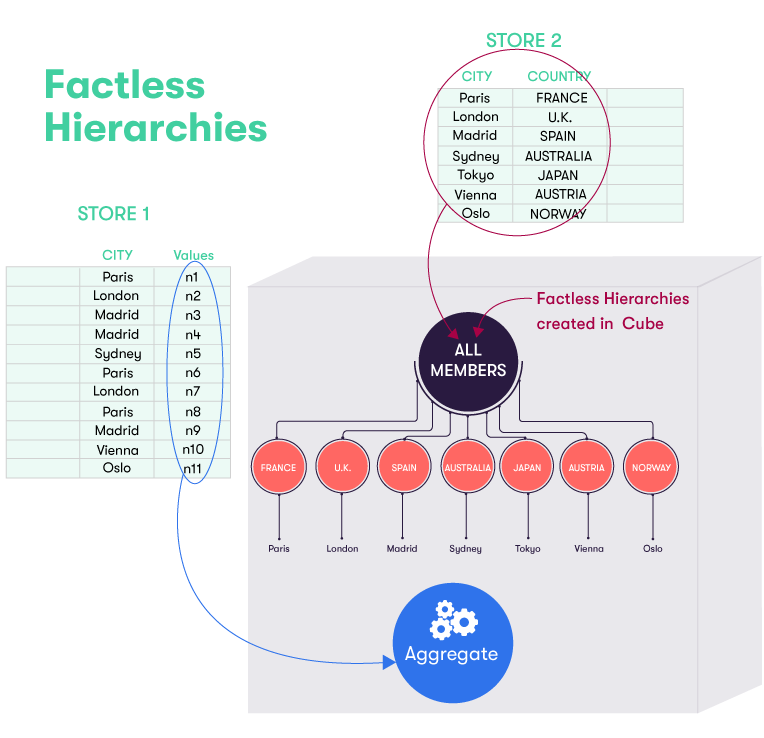
The illustration below shows how the facts from the different records in the base store (STORE 1) are pushed to the cube to be aggregated, while the records in the Country Store (STORE 2) are used to create a hierarchy within the cube. This hierarchy contains all the relevant members from the Country Store, including JAPAN (at Level 1) and Tokyo (at Level 2). This hierarchy is a factless hierarchy, because no records (i.e. facts) exist in the base store for Tokyo.
Factless hierarchies are commonly used in connection with dates, to ensure that a full range, without gaps, is made available, even when there are no facts for a number of the required dates or data ranges.
Factless hierarchies can be activated or deactivated within the cube description (see Cube Configuration).
Analysis Hierarchies
Analysis hierarchies allow to define a hierarchy structure (number of levels) and content (members on those levels) programmatically. The naming convention may be confusing for some people. By "Analysis Hierarchy" here we don't mean any hierarchy available in the cube for "analysis", but those special hierarchies that are not derived from facts.
The concept of "Analysis Hierarchy" is fairly advanced and ActivePivot offers several ways to simplify its implementation (see Copper Hierarchies).
Custom measures are necessary to make use of analysis hierarchies. The analysis hierarchy members can be viewed as parameters for a post-processor evaluation procedure.
Hierarchies in a Distributed Architecture Setup
The levels of the hierarchies from the data cubes are only merged if the hierarchies have the same name and belong to the same dimension.
If the hierarchies from the data cubes do not have the same name but belong to the same dimension, they will be in the same dimension in the query cube.
More details about distributed architecture can be found here.