ActivePivot in a Nutshell
What is ActivePivot?
ActivePivot™ from ActiveViam is a robust and powerful object-based Online Analytical Processing tool that provides real-time analytics capabilities through its transactional engine and multi-threaded processing. ActivePivot is an in-memory aggregation and calculation framework.
It is based on an open, non-intrusive component architecture. This means that you can achieve rapid time-to-market, while at the same time lowering the total cost of ownership of your applications when you embed ActivePivot in your operational processes.
What does it do ?
ActivePivot™ performs four key functions:
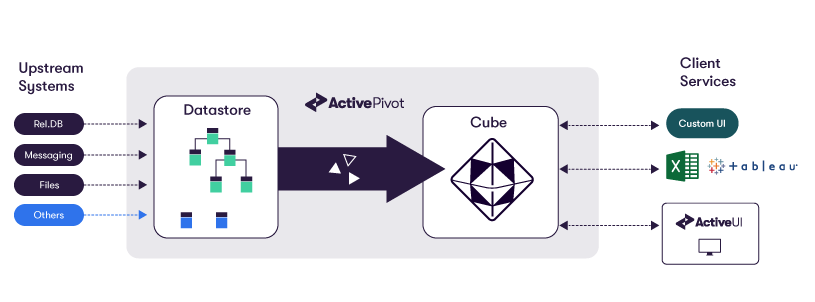
- ActivePivot ingests and consolidates data coming from a variety of heterogeneous systems. It can load data from most sources, including CSV, databases, cloud storage and real-time messaging platforms, such as Kafka and JMS.
- ActivePivot aggregates data incrementally. The data can be updated incrementally and in real time so that only those sections of the cube that are impacted by a data change are refreshed. This represents a significant advantage as compared with traditional OLAP solutions that usually reload all data in the analytical environment and then re-compute all the metrics whenever the source data changes.
- ActivePivot computes complex measures. As an ActivePivot client, you have the ability to plug in your own business logic at every step of the aggregation process and manipulate complex measures. ActivePivot allows you to create new measures (such as VaR and PFE/XVA) to help you understand and monitor your business. Measures are created with PostProcessors that are written in Java, so it is possible to inject any type of logic into the engine, including non-linear calculations. ActivePivot permits queries to run continuously and can generate real-time alerts on Key Performance Indicators (KPIs). This means that real-time analytics involving complex business logic can be deployed with ease.
- ActivePivot performs What-If analysis. In general terms, What-If Analysis is the process of changing the values in cells to see how those changes will affect the outcome of formulas on a worksheet. Conducting a what-if framework is beneficial in several ways. Not only can you make better and more informed decisions by changing assumptions and observing or estimating the results, you are also better able to predict the outcome of your decisions. In the context of ActivePivot, a user wishing to perform a simulation just needs to create a new branch and modify some data : all measures defined on the cube are immediately available on the branch and comparisons can be performed between branches.
Online Analytical Processing is about getting the maximum amount of useful information out of your business data, where this is changing continuously and rapidly. An OLAP solution allows your data to be structured as multi-dimensional ‘cubes’. It is possible to extract information from these cubes using sophisticated summaries and selective drill-down.
The architecture of ActivePivot is inherently open to customization and extension, to meet specific business requirements. ActivePivot offers maximum flexibility in:
- Acquiring data from different sources, and feeding data objects into the cube
- Enriching objects with additional calculated data, prior to aggregation
- Defining a cube, in terms of dimensions, hierarchies, levels and measures
- Aggregating data values within the cube
- Calculating additional measures, using PostProcessors
- Querying the cube information
- Interfacing to client applications
Creating an ActivePivot Application
ActivePivot is Java-based application, built using the Spring Framework. Configuration and development of an ActivePivot application is mainly done through Java code, with some parameters being specified through system or other property files.
In order to build an ActivePivot application, some familiarity with Java, Spring and Maven is required. ActivePivot can be developed in a standard Java IDE and run locally on a laptop, before later being deployed to a large machine where more data will be loaded.
Nearly all ActivePivot applications are run on Linux servers. Our "Getting Started" project, the Sandbox, runs ActivePivot as a Spring Boot application. It is possible to run an ActivePivot application on external versions of Tomcat and Jetty as a war file. We do not recommended deploying ActivePivot to large EE servers such as Websphere or Weblogic.
We will now look at the main components of an ActivePivot application.
The Datastore
The nucleus of an ActivePivot application is the Datastore. The Datastore holds the underlying data on which the OLAP cube is built. The Datastore consists of multiple store definitions, and the references between them. A store can be considered analogous to a relational database table in that:
- It holds records or rows of data
- The records within it share attributes or fields
- References or joins are made to other stores
The Datastore configuration is performed in Java.
The Datastore uses many optimisations such as columnar storage, dictionarization, MVCC, partitioning across NUMA nodes and off-heap storage. ActivePivot is also able to load and store vectors (e.g. arrays of doubles) very efficiently, which is a key differentiator compared with other database technologies.
Loading Data
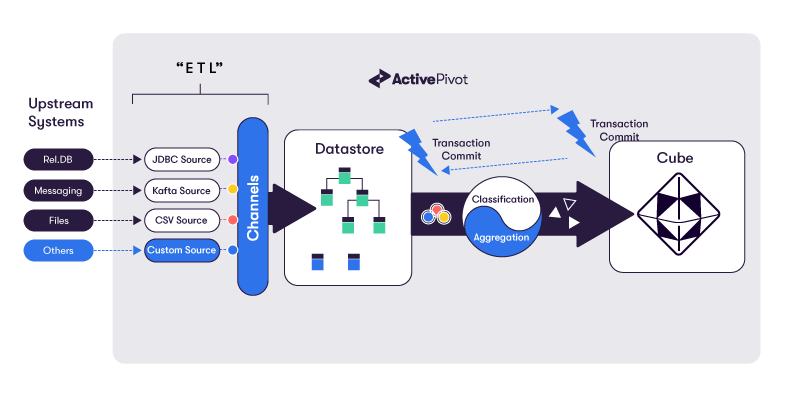
ActvePivot provides a set of configurable components that feed data into the Datastore from various different sources.
Key features include:
- Support for highly concurrent processing of file-based input data
- Concurrent support for multiple data sources out of the box including CSV, JDBC, Cloud storage, Parquet, JMS sources and more
- A pluggable and extendable framework, allowing the seamless integration with the Datastore of bespoke interfaces to new or custom sources
When it comes to loading data, we define a topic and a channel. We also configure the sources that we are loading from, eg CSV or JDBC. The CSV or JDBC source then loads the channel into the Datastore through a transaction. Datastore transactions are ACID compliant. The Datastore also supports MVCC - allowing you to query ActivePivot whilst simultaneously updating data.
ActivePivot can load data from multiple sources. For example, we could read Risk data generated by a Risk engine as csv files, whilst also loading Trade level data stored in a database.
Optionally, we can perform various data processing steps before data is committed into ActivePivot. This includes performing various ETL (Extract, Transform and Load) operations, using Column Calculators or Tuple Publishers in ActivePivot.
Typically, when ActivePivot is started up for the first time it will load all required data "batch style". Data can be added, edited and removed as required. A lot of projects integrate to a real time data feed such as a JMS queue or a Kafka topic for real time updates.
Building a Cube
Once data is loaded into ActivePivot and is in the Datastore, we can expose a multidimensional OLAP cube for querying (see below).
What is a Cube?
An OLAP cube is a method of storing data in a multidimensional form, generally for reporting purposes.
In OLAP cubes, data (measures) are categorized by dimensions.
The following example shows how data arrives in CSV files. The fields can be sourced from trading systems, pricing systems or risk systems.
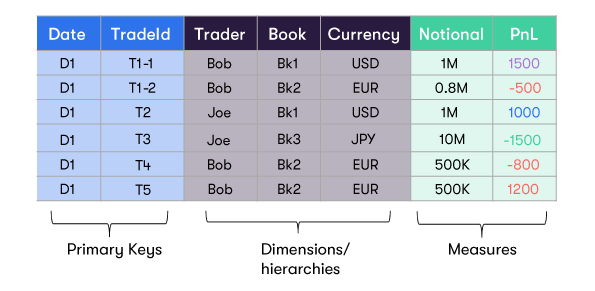
Fields representing the members of a level within a hierarchy in the cube are loaded into the Datastore.
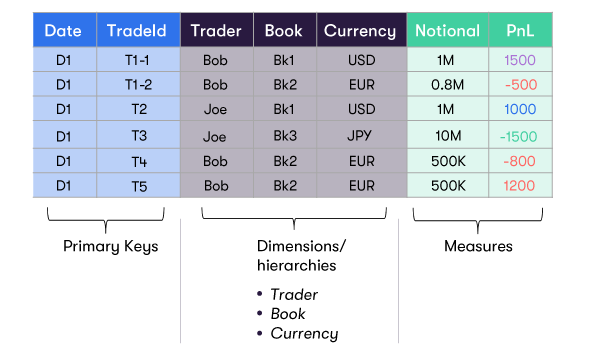
They are exposed as hierarchies within the cube. Measures are treated as an implied hierarchy for this purpose.
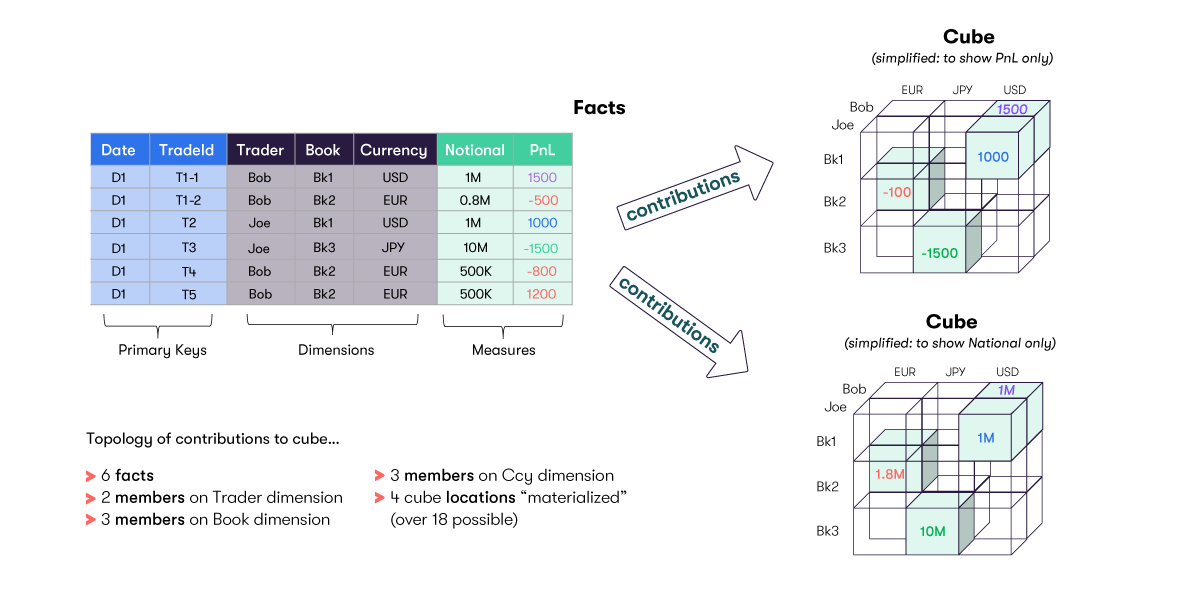
In our example, for simplicity, the resulting cube is shown separately for the 'Notional aggregations and for the 'PnL' aggregations. In reality, all the 'Locations' will exist in the same cube.
For each dimension/hierarchy, there will be a Location (containing the aggregated value) for:
- Each individual member (Bob, Joe, etc)
- The total across all members (AllMember)
You will notice that every Location shown in the cube above, the value shown at that Location is the aggregation of all the values that apply across all the hierarchies involved. So, for example, the value shown at the Location for 'Bob/Bk2/EUR/Notional' is 0.8M + 500K + 500K = 1.8M.
Creating a Cube
The cube is configured in Java. There are practically no limits regarding how many dimensions, hierarchies and levels the cube can contain.
It is possible to provide various optimisations to the cube, such as using an indexed aggregates provider. For example, you can use a BITMAP aggregate provider which will store aggregated values for native measure at load time. When a user runs a query, efficient BITMAP operations take place to return values for any level defined in the BITMAP. Alternatively, the JUST IN TIME aggregate provider retrieves it's aggregates directly from the Datastore as required.
Creating Custom Measures
It is possible to create custom or post-processed measures in ActivePivot. This is a unique and key differentiator of ActivePivot. Post-processed measures are defined once and can be used anywhere on any location.
Consider the calculation of the Value at Risk (VaR) from a Finance use case. The post-processed measure is defined once with one PostProcessor. However, it can be used and queried from any hierarchy - from an AllMember aggregate level, all the the way down to the individual Trade or fact level.
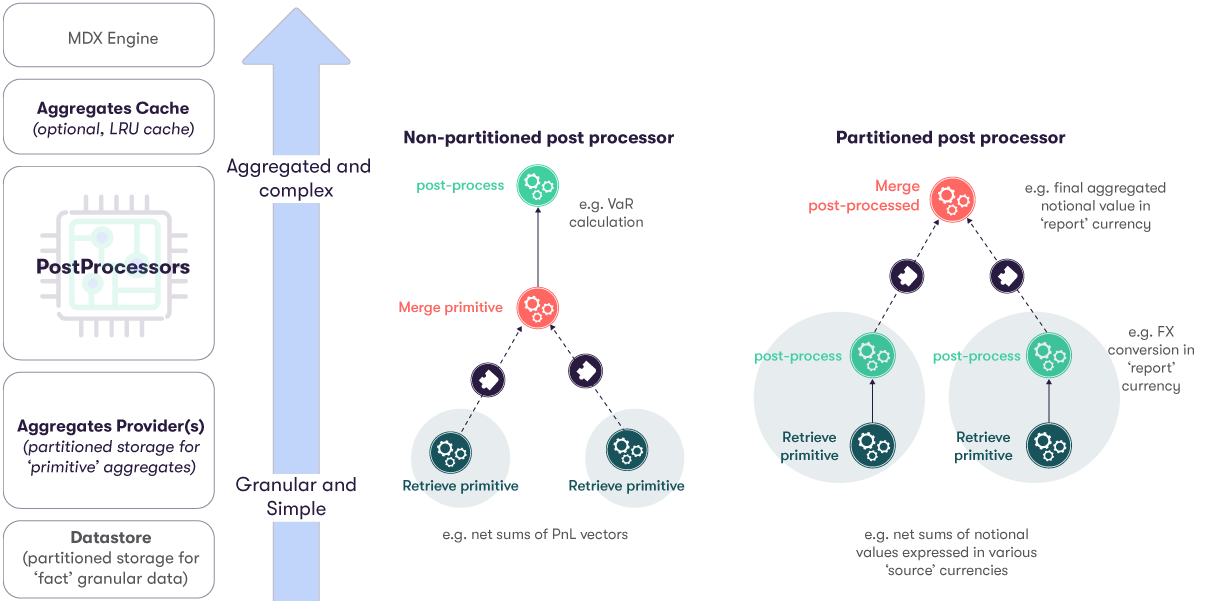
In the above diagram, the left-hand column lays out the various stages of data processing, from the Datastore up to the MDX Engine.
Links to pages describing each of the following topics in detail are as follows:
To the right of this column, two examples are provided of how aggregation work might be parallelized:
- At "primitive aggregation" level.
- At "post-processing" level.
Please note that measures, including Native Measures, can also be created using the Copper API.
Querying the Cube
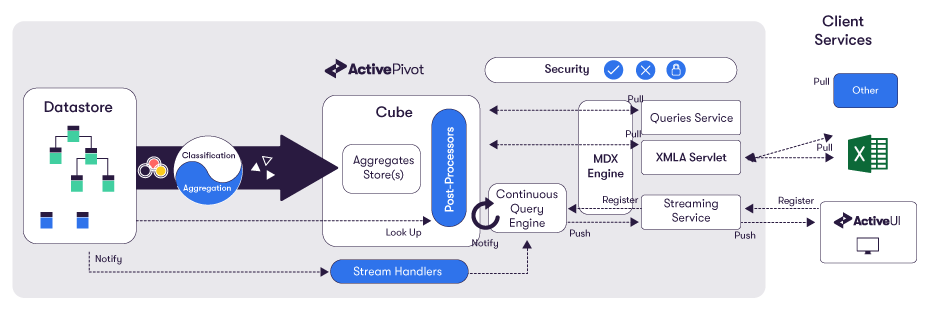
The ActivePivot cube is queried through the industry standard MDX language. Through MDX, users are able to build complex reports to find the information they need. ActivePivot exposes a number of endpoints for querying the cube including REST and Websocket APIs. ActiveViam provides a powerful front end for querying the cube: ActiveUI. ActivePivot also provides an XMLA Servlet allowing external tools to connect and query the cube (see the compatible front-ends).
Here is a diagram showing all the elements of ActivePivot (from the Datastore onwards), including the above-mentioned endpoints:
ActiveUI
ActivePivot's ActiveUI SDK is a development library that works natively with the ActivePivot in-memory aggregation engine. It is the only user interface leveraging all the unique features of ActivePivot and ActiveMonitor:
- Fast and scalable in-memory computation
- Real-time and on-demand calculations
- What-if analysis
- Root cause analysis that goes back in time
- Alert monitoring
- MDX based querying
A sample UI application called "Desktop application" is supplied with the library to serve as an example and starter kit for your product development team. Business users may utilize it straight away to explore and interact with data in an ActivePivot cube and experience visualization tools.
The "Desktop application" is provided with our ActivePivot Sandbox project, so that you can start right away.