Inventory
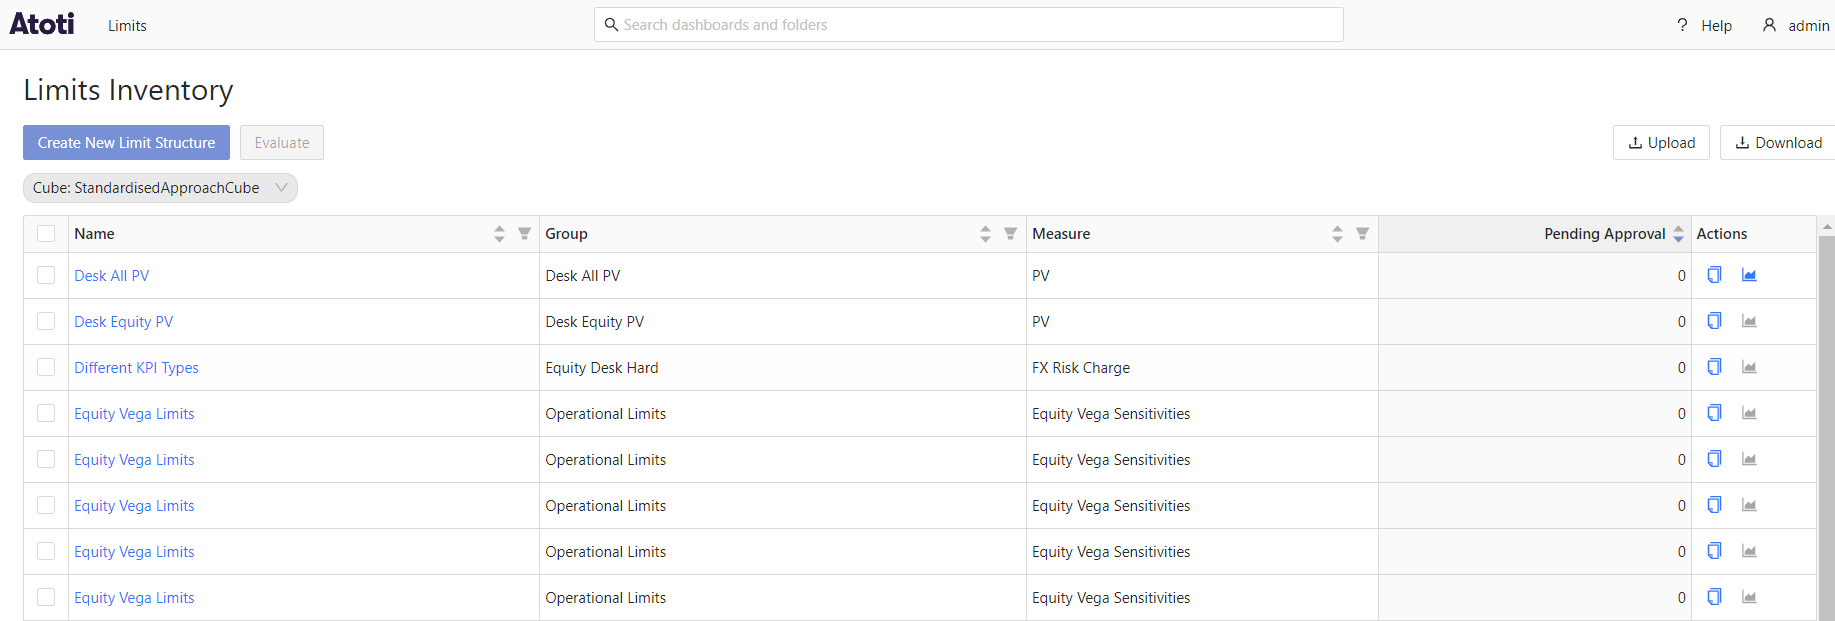
The Inventory screen is where you can view and edit your existing limits, and create new ones.
The screen contains a table with a list of your limits.
Table columns
note
The number and order of columns in the Limits Inventory table differ from the input CSV file. You can still upload an input CSV file despite differences in columns and order.
| Field Name | Description | Example |
|---|---|---|
| Name | The KPI name created in the business cube. | SA Desk Limit |
| Group | Name of a group of limits. You can use this field to group similar limits. | Equity Desk |
| Measure | The measure of the KPI. | FX Risk Charge |
| Pending Approval | Indicates the number of limits within the limit structure that require approval. | 0 |
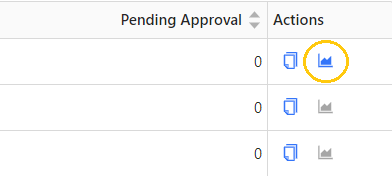
| Action | The actions you can carry out on the entry: - Copy: Duplicate an existing limit structure to speed up creation. - View linked dashboard: To help investigate exceptions, for each limit structure, a link can be made to a dashboard in the Business Cube. If the association is defined, clicking “View linked dashboard” in this column displays the associated dashboard. For more details, see Linked dashboards. |
Filters
In the column headers you can filter the table values. If you have multiple servers or cubes you can also filter by them using the tags above the table:

Screen buttons
- Create New Limit Structure: Opens a form where you can enter and select information for your new limit structure.
- Evaluate: Evaluates the selected limit structure.
- Upload: Allows you to add new limits to the table by specifying a CSV file from files on your local machine.
- Download: Exports the table into a CSV file. All limits are exported, regardless of any filters applied.
Linked dashboards
The “View linked dashboard” action lets you investigate the utilization of limits.
To help investigate exceptions, for each limit, a link can be made to a dashboard in the Business Cube. The link from the limit structure to the Business Cube dashboard can be made when creating the limit structure, or added to an existing limit structure. If the association is defined, clicking the “View linked dashboard” icon will display the associated dashboard.
For example, a dashboard builder may create a dashboard called “JTD Limits Utilization” for investigation. You can then select “JTD Limits” when creating the limit structure. As a result, clicking the “View linked dashboard” icon in the relevant row in the Inventory screen would display the “JTD Limits Utilization” dashboard.
This video guides you through setting up a dashboard and linking it to a limit structure: