Advanced MDX Queries
With the MDX engine, business users can perform more complex queries without necessarily having to ask their IT team to write post-processors. This section features some useful examples of using MDX to run non-trivial analysis in Atoti.Books that Represent 80% of VAR
The TopCount function returns the specified number of elements with the highest values. But in some cases you may want to retrieve the members with the highest values that contribute to x% of the grand total. There is an MDX function for this: TopPercent The following query retrieves the cities with the highest contributors.COUNT that contribute to 80% of the contributors.COUNT of all the cities.Calculated Measure Based on Member Value
This MDX query displays the value ofcontributors.COUNT in the newMeasure column if the BookId is 0 or 1,
otherwise pnl.SUM is displayed.
Daily Turnover Change
With MDX functions like PrevMember and NextMember you can write formulas that compare the measure values between two days, weeks, months, or years. For instance:- [Measures].[Turnover.SUM] has the same value as ([Measures].[Turnover.SUM], [Time].CurrentMember) which is the turnover for the current member on the time dimension.
- ([Measures].[Turnover.SUM], [Time].CurrentMember.PrevMember) is the turnover for the member that precedes the current member on the time dimension.
- The final expression returns the relative growth between the two members:
- For the daily turnover change, put [Time].[Day].Members on one of the axes.
- For the monthly turnover change, put [Time].[Month].Members on one of the axes.

IIf is used to handle the value of the formula for the first day. [Time].CurrentMember.PrevMember does not exist for the first day, it is null.
Date Ranges
Dates All dates:Day to Day Differences
This section explains how to use MDX calculated members to compute differences between adjacent members. A typical example is the evolution of delta or pl from one business date to the next. You can deploy the example here on the sandbox project by cutting and pasting the following MDX into the Atoti UI query editor. The following table shows an MDX calculated member called DIFF, evaluated as the difference in delta.SUM from one member in the dates dimension to the next.The key MDX part to focus on is the definition of a calculated member (see the WITH MEMBER clause) called DIFF.It is computed as the difference between the current value and the previous value. As the image shows, it is generic in that it works not only for T against T-1, but also across all pairs of members on the date dimension. Another useful MDX feature is the FORMAT clause in the query.
Using relative date functions
Using thePrevMember and NextMember functions makes your query dependent on the level comparator used for the AsOfDate
level. Plus, you may not have members for every day in a given period. For instance, only working days may be present, so you won’t be able to compare delta.SUM on Monday because there is no data for the previous day.
To avoid these constraints, you can use specific MDX date functions.
Use case
You can create a measure in MDX that computes the difference ofdelta.SUM between today and yesterday, using the relative date functions DateDiff, DateAdd, and Now, which were implemented in version 4.4.6.
Query
Explanation
First, create a Named Set composed of the two dates: today and yesterday. This is done by taking the members of the hierarchy for which the difference of days from Now (that is to say, the current time) is equal to 0 or 1. Then it is sorted in descending order and we create a calculated member for the difference ofdelta.SUM between these two dates.
Result
| Measures | ||||||
|---|---|---|---|---|---|---|
| Desk | BookId | Diff btw Today - Yesterday | current delta.SUM | delta.SUM today - 1 | ||
| DeskA | 0 | 6 289,98 | -47 029,90 | -53 319,86 | ||
| 1 | -3 163,21 | -27 243,67 | -24 080,46 | |||
| 2 | -14 404,42 | -37 249,83 | -22 845,41 | |||
| 3 | 7 060,66 | 33 474,49 | 26 413,83 | |||
| 4 | 11 942, 06 | -61 702,55 | -73 644,61 | |||
| 5 | -1 013,81 | 43 947,61 | 44 961,42 | |||
| 6 | 4 206,75 | -55 789,63 | -59 996,38 | |||
| 7 | -4 151,88 | 2 800,65 | 6 952,53 | |||
| 8 | 7 953,25 | -38 842,98 | -46 796,23 | |||
| 9 | -12 674,60 | -21 805, 47 | -9 130,87 | |||
delta.SUM value to the one from seven days ago.
Furthermore, if it is Monday, you may want to compare the value to the previous one, which is the preceding Friday. To do
that, you have to change a condition in the filter method:
Distinct Count
The contributors.COUNT native measure counts the number of facts that contribute to a cell. Often we are interested in counting at a higher level, for example:- Number of (distinct) traders that have booked trades
- Number of (distinct) passengers that have been transported in a set of flights
- List all the members to count, in the context of the currently evaluated cell. Use the DESCENDANTS function and the CurrentMember function to set the context.
- Count the members with the COUNT function, making sure you only count the non-empty ones (for which the current measure, or contributors.COUNT by default, returns something).
You can also perform DISTINCT COUNT with a post-processor: the leaf count post-processor provides better performance, but the MDX approach is dynamic and available for all hierarchies. The post-processor must be configured and deployed with the cube.
Exclude an intersection of two hierarchies
- Use the Except and CrossJoin functions.
- Use Crossjoin in the first argument of the Except function to return all possible Tuples and then give the intersection (Tuple) that you want to exclude in the second argument.
- The result is a set that can then be used on a pivot axis.
Filter Dimension Members Based on Their Names
When you manipulate high cardinality dimensions, you may often want to focus only on particular subsets of members. The selection of those members might be tricky at times, based on particular naming conventions. MDX allows you to create fine-grained selections by using the Filter function in association with the Caption function. We can illustrate this use case against the sandbox by drilling down the PnL measure with respect to Underlyings.Non-Filtered Members
Filtering Members that Start With…
If you only want to see currencies starting with letters C to H, you have to perform your query on a filtered cube, not the entire cube. So the query FROM section needs to be updated as in the following:The criteria in the filter section can be more complex to suit specific needs. For instance, you can input more characters to refine your selection. For example, instead of currency starting from C, you can select currency starting from CI.
Filtering Members that End With…
If you only want to see currencies ending with the letter R or beyond, you can update the criteria using the Right function.To add more letters, you need to increase the index of the Right function.
MDX keywords member_caption or Caption are interchangeable.
Filter for a Holiday Calendar - Excluding Members from a Hierarchy
Filters can be saved as bookmarks. A characteristic use case for this is a holiday calendar to exclude dates from a view of VaR and Business Day, where VaR is calculated MON-FRI regardless, but should not be shown for public holidays. The following set can be saved as a bookmark and applied to any query.Filtering on Measure Values
We can filter members based on a set of conditions on measure values with the IIf function and operators such asAND, OR, >, <.
For filtering based on a single condition, you can simply use the Filter MDX function: see http://msdn.microsoft.com/en-us/library/ms146037.aspxFor instance:
Filtering on Measure Values in MDX to include/exclude data from a view
To filter a data set on an existing bookmark to only display what you want to filter for, you can inject the MDX query with a FILTER without needing to create new member measures. The following MDX snippet from a bookmark only showing Cities and their contributor counts illustrates its use.
Possible use cases:
- Where a measure such as P&L is below a certain value, and this bookmark may be saved to explicitly display the biggest loss-making desks/books.
- In conjunction with a measure-quality measure where you are only interested in those bookings where the data quality is less than 100%.
Measure as Mathematical Formula
Measures can be added with a mathematical formula built with operators and operands (scalars or other measures). For instance:Recurrence Relations
For advanced time series analysis and visualization use cases, you can use recursive MDX functions. First let’s consider a time dimension where each member represents a unit of time, with a cumulative measure along the dimension, together with a measure summed at each unit of time. The cumulative measure could easily be the accumulated cash value of inventory (cash, pledgeable assets, SKUs, oxen, and so on) and the summed measure could easily be the amount paid for acquisition of inventory at each point in time. This would give an interesting summary of inventory at any point in time.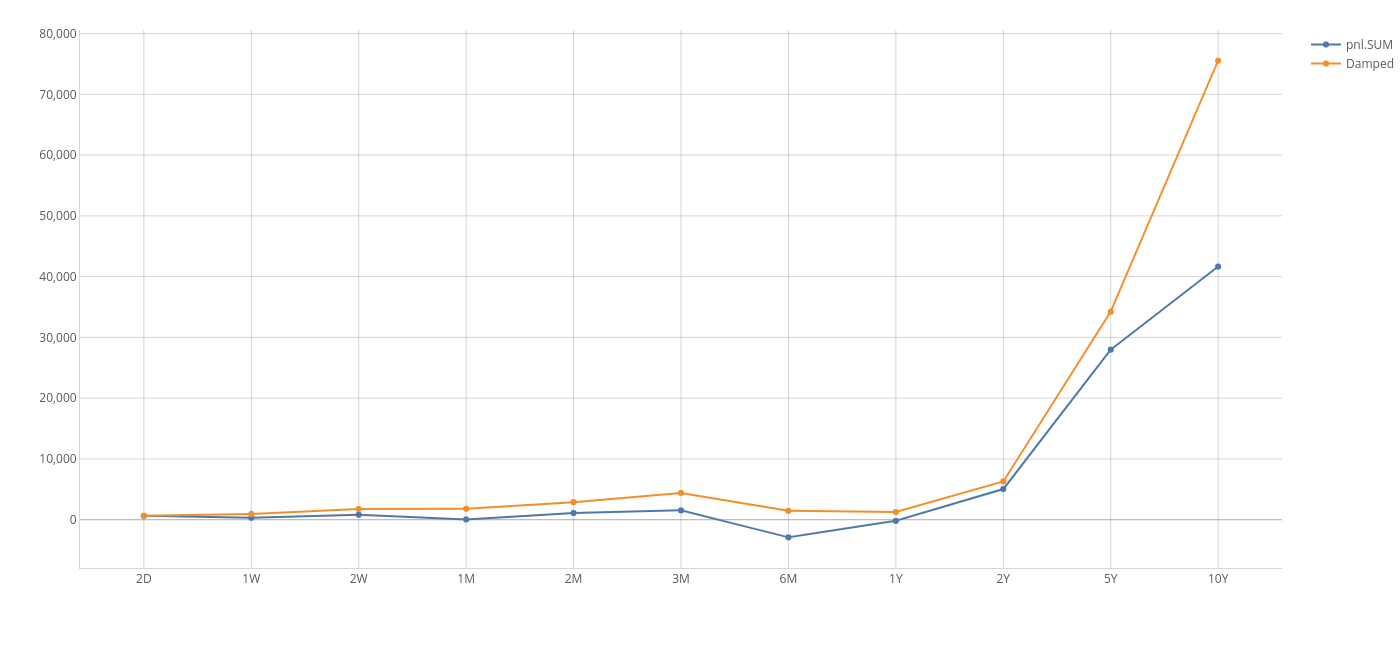
pnl.SUM represents the cumulative measure:
- “What happens to my bottom line if the per-unit cost of storing an unsold tablet rises from 1% per time unit to 5%?”
- “What is the opportunity cost imposed by my excess liquidity buffer if interest rates rise by 1%?
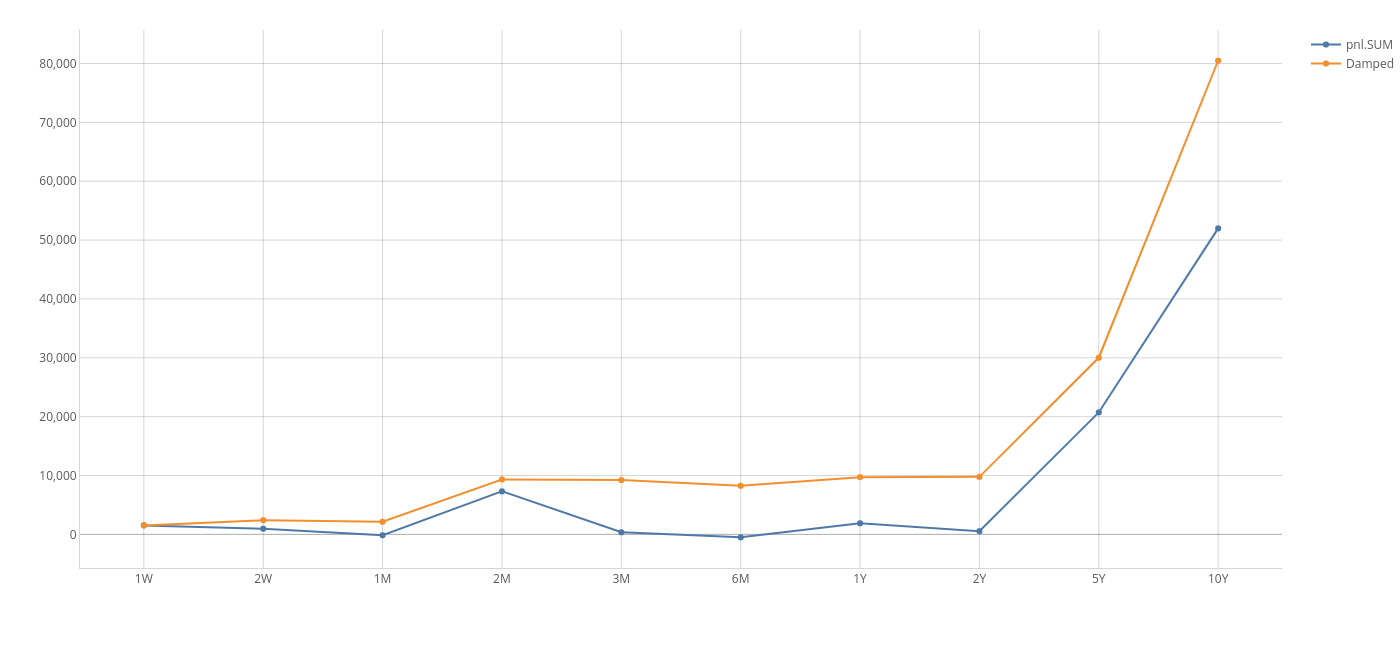
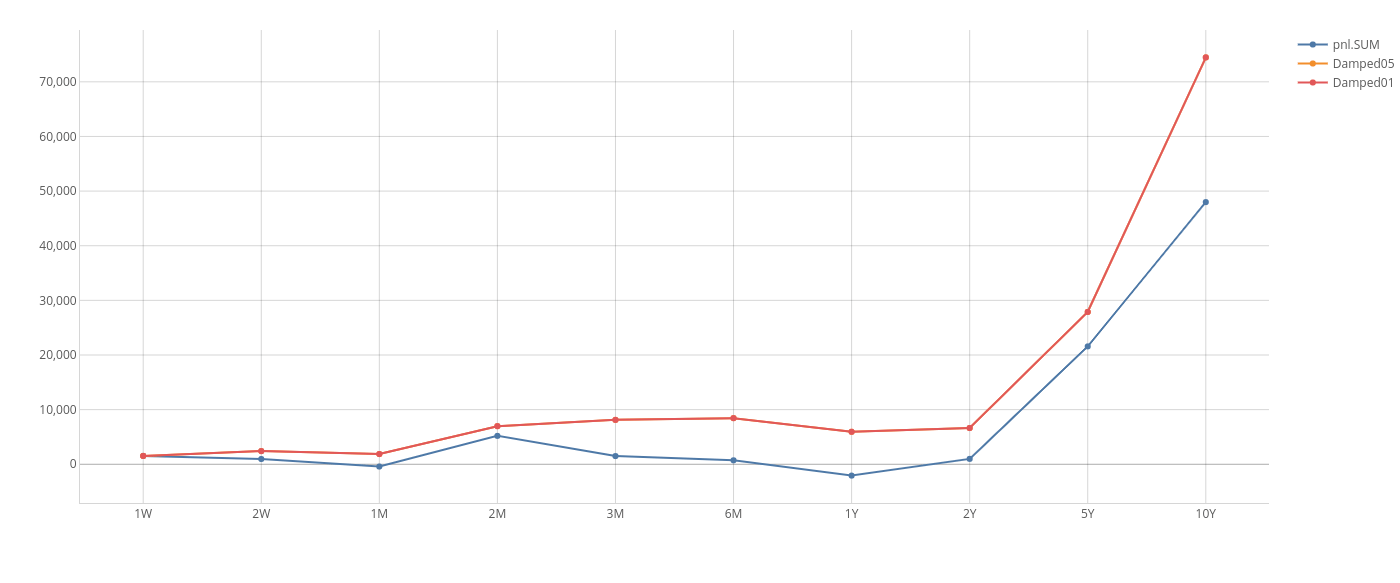
When using recursion you need to be careful to ensure that your relation terminates and has low computational complexity - otherwise you will invariably produce a stack overflow!
Only Show VaR for Trades not Present the Previous Day
This example works for trade-level VaR. To calculate the VaR for all trades not present the previous day, the measure would need to be the sum of the VaR Vector, which could then be fed into a post-processor to calculate the percentile.
Top 3 Underlyings per Country
You may know the TopCount function, which is helpful when you want to only keep the members with the highest values. Now, imagine that in your cube you have the dimensions CounterParty and Geography and you want to retrieve for each city the three CounterParty with the highest PnL. You cannot do this solely with TopCount, you also have to use Generate. This functions acts like a For loop. Here is the MDX that will do what we want:
Here is how we can add the total per region: