Atoti Intelligence Essentials
This is part of the Atoti Intelligence Essentials offer.What is Visualize This
Visualize This provides two core capabilities:- AI assistant: an integrated AI assistant in the Atoti UI that generates visualizations on request
- Atoti-specific tools: a set of tools designed to work with Atoti’s data structures and features
Why use Visualize This
Visualize This is powered by a large language model with access to Atoti-specific tools. This combination makes it useful in three ways:- Data visualization: Create charts, dashboards, and multi-widget pages from natural language requests, without manually configuring widgets. The assistant selects appropriate visualization types and maps your data to them.
- Cube knowledge: Ask questions about your cube structure — available measures, hierarchies, dimensions — and get answers drawn from the Atoti context provided to the assistant.
- General-purpose assistance: Because the assistant is backed by an LLM, it can also handle any question you would ask a conversational AI, from explaining a concept to writing a cookie recipe.
Where to find the Visualize This
Visualize This appears in the Atoti UI after successful setup. No additional navigation is required to locate it. The screenshot below shows the assistant as it appears in the interface: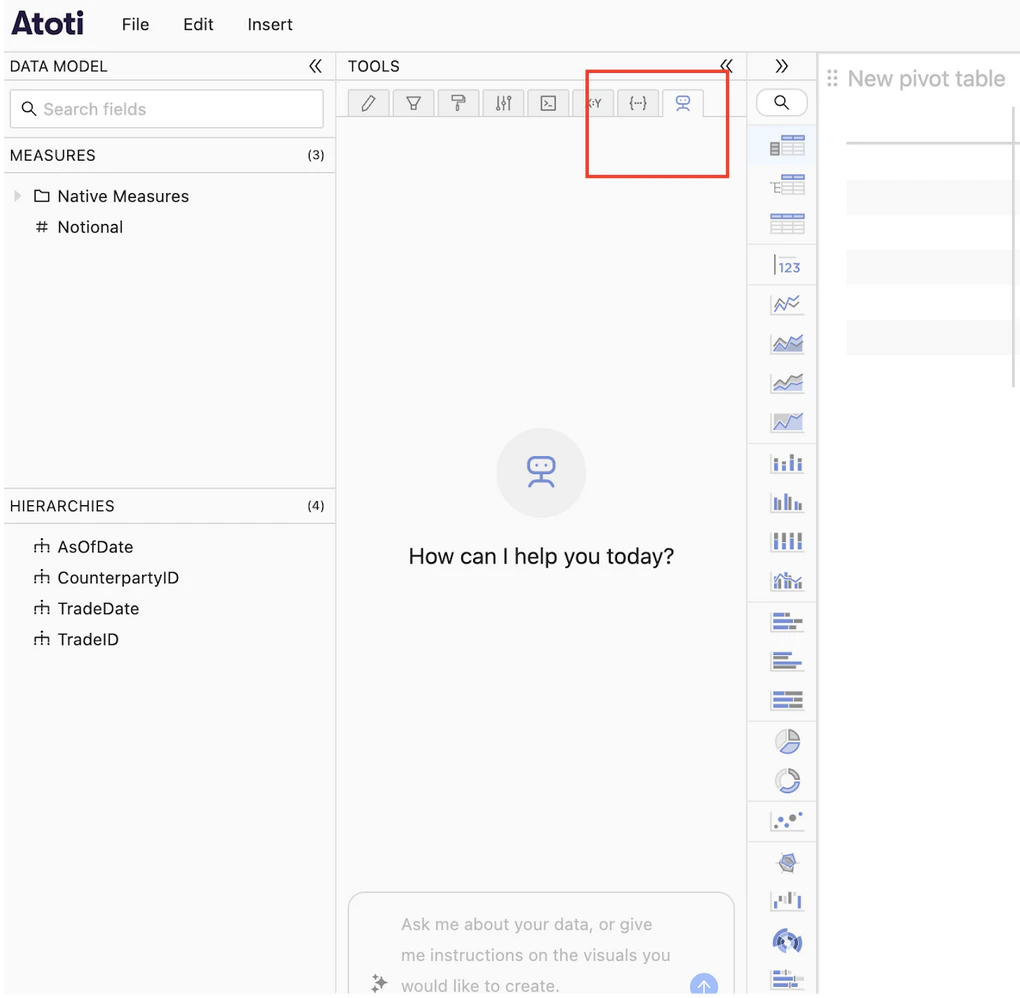
How to use Visualize This
Prerequisites
Before using Visualize This, ensure the following requirements are met:- Visualize This is set up in the project
- An LLM is configured
- The Atoti application is running
- The Atoti UI is accessible
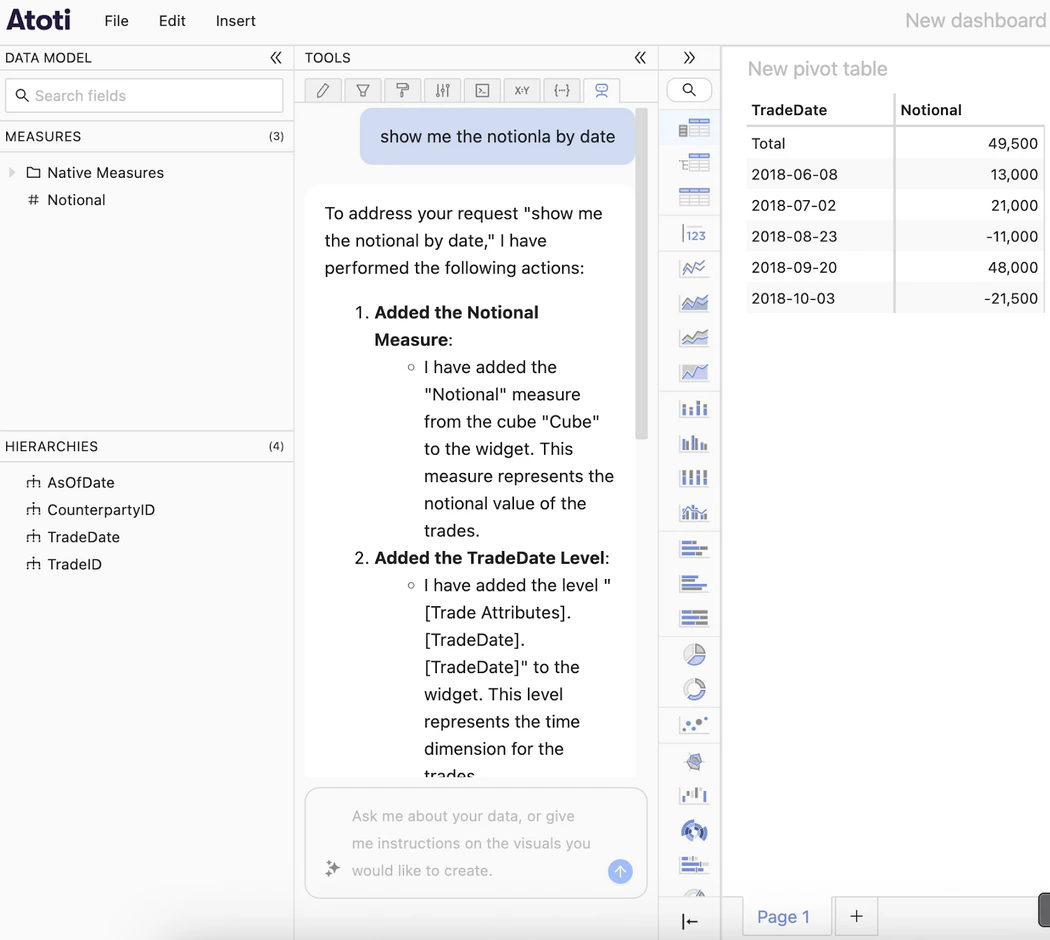
Create a visualization
Follow these steps to create a visualization with Visualize This:- Start the Atoti application
- Open the Atoti UI in a browser
- Locate Visualize This in the interface
- Type a question or request in natural language
- Wait for the assistant to generate the visualization
- Create specific chart types such as bar charts, line graphs, and pie charts
- Analyze trends over time
- Compare values across dimensions
- Generate dashboards with multiple visualizations
Related reading
- Set up Visualize This to configure the feature in a project and add cube context