

Atoti Intelligence Essentials
This is part of the Atoti Intelligence Essentials offer.What is Auto-Explain
Auto-Explain analyzes data to identify the root causes of variations. When a metric changes between two data points, Auto-Explain examines the underlying data structure to determine which factors contributed to the change. Auto-Explain produces two kinds of output:- Root-cause analysis: the root cause members, their contribution percentages, and the contribution tables. This is produced by a deterministic algorithm and does not require an LLM.
- AI summary: an optional natural-language summary of the results. This requires an LLM to be configured. When no LLM is configured, requesting an AI summary returns a message indicating the AI summary is unavailable instead of a generated summary.
Why use Auto-Explain
Auto-Explain reduces the time spent investigating data variations manually. Key benefits include:- Identify root causes automatically
- Get clear explanations of metric changes
- Work with existing Atoti data models
- Focus analysis on relevant dimensions through configuration
Where to find Auto-Explain
Auto-Explain is available in the context menu of pivot tables in the Atoti UI after successful setup. To access it, right-click on a selected cell in a pivot table and select Auto-Explain from the context menu: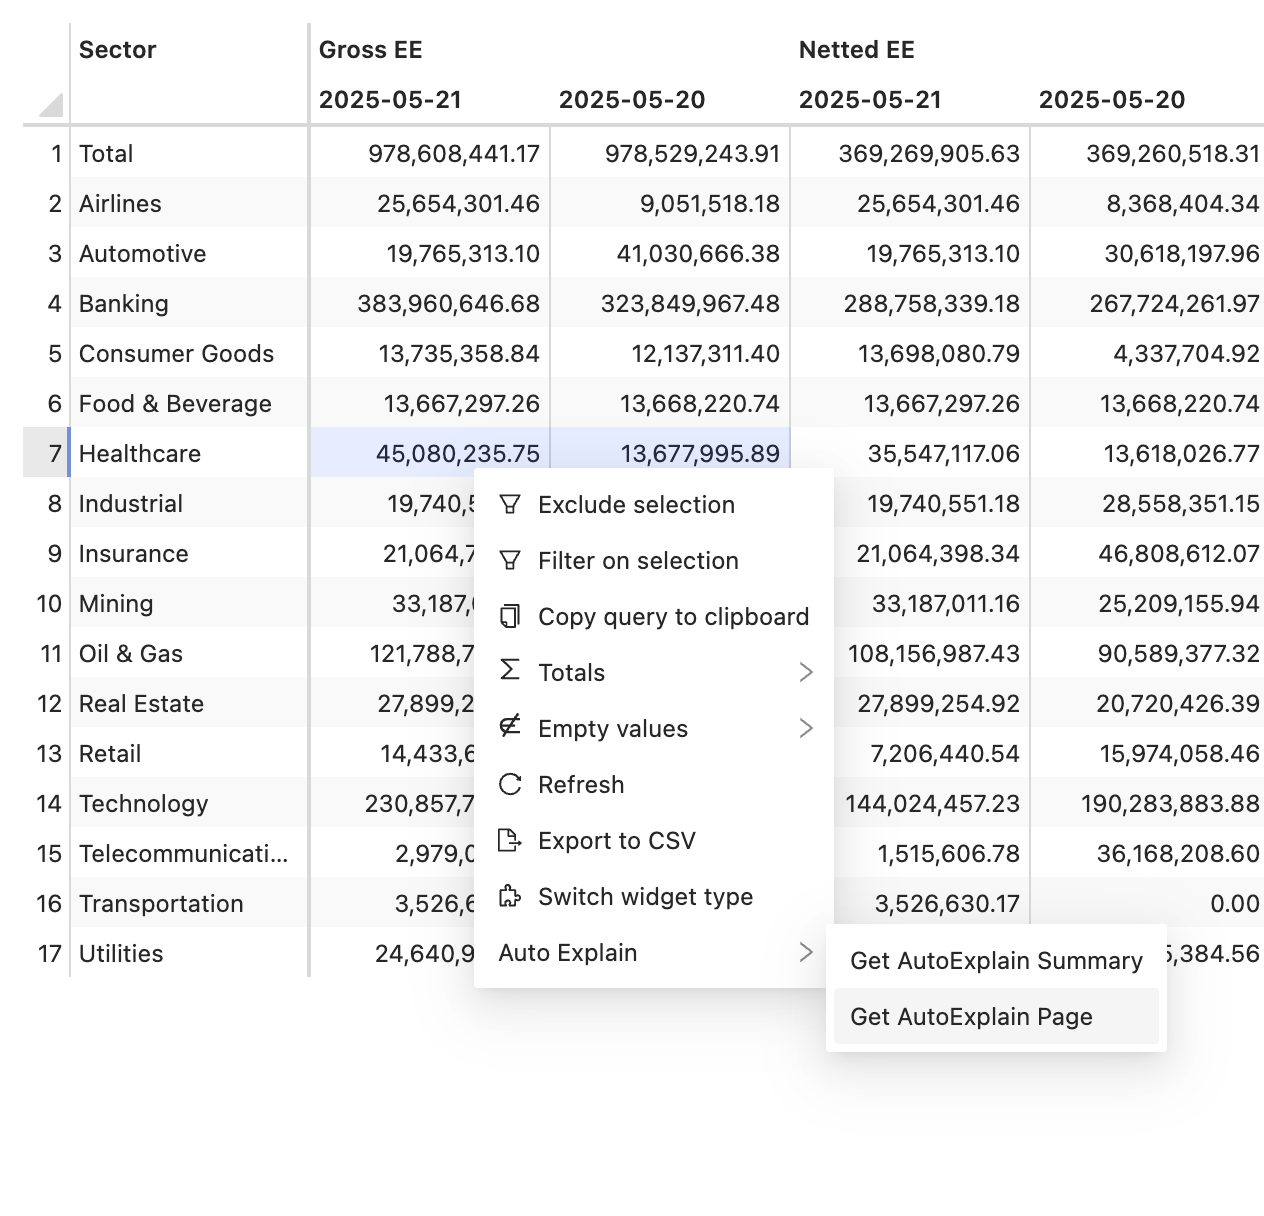
How to use Auto-Explain
Prerequisites
Before using Auto-Explain, ensure the following requirements are met:- Auto-Explain is set up in the project
- The Atoti application is running
- The Atoti UI is accessible
- A pivot table with data is available
Analyze a variation
Follow these steps to analyze a variation between two cells:- Open a pivot table in the Atoti UI
- Select two cells to compare
- Right-click one of the selected cells
- Select Auto-Explain from the context menu
- Wait for the analysis to complete
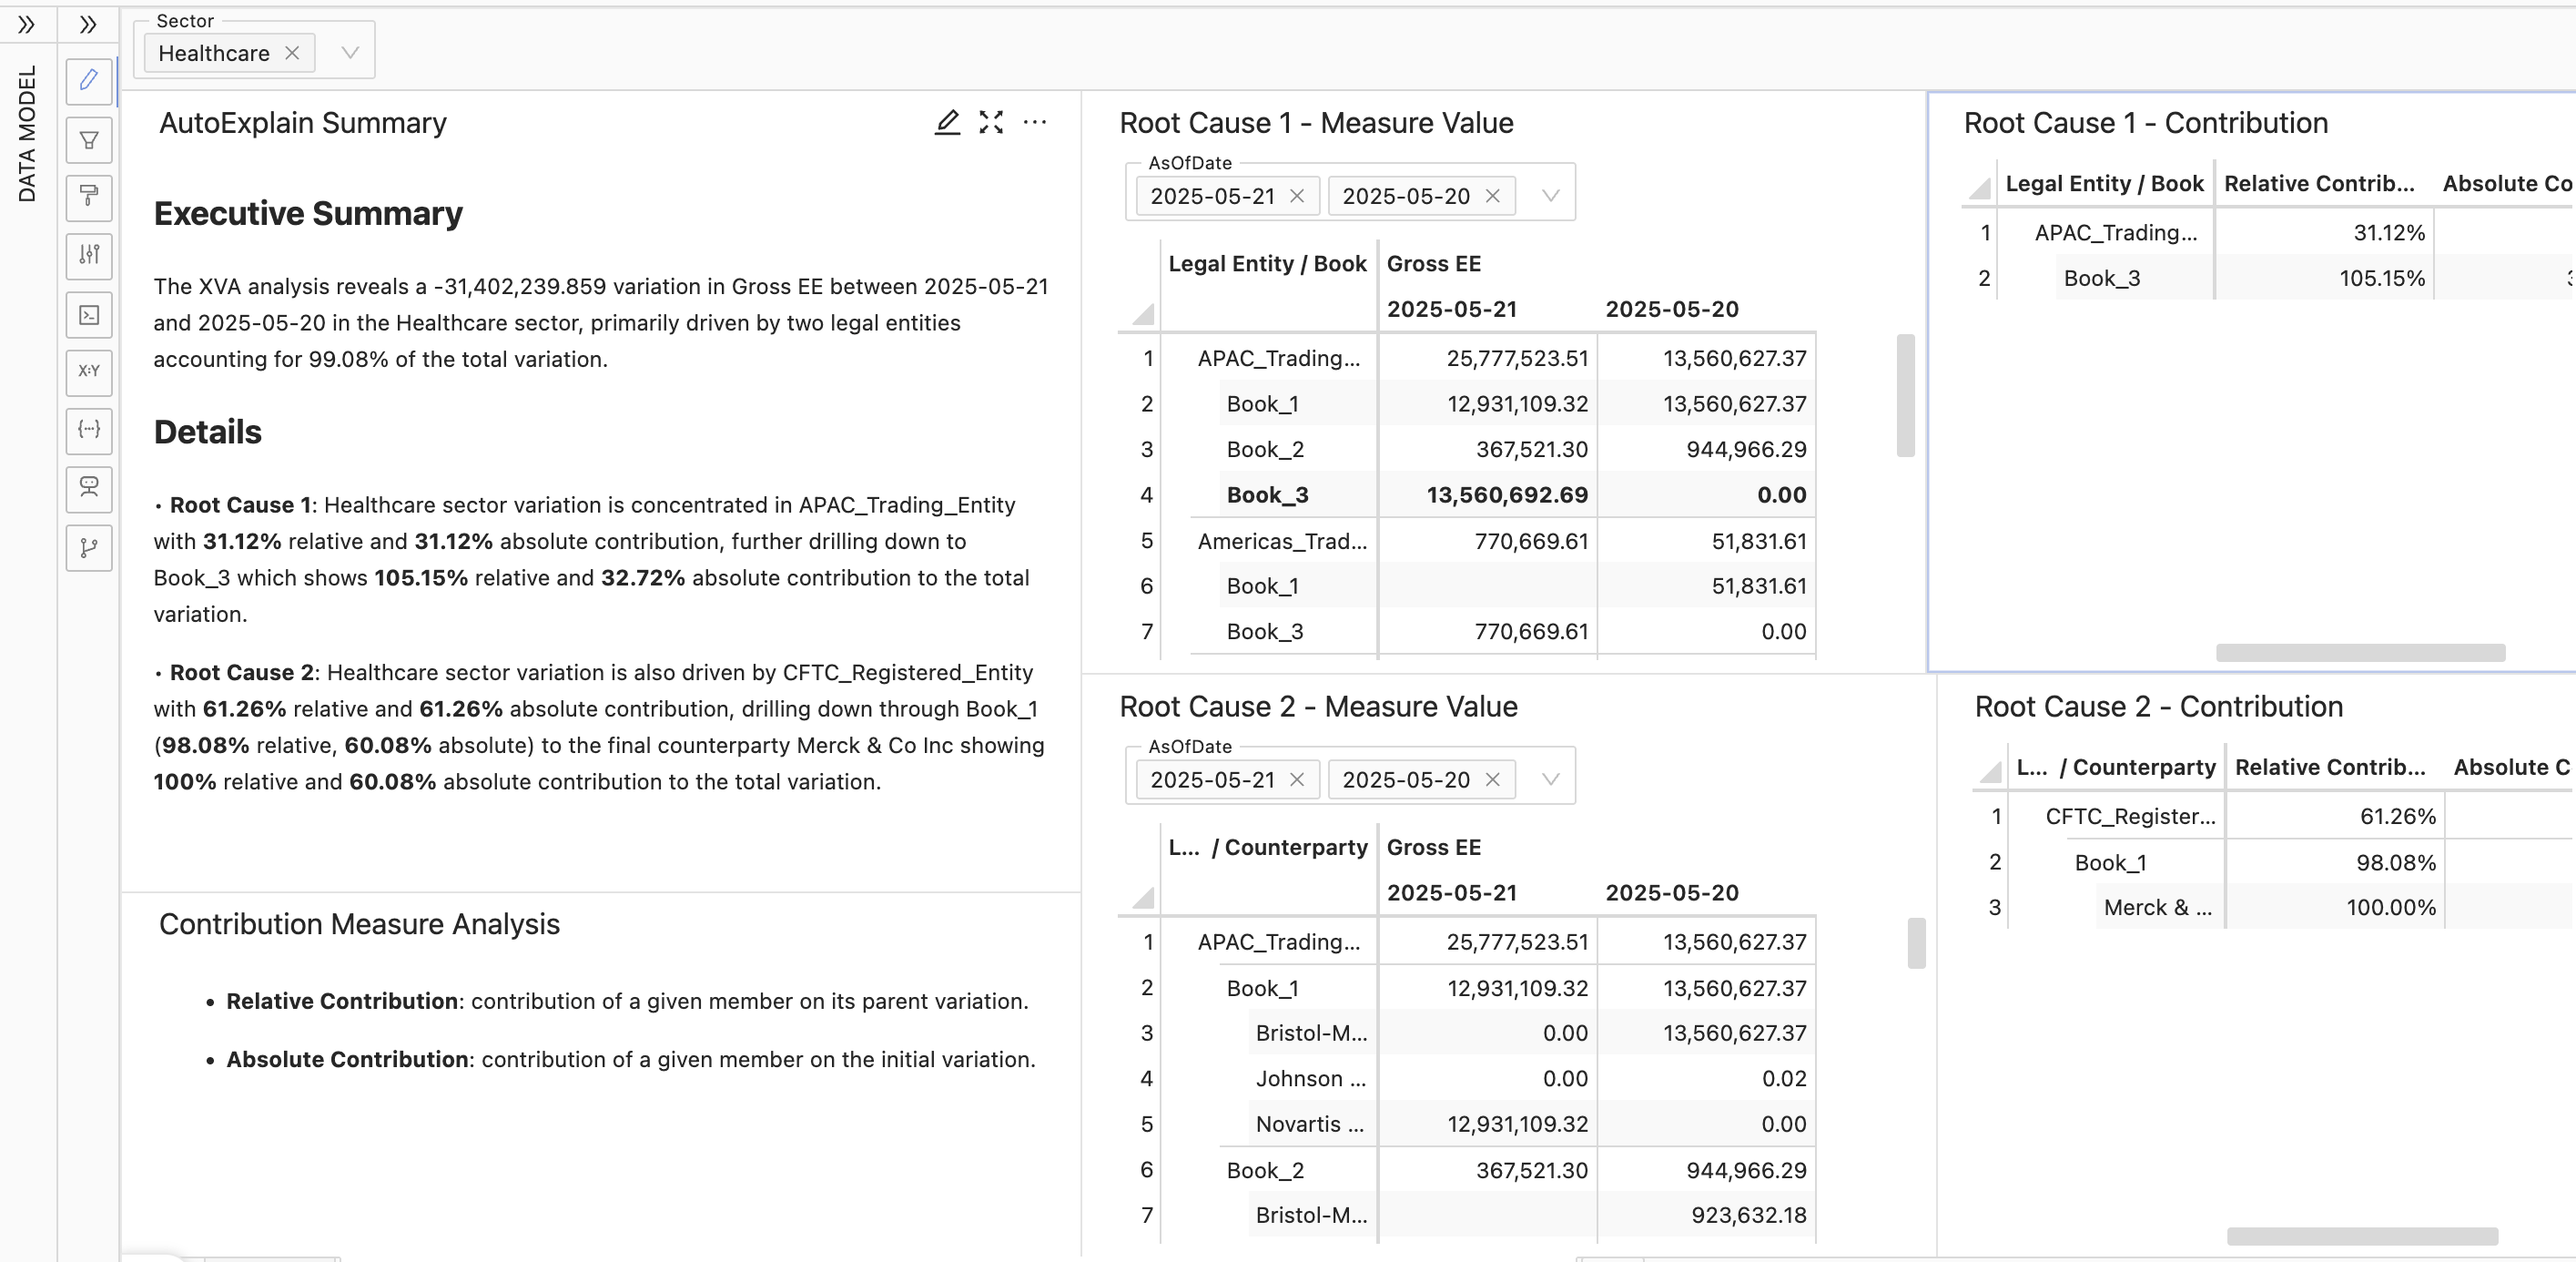
Interpret the results
The Auto-Explain results always include:- Root cause members that contribute to the variation
- Contribution percentages for each factor
- Hierarchy levels where variations occur
Related reading
- Set up Auto-Explain to add the feature to a project and customize its behavior