Tracing
This page walks you through how Tracing is used with Atoti Data Connectors and how to configure Tracing in your Atoti Server application.
Tracing Prerequisites
Atoti Data Connectors rely on Atoti Server’s APM (Application Performance Monitoring library) and a Tracing library to name and track internal operations and processes. For instance, the DLC will name a task based on a Tracer’s TraceId and all subsequent processes will also be tagged with the same TraceId but with a unique SpanId. TraceId and SpanIds are unique Hex strings, such as “7a8c982a87b050f2”.
Due to this reliance on Tracing, the ActivePivot APM module needs to be configured in your Atoti Server project. You can read Configuring APM in Atoti Server for details.
You will need to add a Tracing Configuration to your project. You can see an example below or implement your own by following the Atoti Server Tracing documentation.
Example Tracing Configuration
A spring Tracing Configuration has to be present in your ApplicationConfiguration.
Here is an example of a Tracing Configuration using Open Zipkin/Brave.
Dependencies for both APM and openzipkin/brave:
<!-- Tracing Dependencies -->

<!-- APM Dependencies -->
<dependency>
	<groupId>org.springframework.cloud</groupId>
	<artifactId>spring-cloud-starter-sleuth</artifactId>
	<version>${spring-sleuth.version}</version>
</dependency>
<dependency>
	<groupId>org.springframework.cloud</groupId>
	<artifactId>spring-cloud-sleuth-zipkin</artifactId>
	<version>${spring-sleuth.version}</version>
</dependency>

<!-- Brave used for APM -->
<dependency>
	<groupId>io.zipkin.brave</groupId>
	<artifactId>brave-instrumentation-spring-webmvc</artifactId>
	<version>${tracing.zipkin.brave.version}</version>
</dependency>

<!-- End of Tracing Dependencies -->
Brave Tracing Configuration Class
/**
 * Brave tracing configuration.
 *
 * This configuration is only enabled if Brave is included in the classpath.
 *
 * @author ActiveViam
 */
@Configuration
@ConditionalOnClass({Tracer.class})
public class BraveTracingConfig {

	@Bean
	public Tag<Throwable> errorTag() {
		return new Tag<>("error") {

			@Override
			protected String parseValue(Throwable input, TraceContext context) {
				return LoggingUtils.getMessageWithRootCauseDetail(input);
			}

		};
	}

	@Bean
	public Sampler defaultSampler() {
		return Sampler.ALWAYS_SAMPLE;
	}

	@Bean
	public ServletContextInitializer servletTracing() {
		return servletContext -> {
			// Enables tracing for servlet
			DelegatingTracingFilter filter = new DelegatingTracingFilter();
			String filterName = Conventions.getVariableName(filter);
			final FilterRegistration.Dynamic registration = servletContext.addFilter(filterName, filter);
			registration.addMappingForUrlPatterns(EnumSet.of(DispatcherType.REQUEST), true, "/*");
		};
	}

}
Finally, add the BraveTracingConfig.class to your ApplicationConfig and APM will automatically use this Brave configuration.
How Tracing Is Used
What Is A TraceContext?
A TraceContext will be added to HealthEvents. This TraceContext object has a TraceId and SpanId property. The TraceContext is added to HealthEvents through the MonitoredHealthEventDispatcher. TraceContexts can be null if the APM Tracing has not properly been configured. When a DLC process is started, a Tracer is created. All processes started from within the DLC process are traced with the same TraceId. A TraceContext contains three values:
| TraceContext Property | Value |
|---|---|
| TraceId | Globally unique ID. All tracers created under the parent tracer contain the same TraceId. |
| ParentId | Parent tracer’s SpanId. This is the SpanId of the parent tracer. |
| SpanId | Globally unique ID of the current process. Every time a new tracer is created (even under a parent), this value will be unique. |
Example
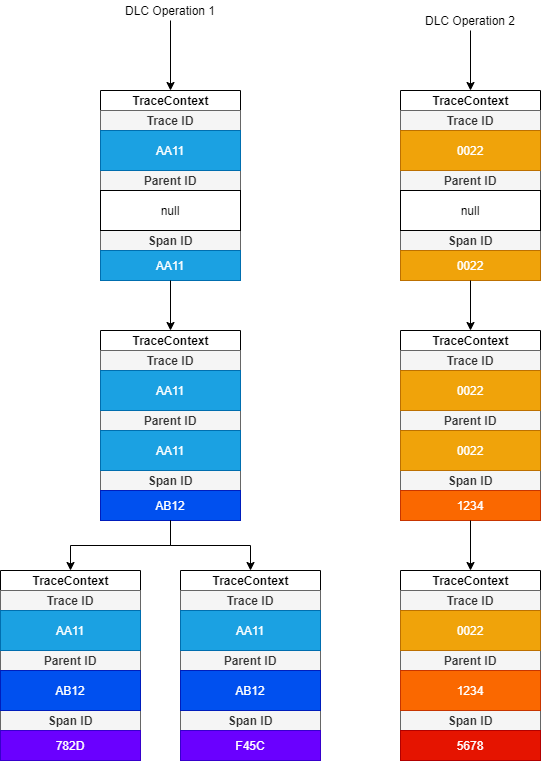
Here’s an example of how the TraceContext is used and tracked through child processes.
In the image below, we have two DLC requests to execute in the DLC:

Each DLC request is given its own TaskTracer to trace all processes.
Every time a new sub-process is created, a child tracer is created under the current tracer. Here we can see how all tracers for a DLC request have the same TraceId. This is because all child tracers created from an existing tracer share the TraceId.
We can also see that all child tracers have a unique SpanId. The SpanId for the first tracer is the same as the TraceId - this is because this is the root tracer. Additionally all SpanId’s are used as child TraceContext’s Parent ID. With this information we can trace back an event to its parent and vice versa.