Viewing QIS Numbers
In this section, we explain how to view the Quantitative Impact Study figures using predefined bookmarks.
Displaying bookmarks
Atoti FRTB comes with an analytical tool and a set of predefined bookmarks displaying the risk metrics. Ask your IT administrator for access to the application’s URL.
After you launch the application, click the ActiveViam icon in the top-left corner to open the Dashboards gallery. This presents the list of bookmarks available to you.
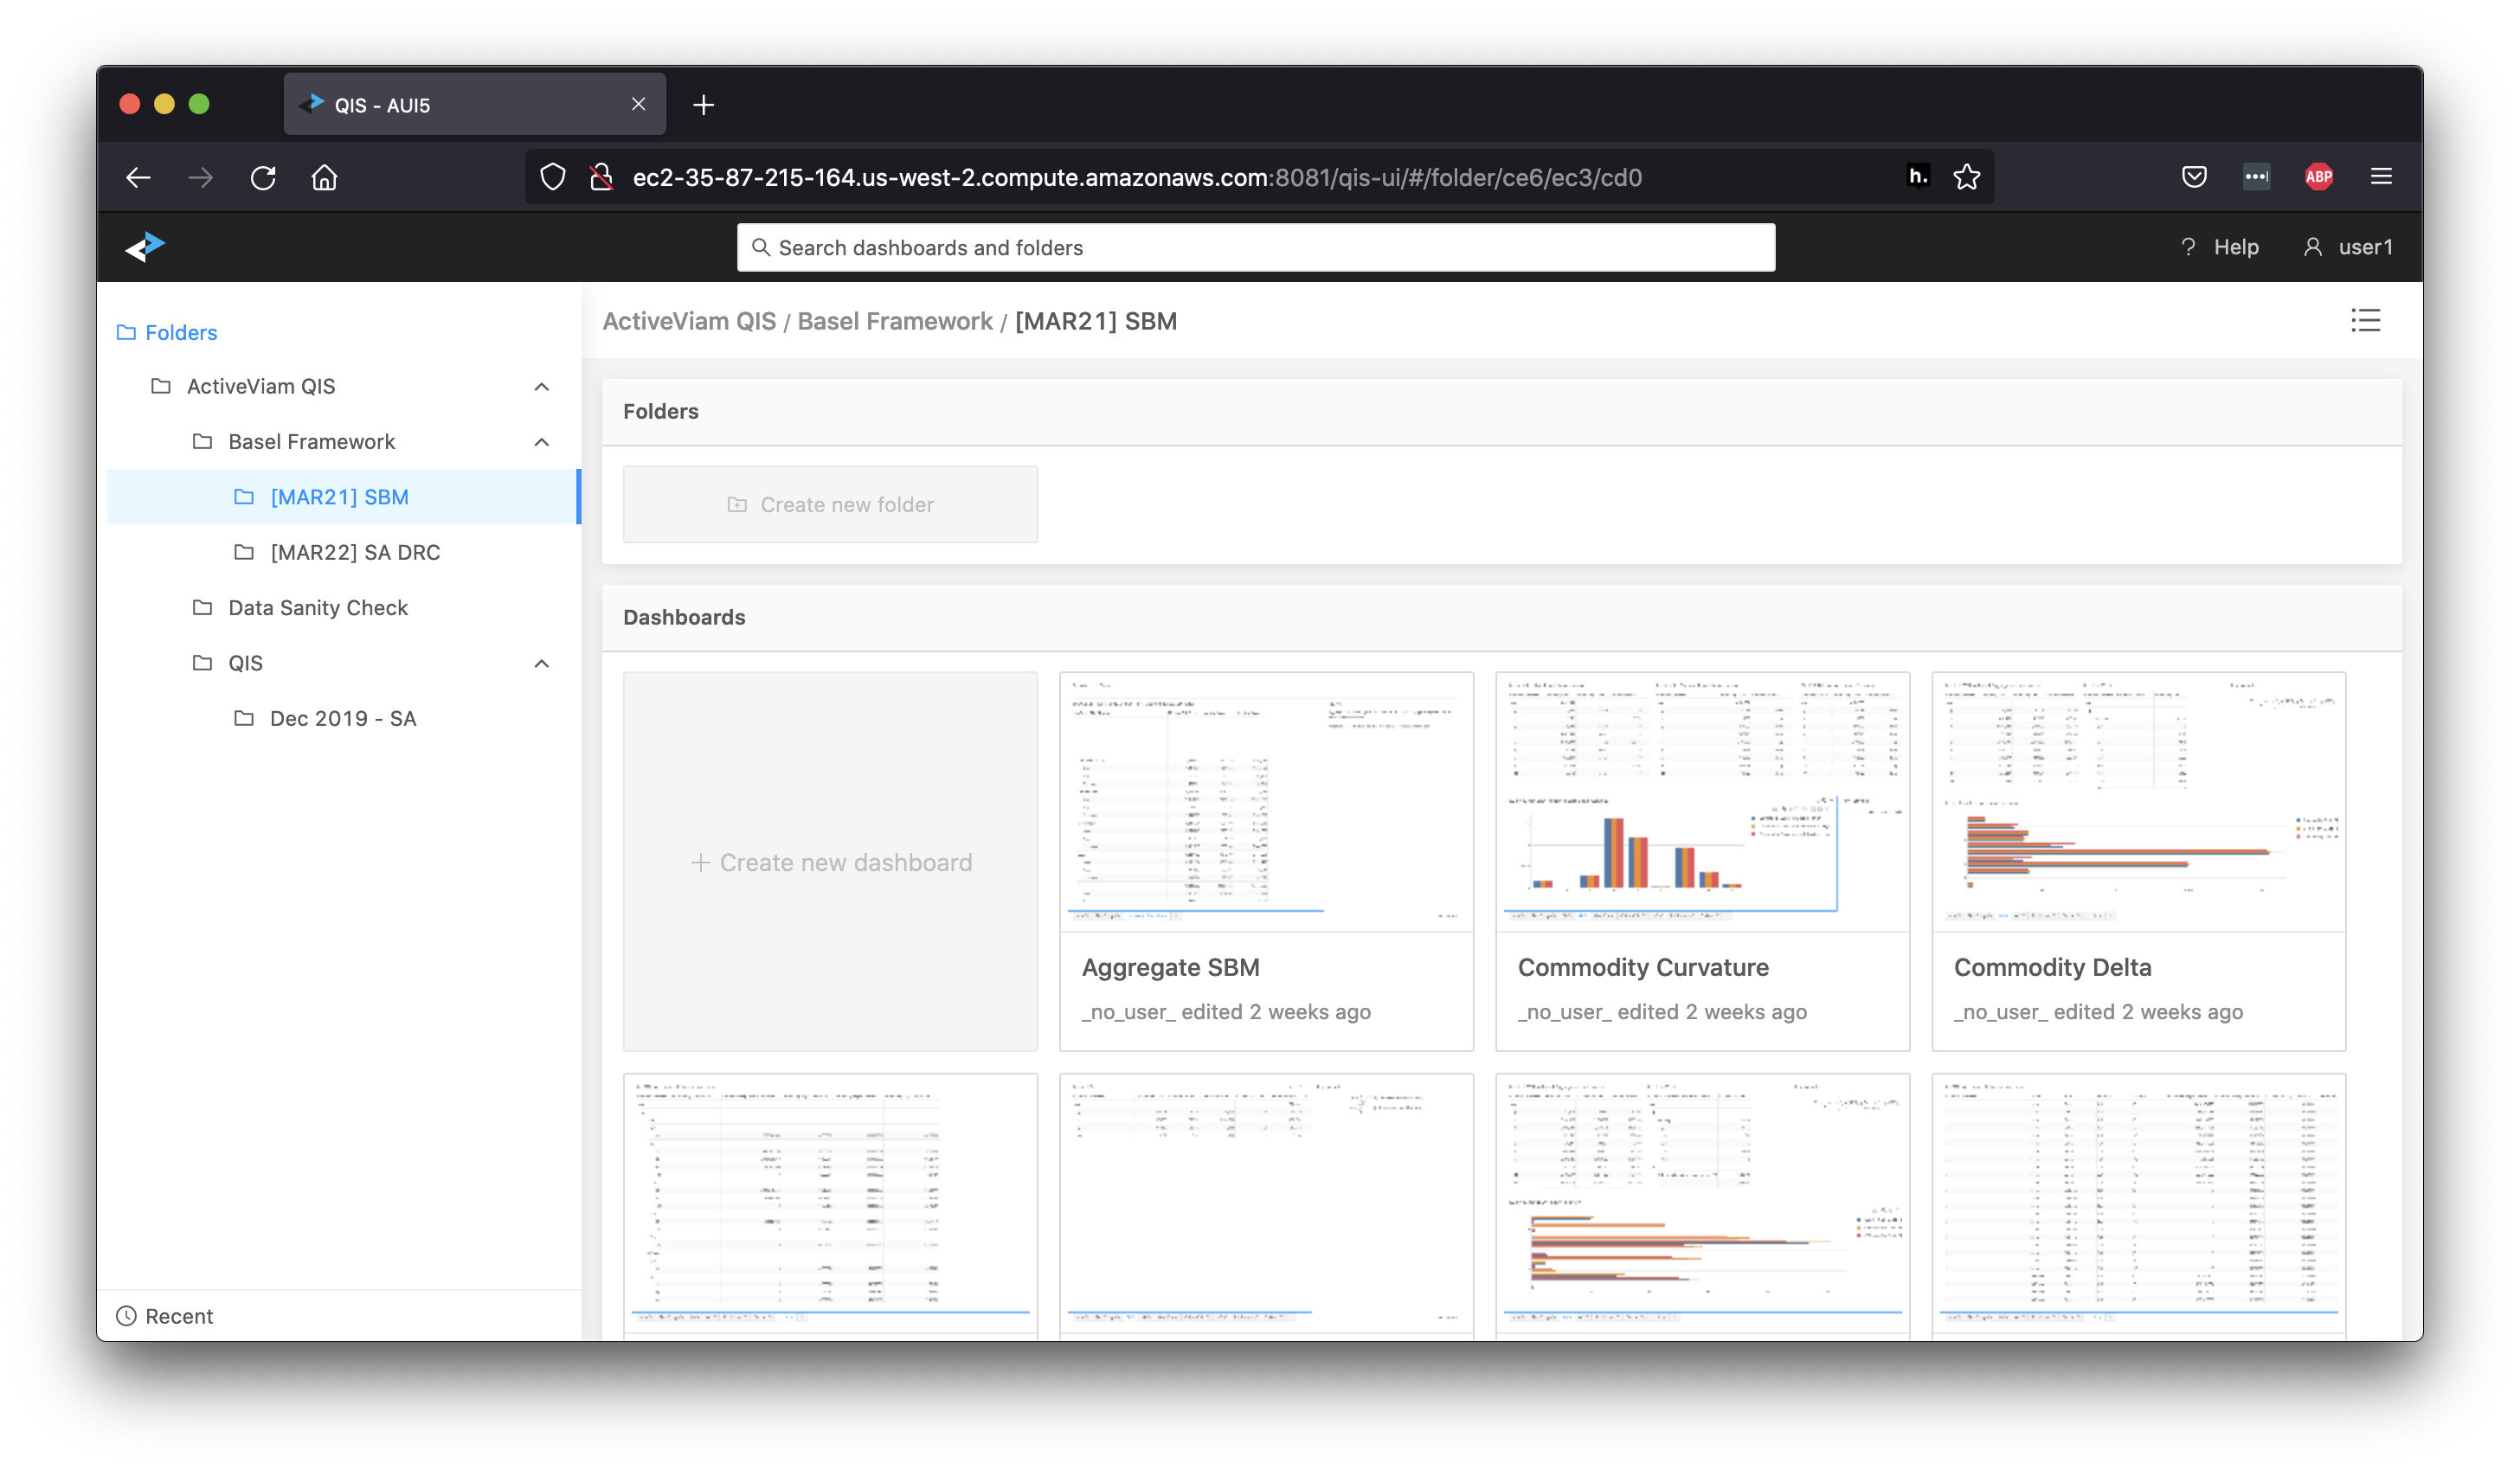
In this version of Atoti FRTB we have pre-configured dashboards displaying the SA numbers and interim results at various levels:
- Dashboards in Basel Framework explore the aggregation steps - from sensitivities for SBM, notionals for RRAO, and JTD inputs for DRC - up to capital charges. You can find bucket level charges, weighted exposures, and the necessary attributes for the calculation in those dashboards. Read more in Tips for Validating the Calculations.
- Dashboards in Data Sanity Check are designed to help you sense check the input data totals. Read more in Data Sanity Check.
- Dashboards in QIS follow the QIS Excel template TB and TB risk class tabs as closely as possible to help you navigate and collect the capital numbers.
But before we start looking at the dashboards, let’s talk about filtering and exporting the numbers.
How to use the filters
In every dashboard you can filter the data to include/exclude trades or risk factors of interest - all the calculations will rerun automatically with the selected scope of exposures. Therefore, it is essential to understand the filters limiting the scope of data in the view.
For example, in the top right of this dashboard you can find a quick filter on the SA/IMA FRTB approach:
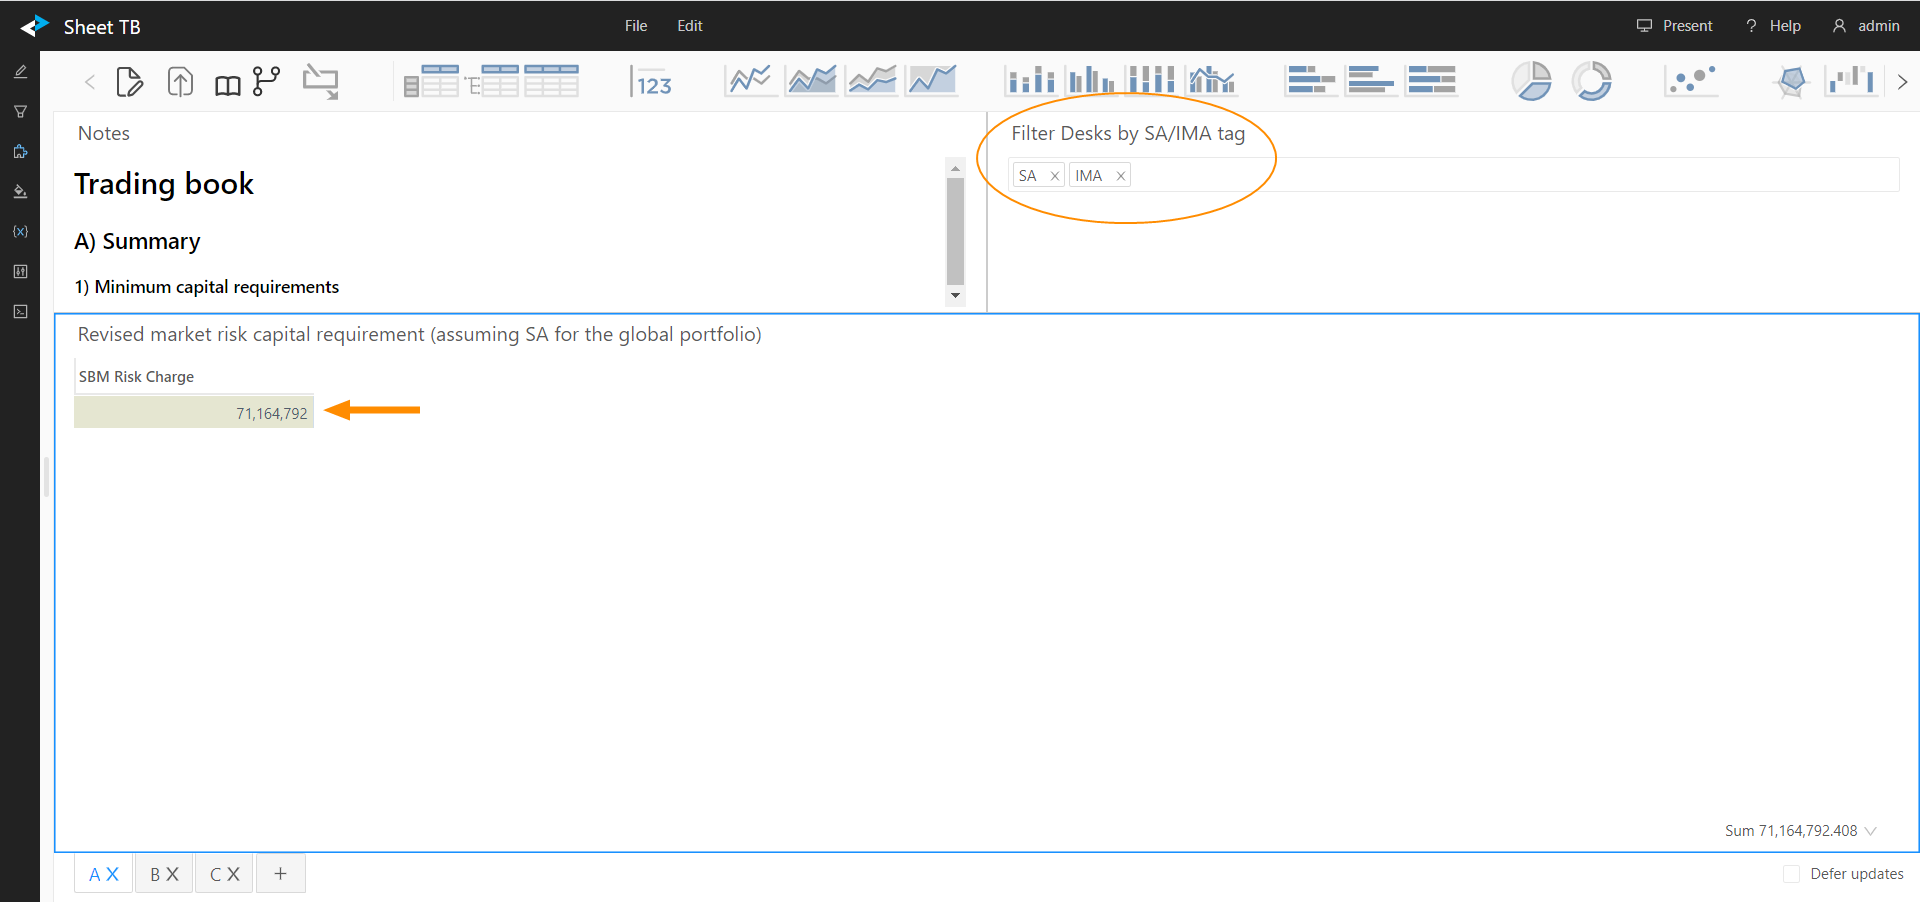
It allows you to quickly set the scope of positions to the ones tagged for SA or IMA, and view the capital numbers for the updated scope. The mapping of positions to FRTB Approach comes from the Book structure and Desk Description.
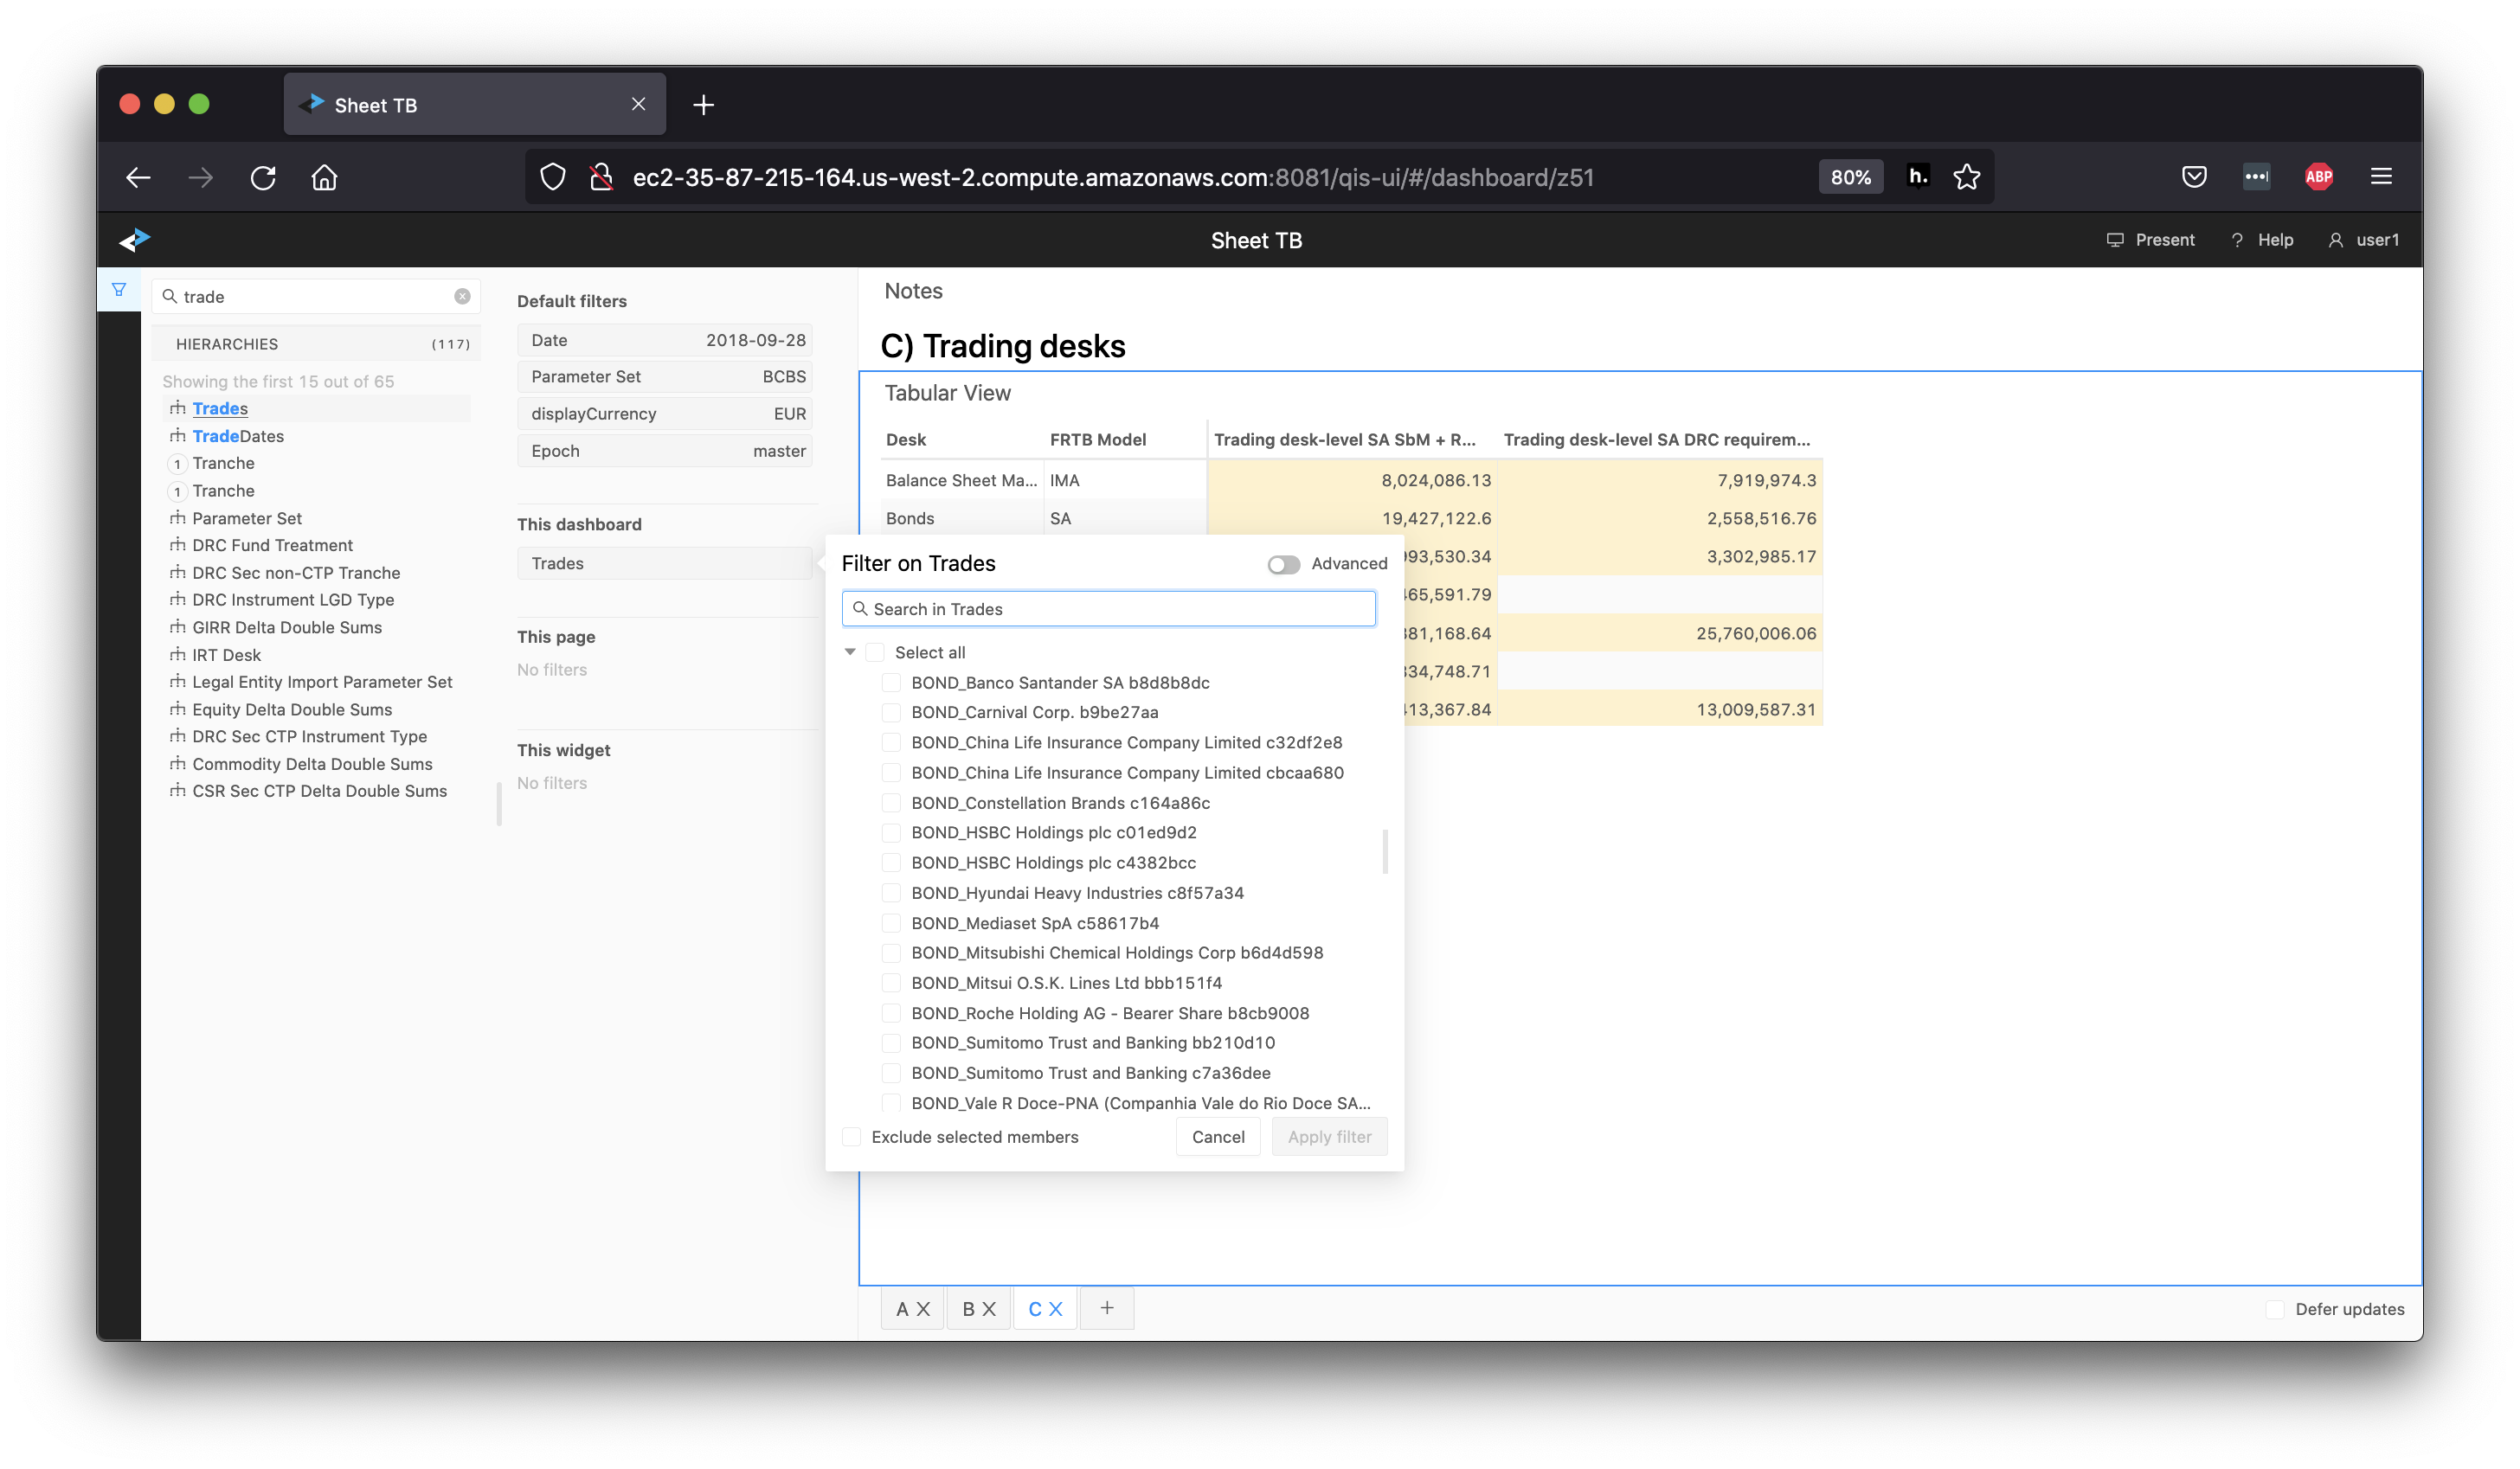
Not all active filters will be displayed as a quick filter in a dashboard. You can inspect all the filters applied to your data by clicking the “Filters” drawer on the left navigation bar. For information on the filtering feature, see the Atoti UI User Documentation.
In the following screenshot, you can see the Filters drawer open, with the Trades attribute selected:
How to export the numbers
Once you are comfortable with the numbers, you can export them. Right-click any data visualization widget and select Export to CSV file. The content is recognized as a table by Excel.
You can also use keyboard shortcuts to copy the selected range of cells. The column headers are also copied.
TB sheet
-
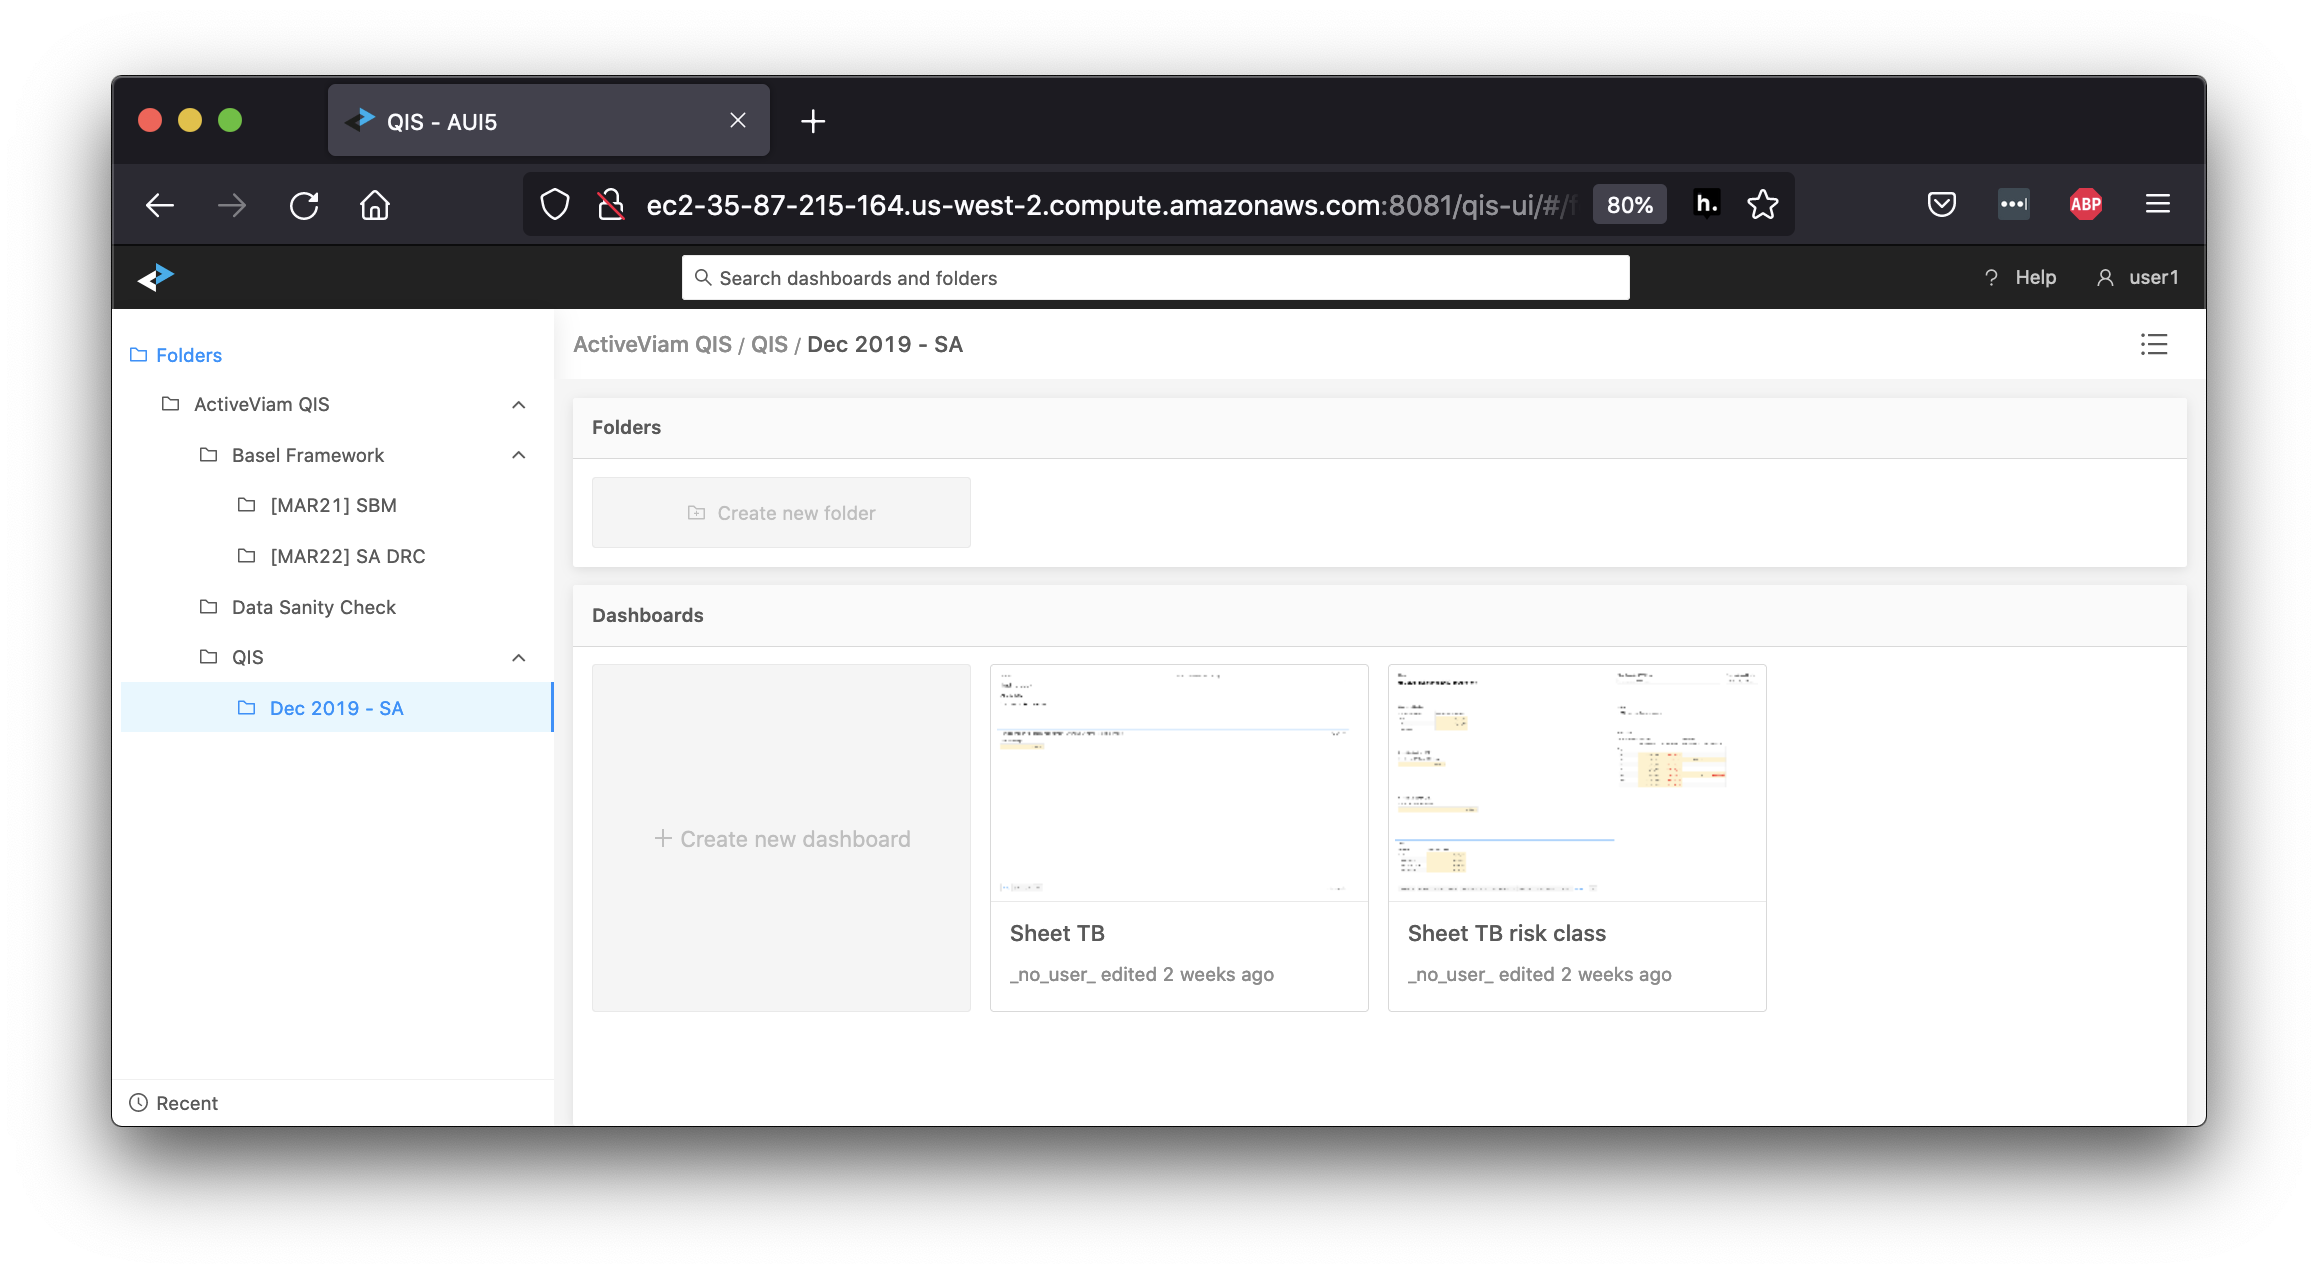
From the QIS folder, launch the Sheet TB bookmark. This dashboard helps you fill in the TB sheet in the BIS Excel template.
-
Use tab A to capture the figures for section A 1) Revised market risk capital requirement (assuming SA for the global portfolio). Make sure you have the correct filters in the view:
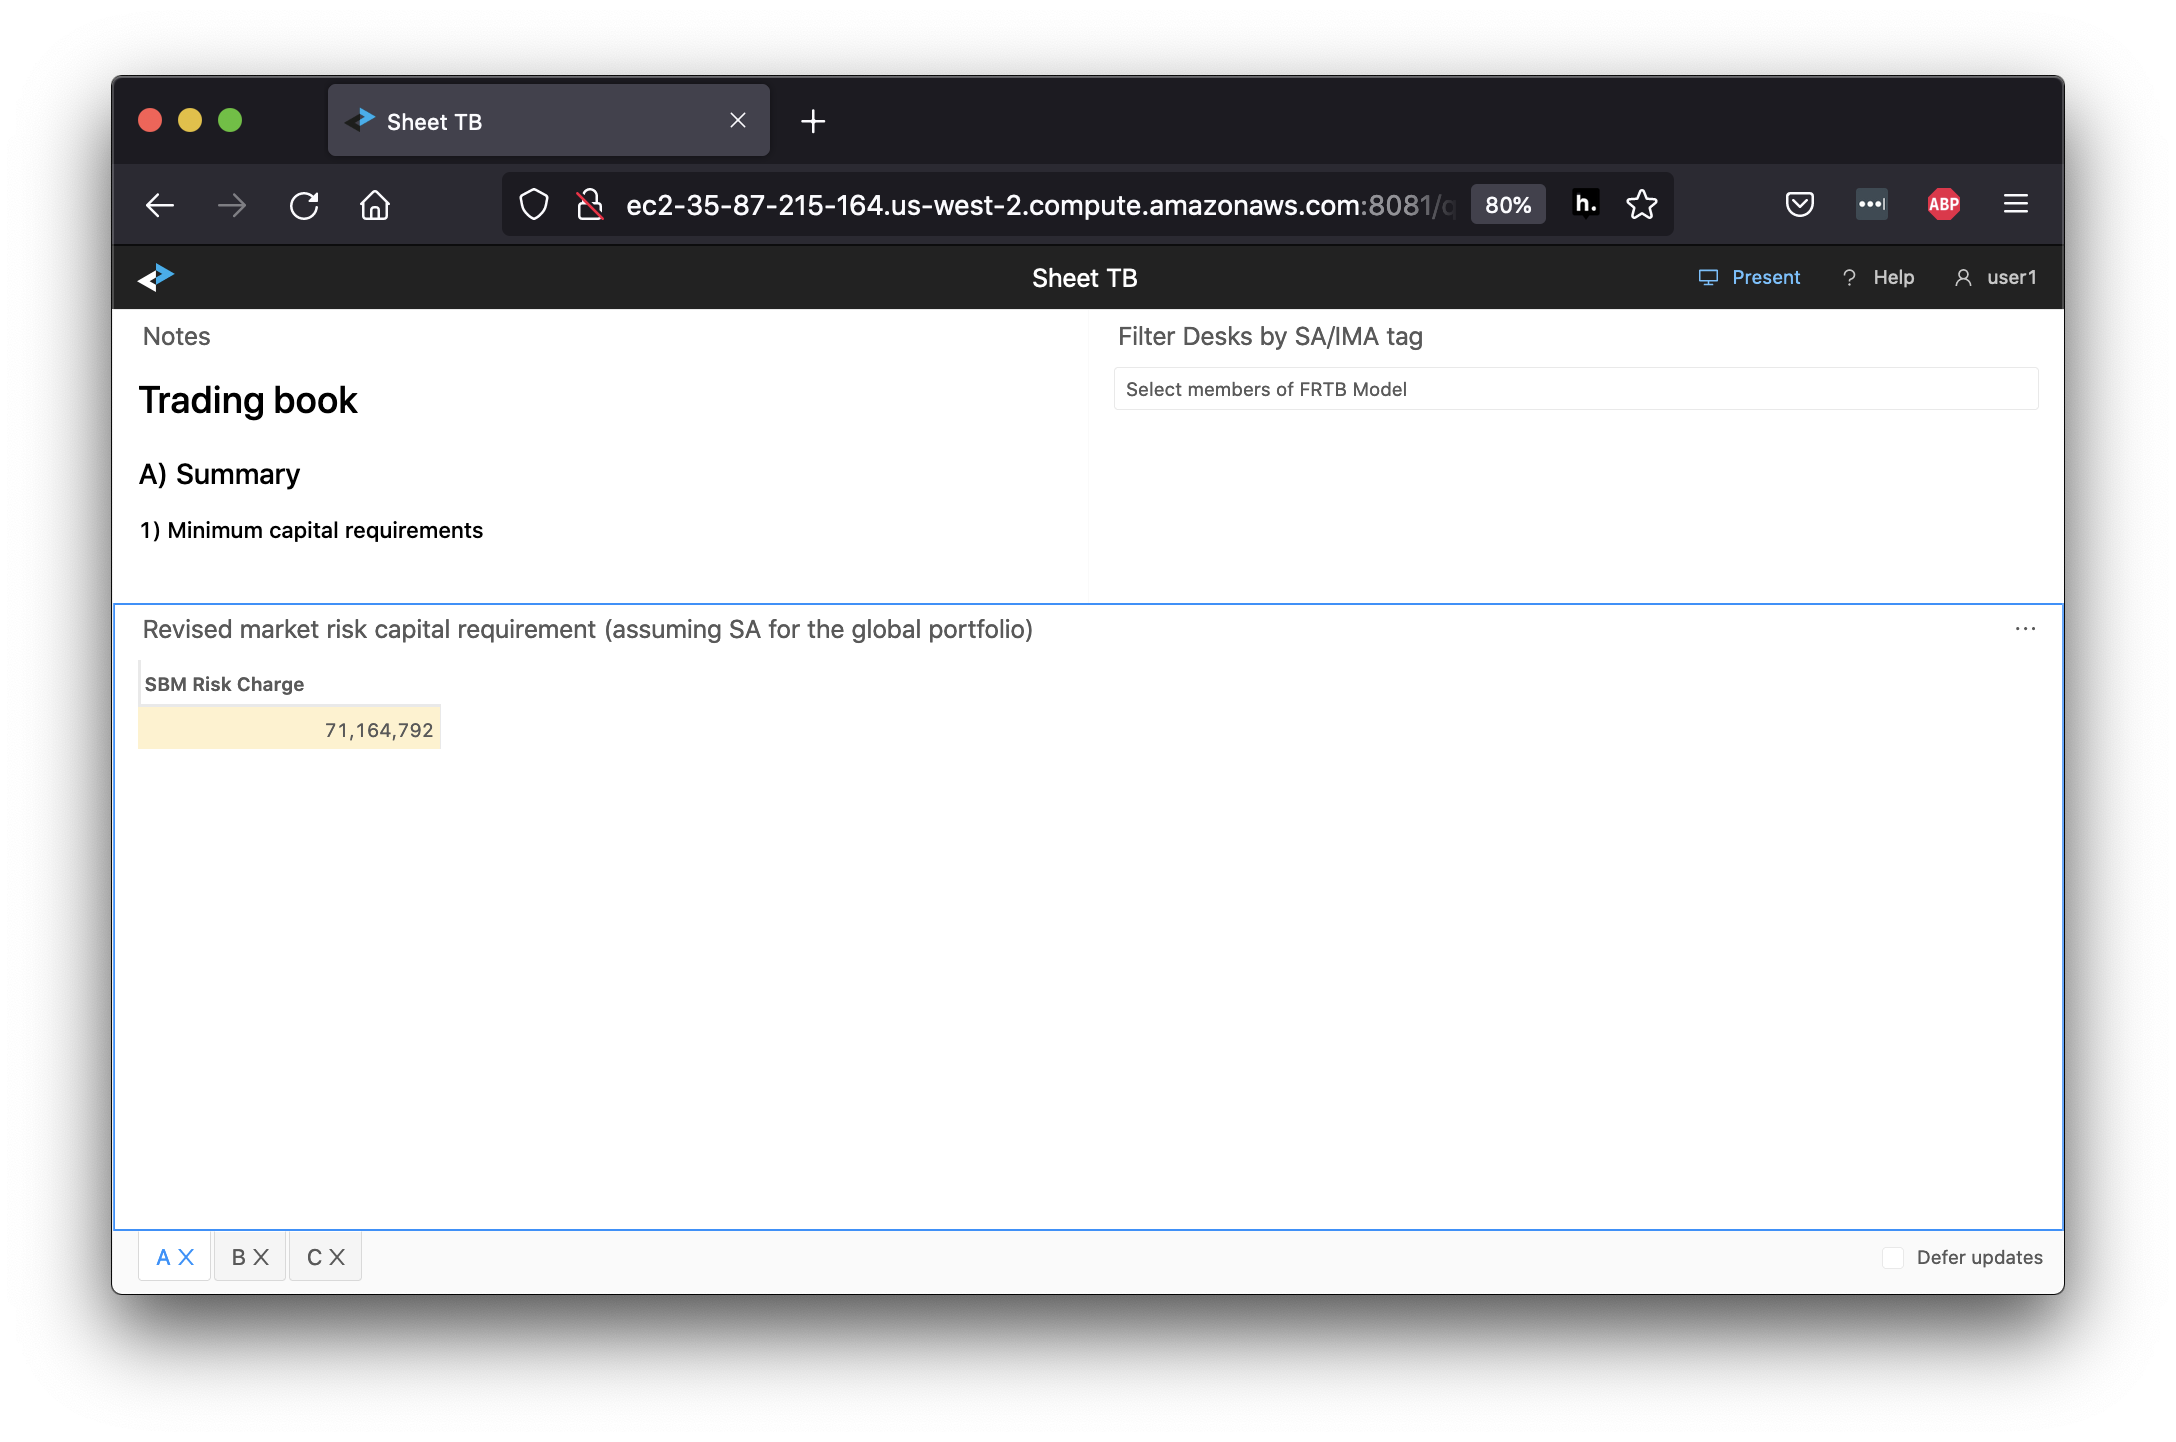
-
Use tab B to capture the figures for section B 2) Revised market risk capital requirement - SBM, RRAO, and DRC SA.
The BIS template requires these two separate capital numbers:- Assuming current model approval status, assuming all trading desks are in the BT and PLA test green zone
- Assuming current model approval status, reflecting the consequences of failing BT and PLA test
Therefore, consider using the Filtering feature described above and the book attributes delivered in the Book structure and Desk Description files.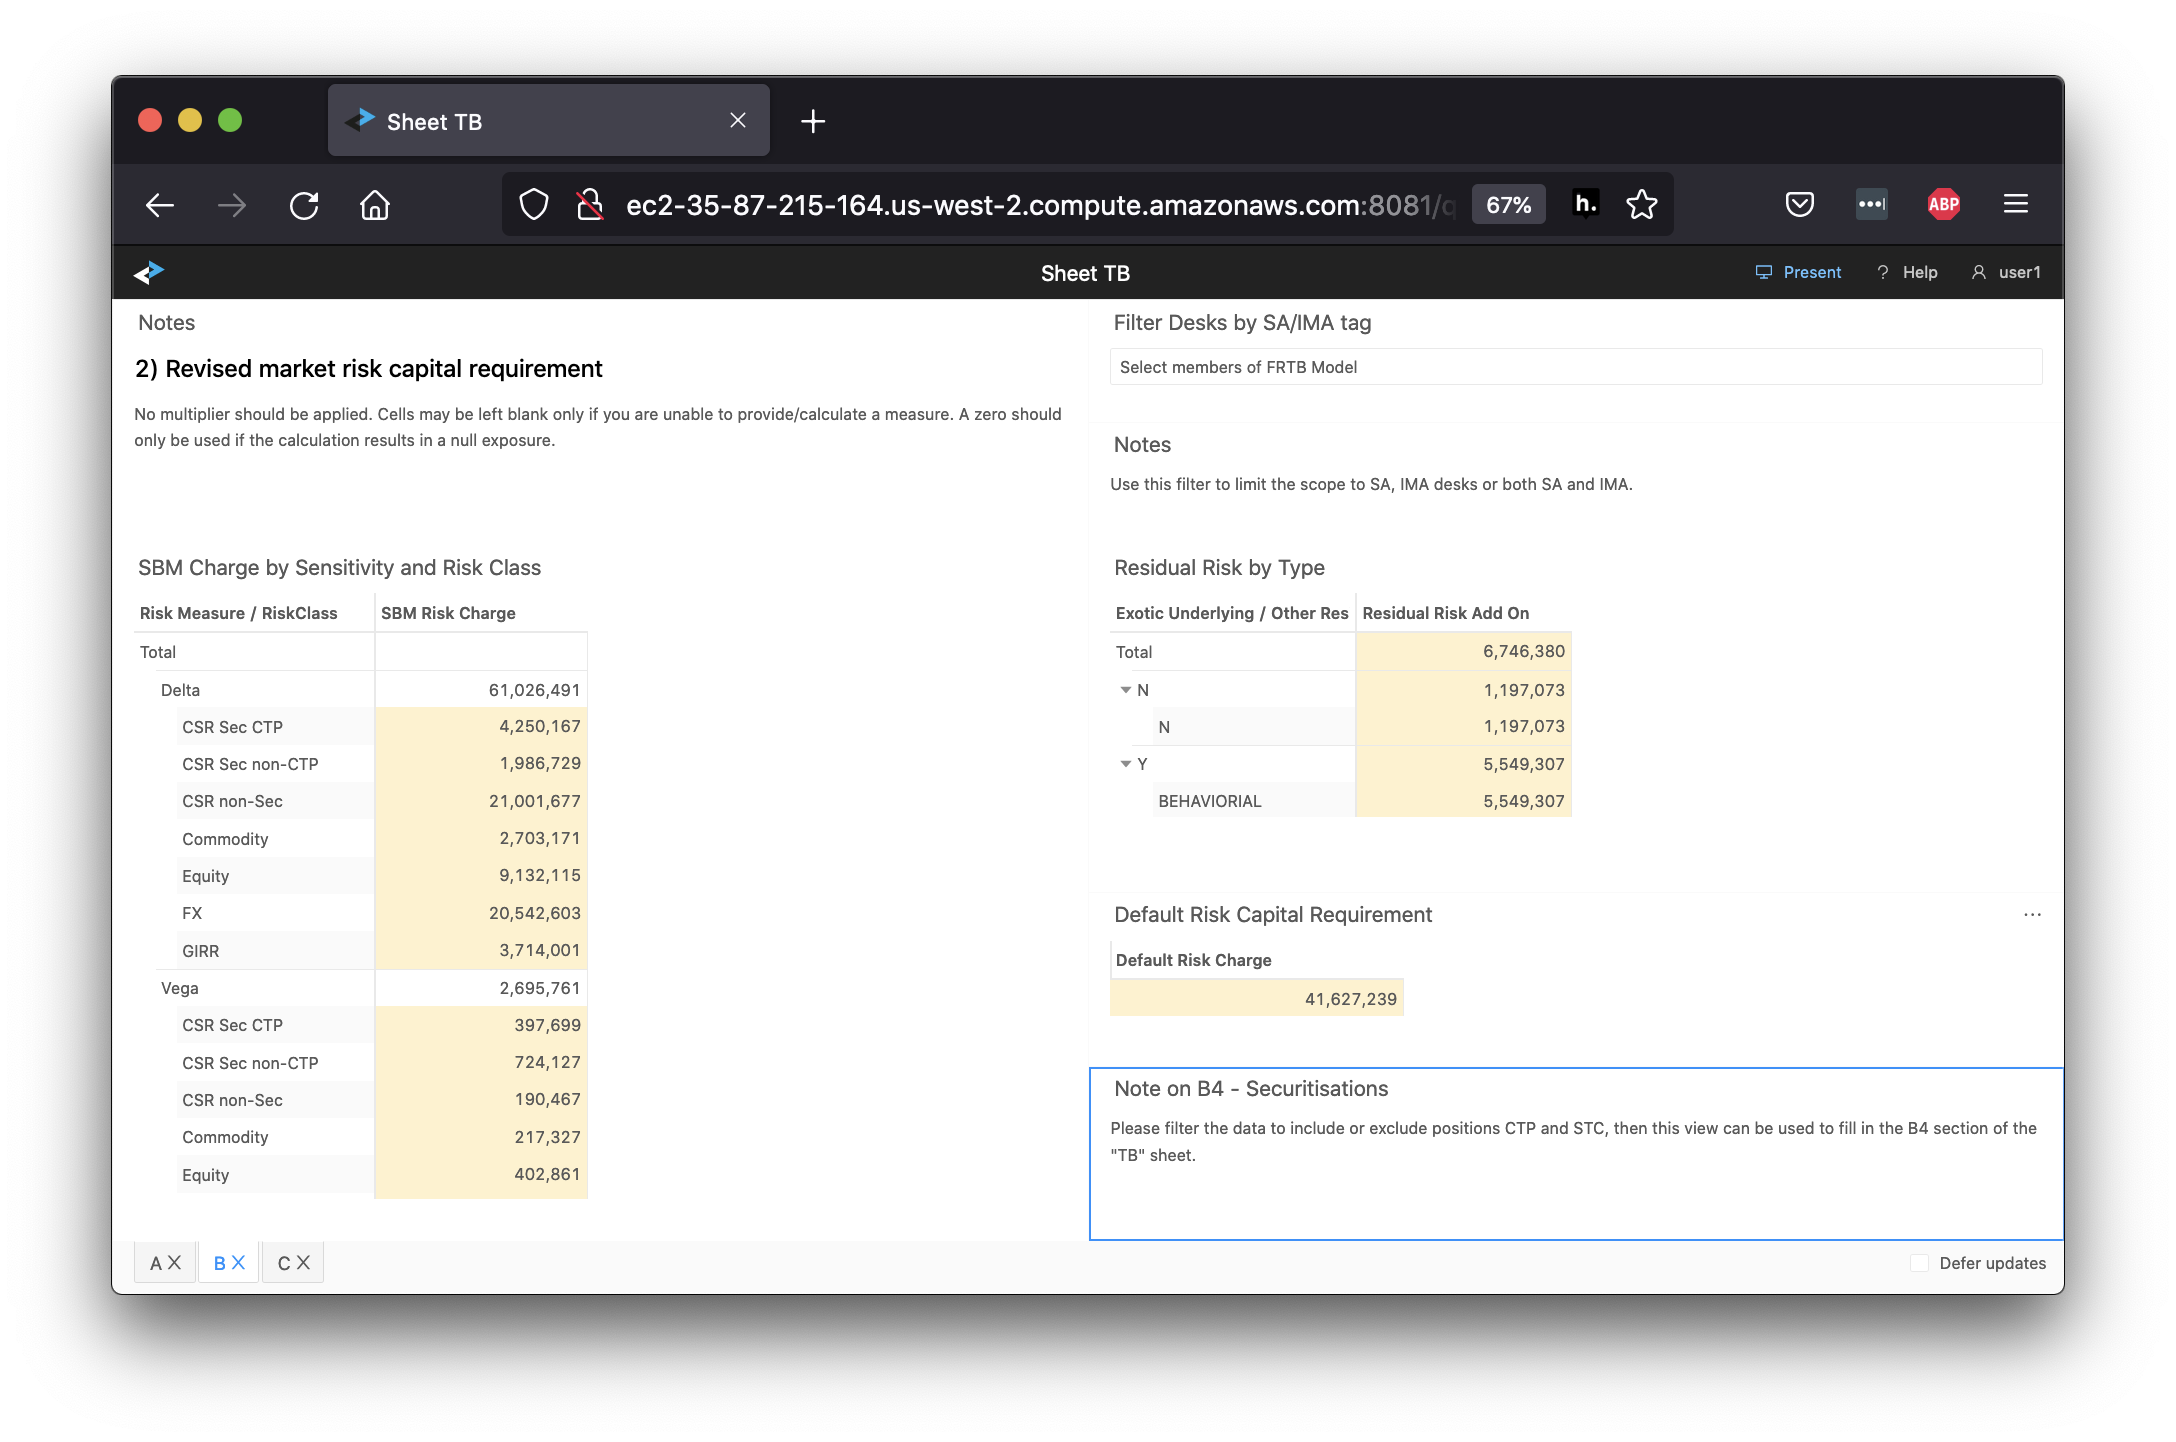
-
To fill in section 4) Securitisations (inclusive of hedges which, themselves, are not securitisations), filter the data in this view to include or exclude CTP and STC positions.
-
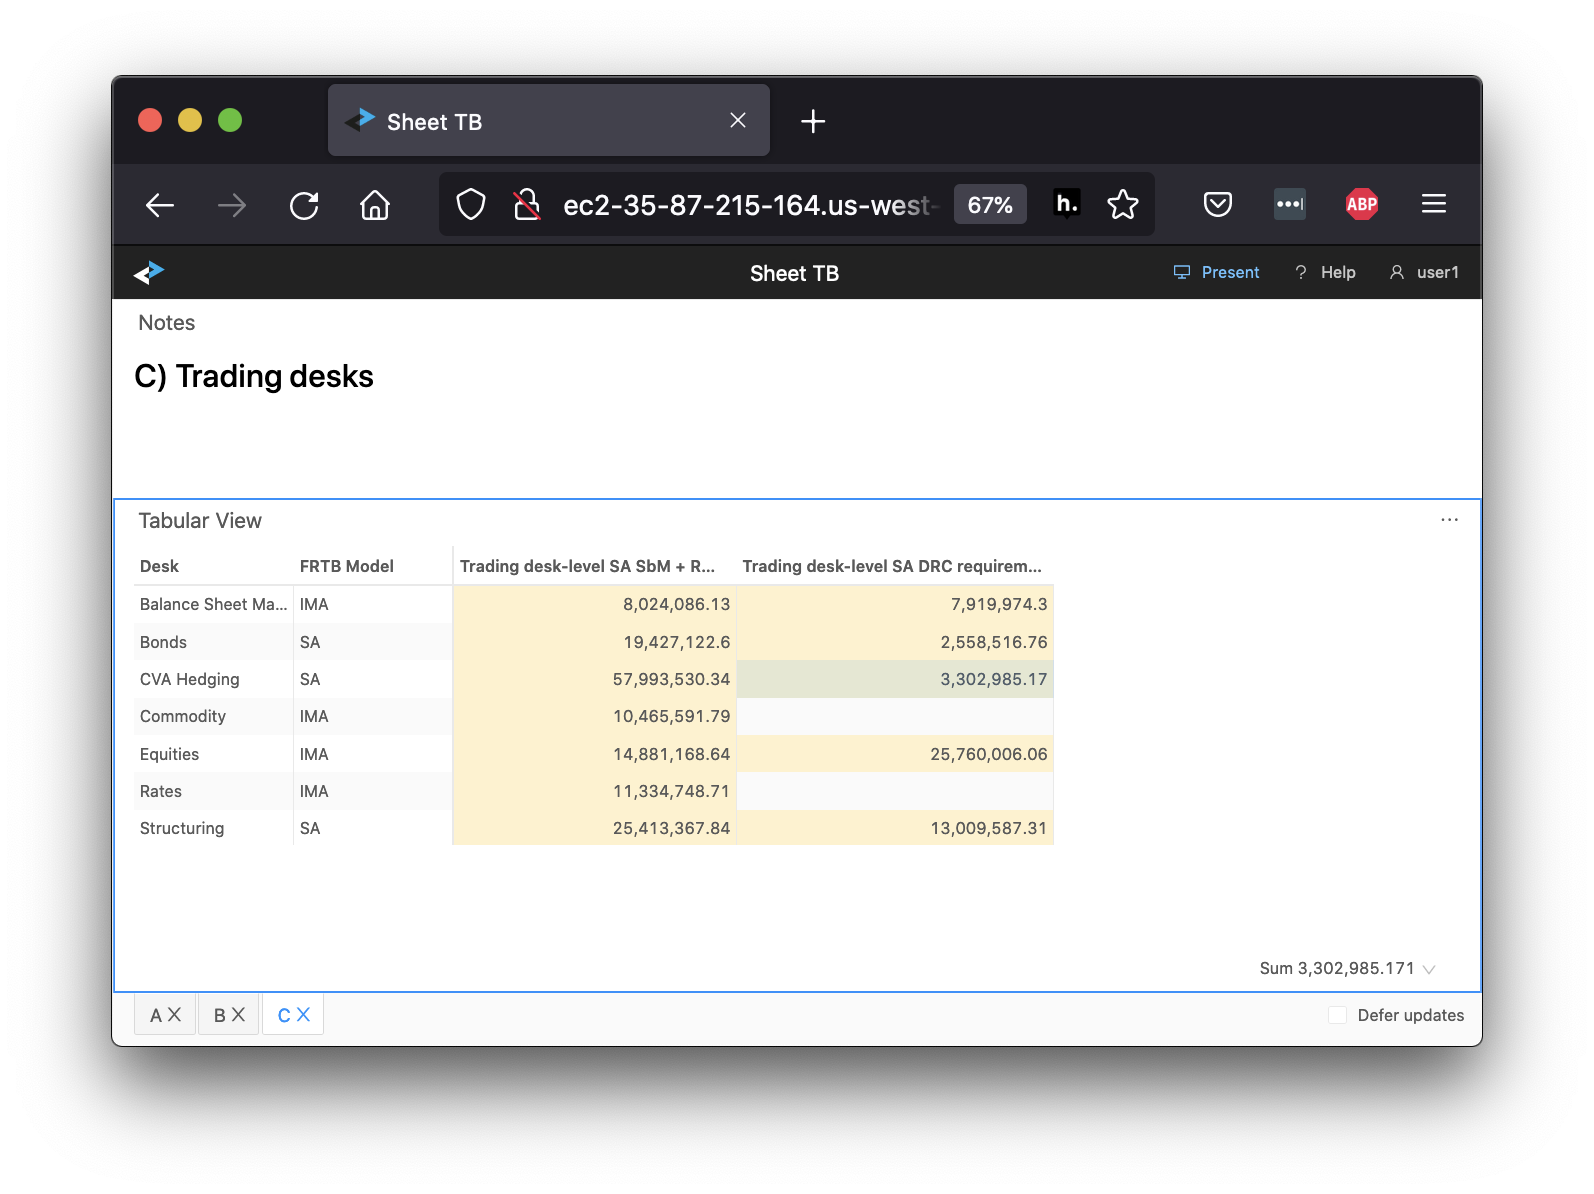
Use tab C to capture the desk-level capital numbers.
TB risk class sheet
The Sheet “TB risk class” bookmark helps you fill in the TB risk class sheet in the QIS Excel template. Each tab focuses on a specific risk class - GIRR, Equity, FX, etc. - and displays Delta, Vega, Curvature charges for different correlation scenarios, as well as total SBM charges. The last tab is dedicated to the DRC SA capital numbers.
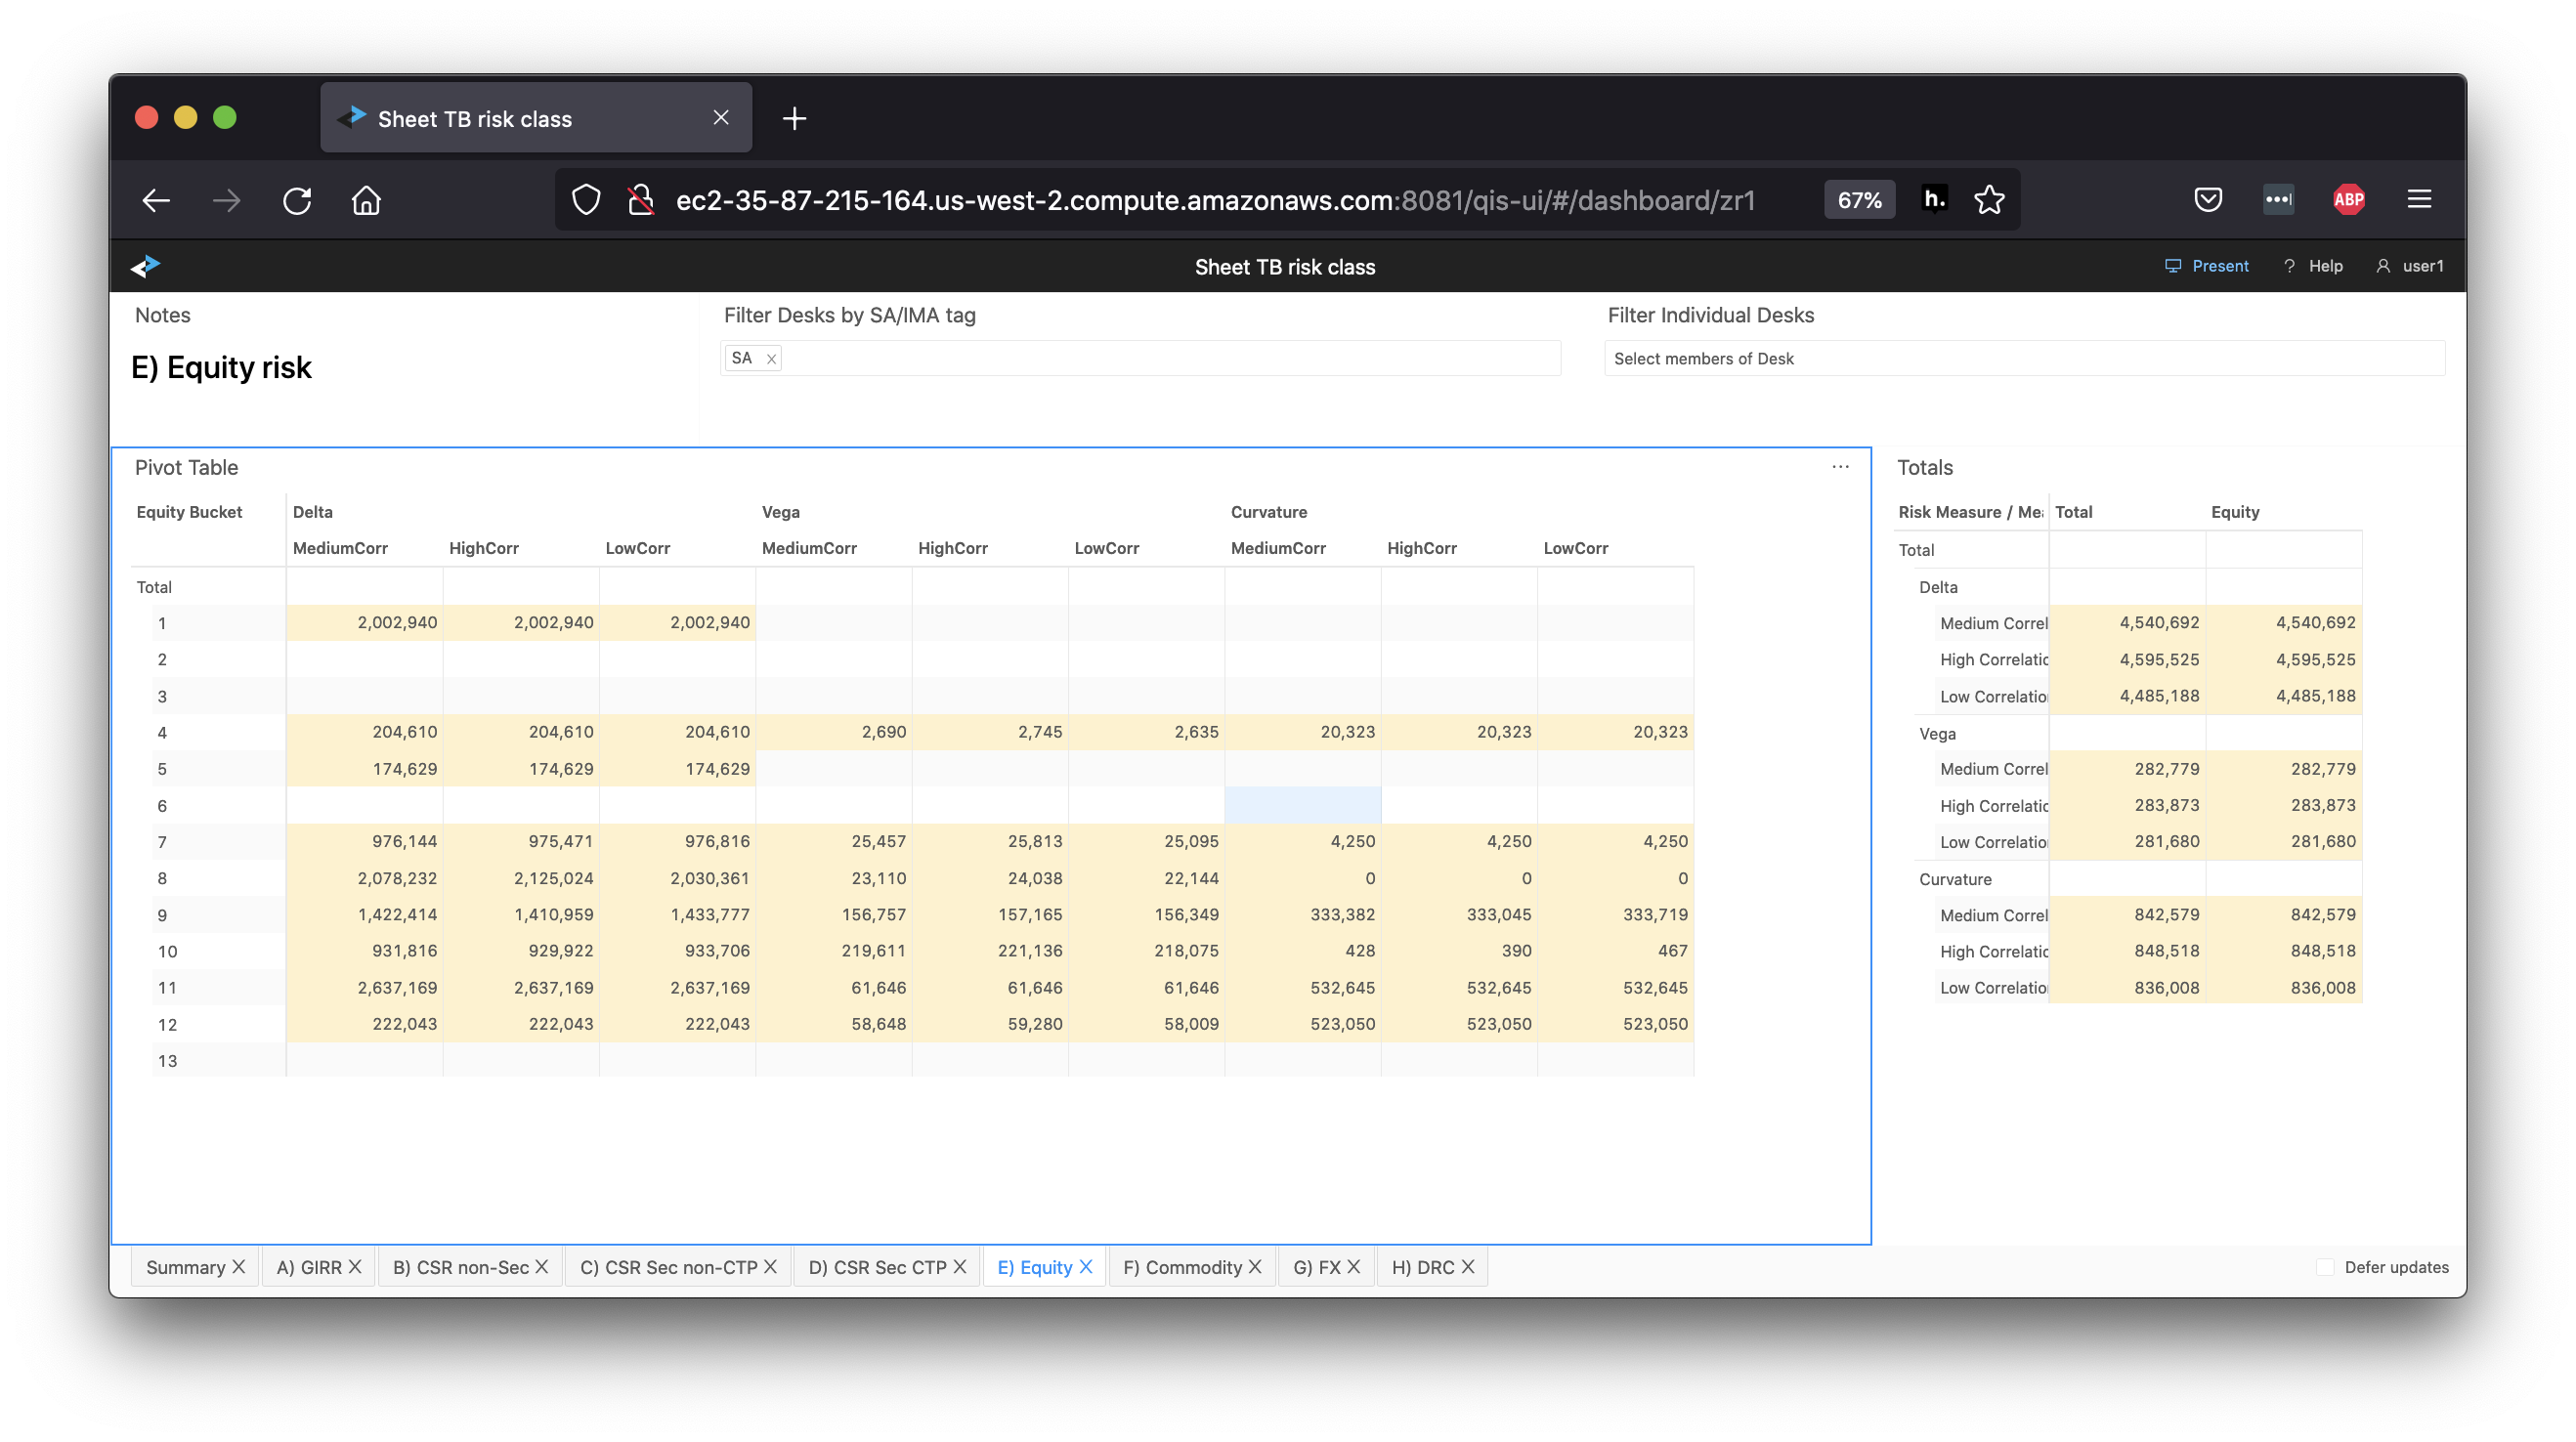
Remember to keep checking the filters so that you can interpret the numbers correctly.