Tips for Validating the Calculations
In this section, we explain how the Basel Framework bookmarks can help you to validate the calculations.
Displaying the Basel Framework bookmarks
FRTB SA QIS comes with an analytical tool and a set of pre-defined bookmarks displaying the risk metrics. Ask your IT administrator for access to the application’s URL.
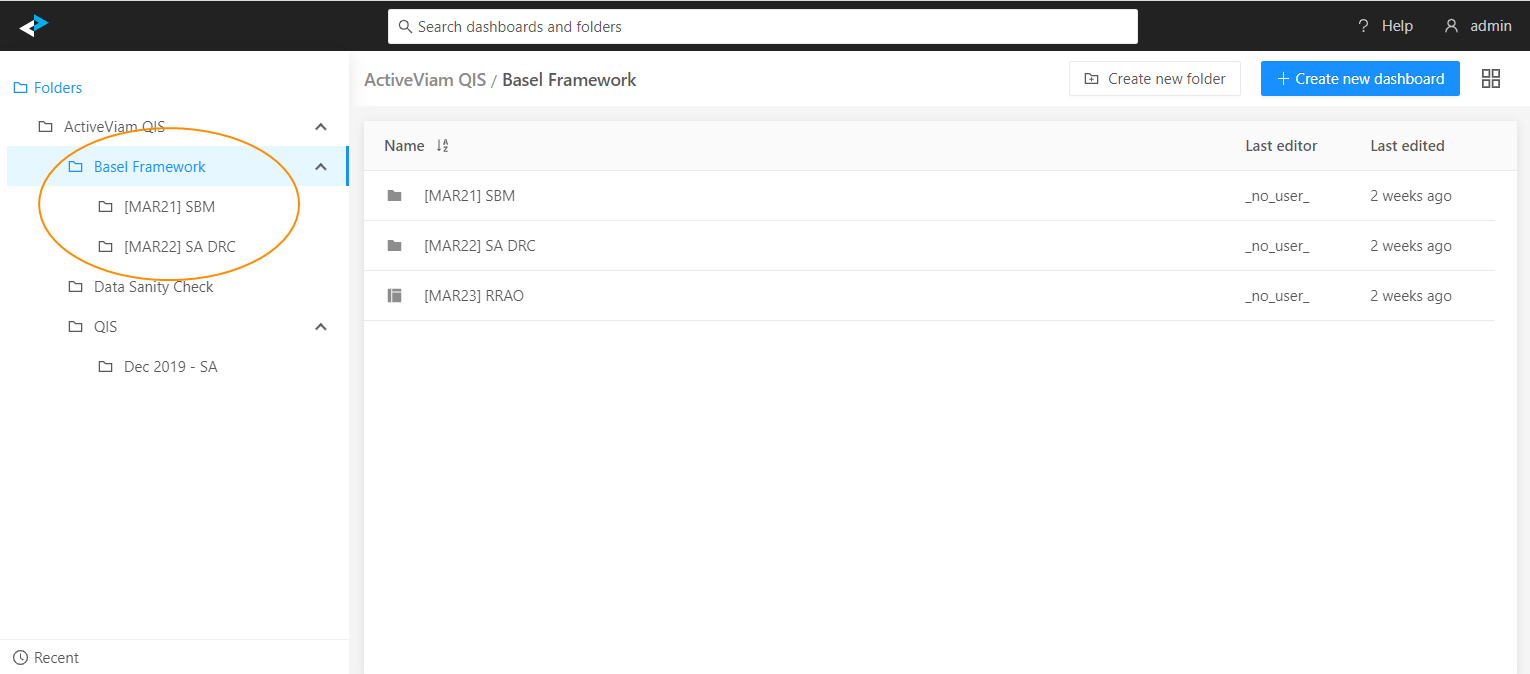
After you launch the application, click the ActiveViam icon in the top-left corner to open the Dashboards gallery. This presents the list of bookmarks available to you. In this tutorial we will talk about the Basel Framework bookmarks:

To obtain the correct capital numbers, you need to provide a complete and consistent risk data set, as well as attributes required for classification, aggregation and bucketing. Start by checking the high-level input data summary displayed in the Data Sanity Check bookmarks.
We have configured the Basel Framework bookmarks to help you navigate individual chains of the capital charge calculation, and visualize the interim results. The bookmarks are grouped according to the Consolidated Basel Framework chapters.
Let’s take a tour of the MAR21 SBM bookmarks as an example.
Example: [MAR21] SBM
Let’s review the bookmars under the [MAR21] SBM folder.
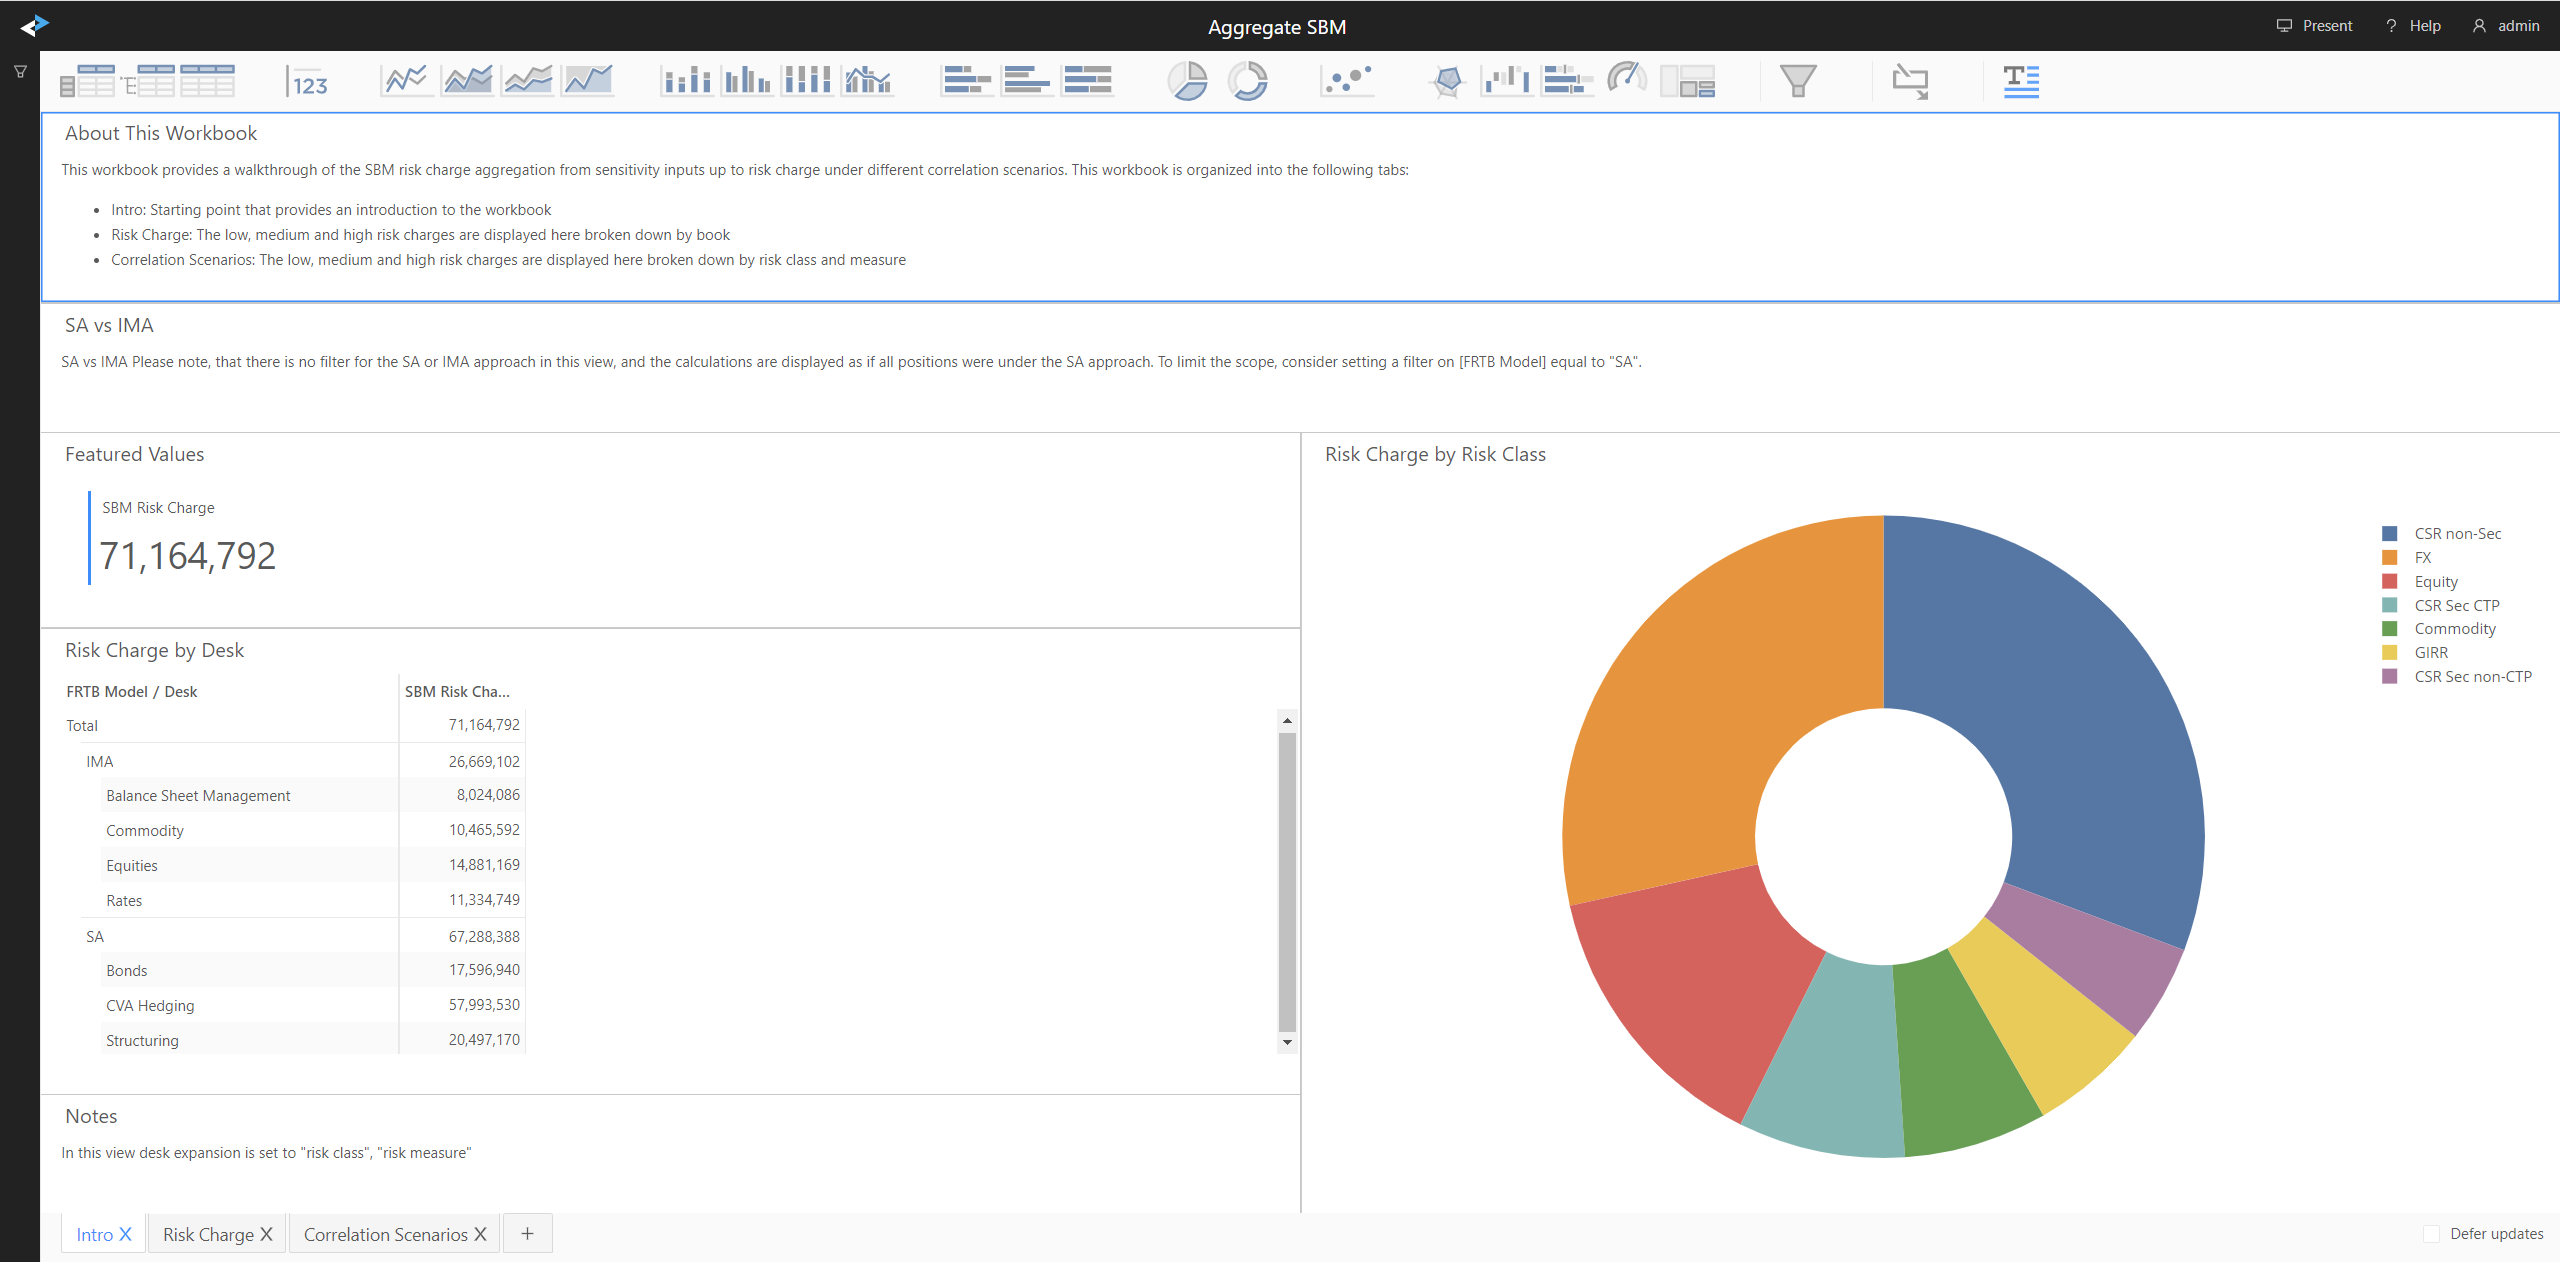
The Aggregate SBM dashboard provides a summary of the SBM risk charge by desk.

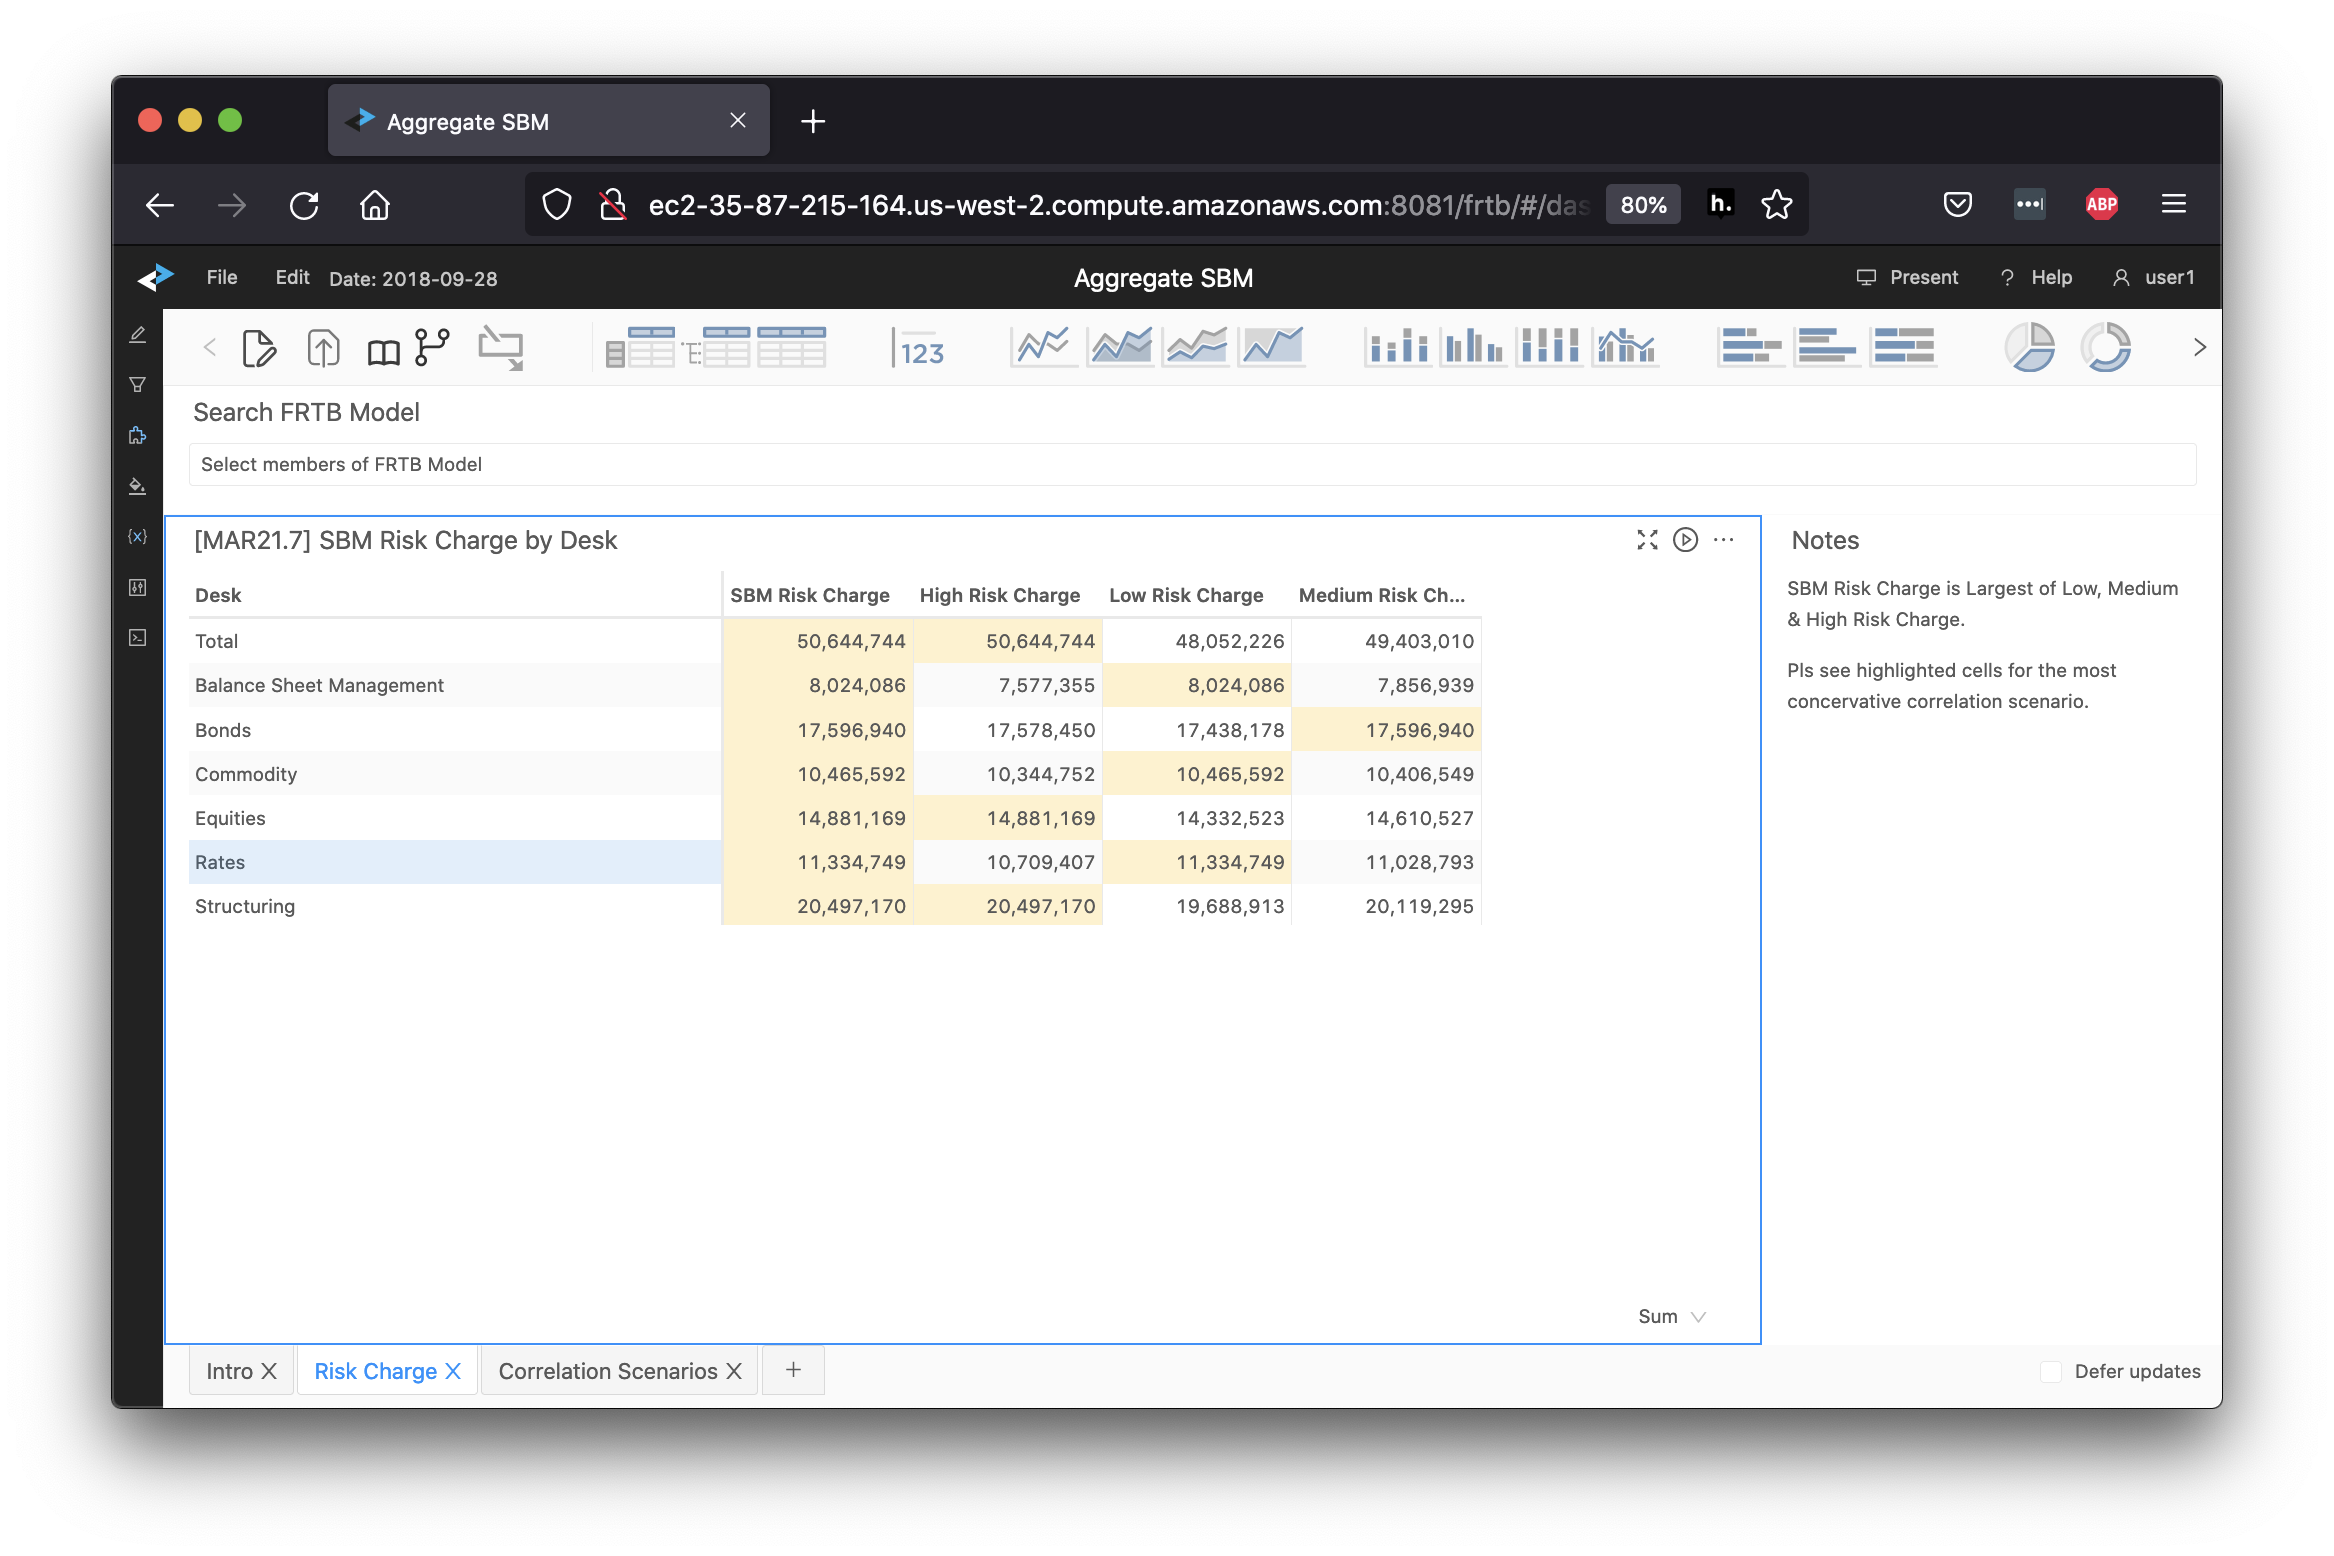
We can click on the Risk Charge tab to view high, low and medium scenario calculations by desk. When you change the filters in the view, the system automatically recalculates the capital charges.

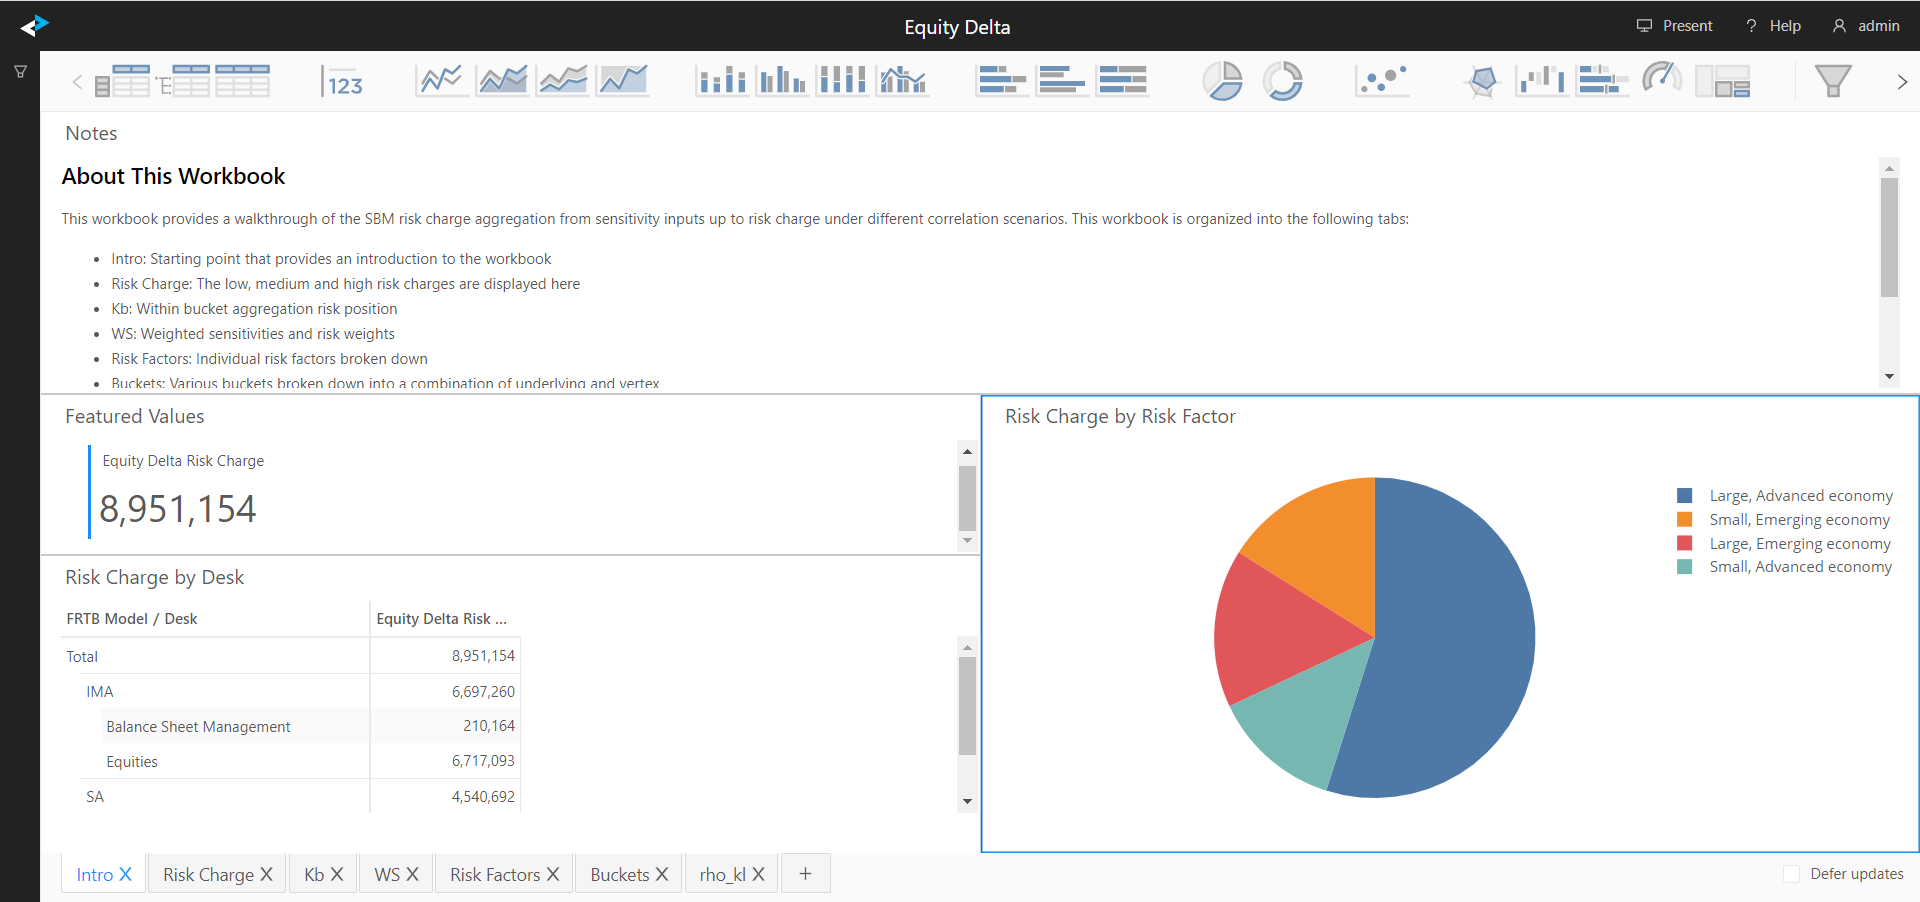
The MAR21 SBM folder contains walk-throughs of the Delta, Vega, Curvature rollup chains for each of the risk classes. Let’s look at the Equity Delta example.

By default the bookmark displays Equity Delta risk metrics across all positions. Consider setting a filter on a desired desk, book or a list of positions. For information on the filtering feature, see the Atoti UI User Documentation.
This workbook is organized into the following tabs:
| Tab | What’s displayed |
|---|---|
| Intro | Starting point that provides an introduction to the workbook |
| Risk Charge | Low, medium and high risk charges |
| Kb | Within bucket aggregation - risk position from weighted sensitivities |
| WS | Weighted sensitivities - from input sensitivities and risk weights |
| Risk Factors | Input sensitivities by the regulatory risk factor |
| Buckets | Sensitivities classified into buckets, plus the fields used in the classification process |
| rho_kl | Actual correlations for high, medium and low scenarios |
Implementation details
To learn about the data transformations, mapping and aggregation functions for each of the capital calculation chains, see the corresponding section of the Interpretation and Implementation of BCBS 457 chapter. See this example for Equity.
Measures documentation
You can also look up individual measure definitions, formulae and references, in the Measures section of the cube reference.