Status screen
Overview
The Status screen allows you to review and manage breaches and warnings, which are issued by Atoti Limits when the value of a measure exceeds a threshold specified in the limit.
Real-time updates
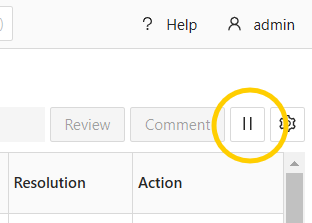
By default, evaluations on this screen are updated in real-time. You can disable/enable real-time updates by clicking the pause/play button next to the table configuration button:
note
To have more than 6 open connections for real-time updates, you must have HTTP/2 enabled.
This is a limitation of Server-sent events,
which are used to send the updates. You can enable HTTP/2 by setting the spring.http2.enabled
property to true in the application.yml file. Note that you must be using a secure connection
for this to work. Please contact your network administrator to secure your application.
Include all limit evaluations
By default, the Status screen only displays your outstanding tasks, that is, breaches and warnings that await your action. However, you can use the switch above the table to display All evaluations instead.
If your server is configured to store “passes” as well (i.e. evaluations that do not result in a breach or warning) by having set the limits.incident.evaluation.include-passes property to true,
an additional option will be present to only show Incidents and filter out the passes.
warning
Enabling this setting may pollute the Status screen with a large amount of entries, and may reduce performance.
Table columns
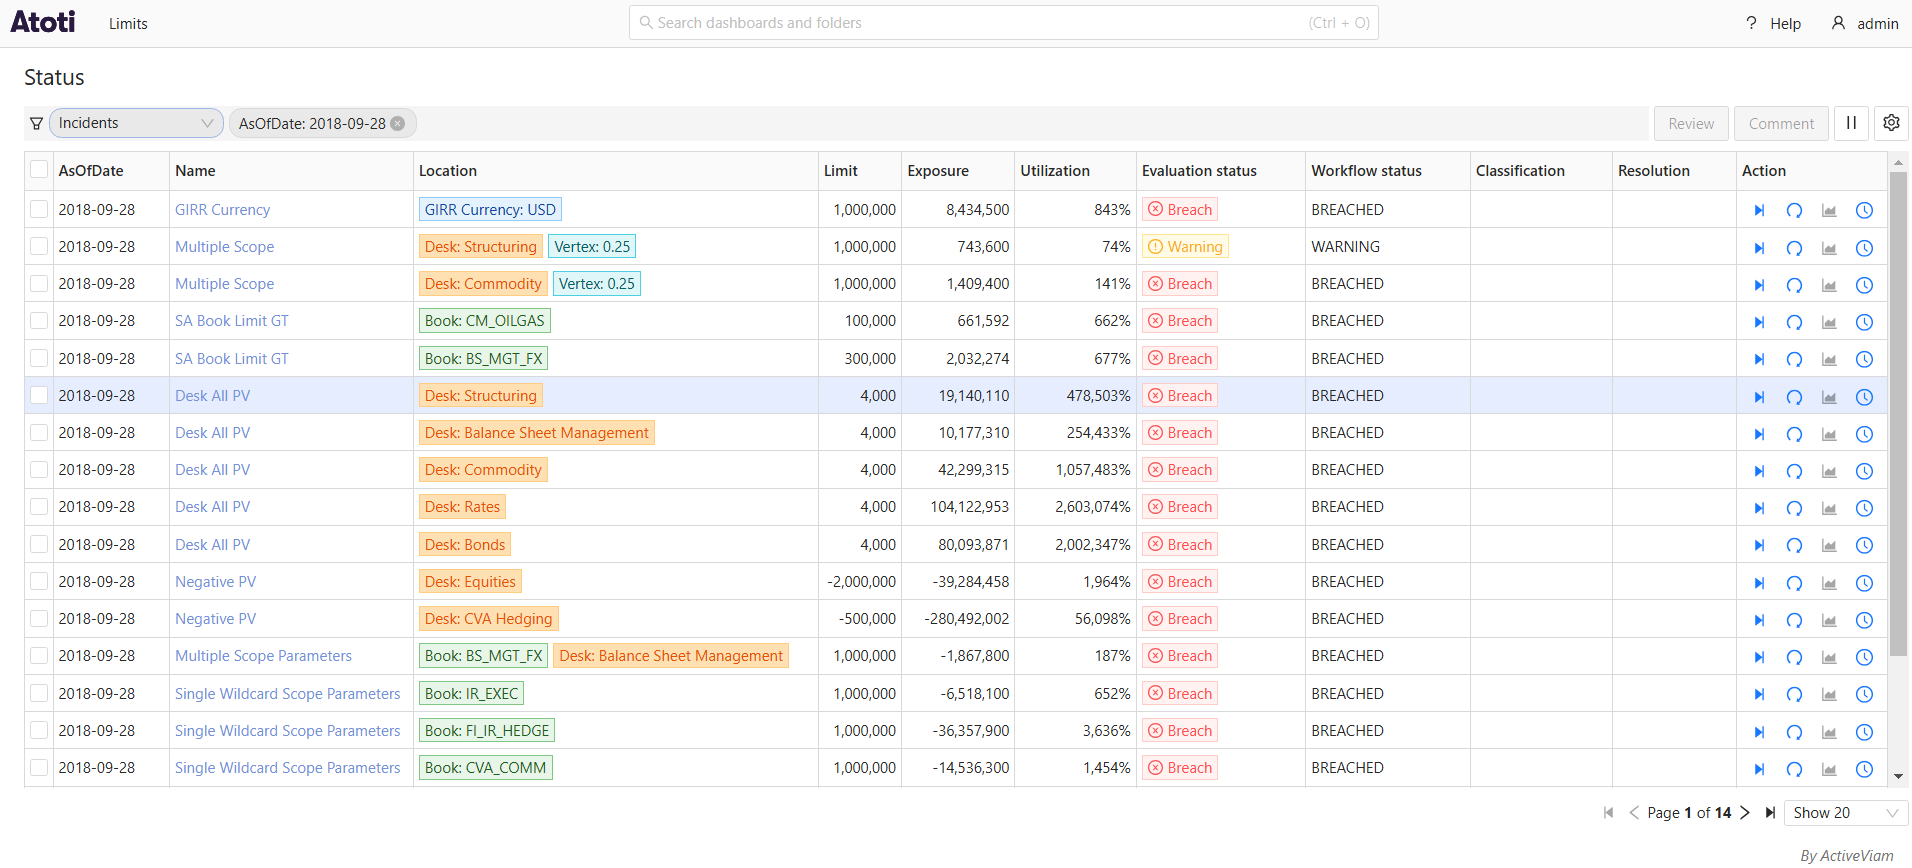
The screen contains a table displaying your breaches and warnings.
note
The image above shows two columns, Classification and Resolution, which are part of the default incidents workflow. These columns are not listed in the table below because their Field Name and Description are dynamically generated. If a customized workflow is selected during the Review Process while creating the limit structure, different columns may appear in place of or alongside these.
| Field Name | Description |
|---|---|
| AsOfDate | The AsOfDate of the incident. |
| Name | The limit’s name. |
| Location | Location in the cube where the incident occurred. For example, if the limit was defined for each book, the location displays the book with the breach. |
| Limit | The limit value, which is the threshold that was checked against. |
| Exposure | The value of the measure we are comparing the limit against. |
| Utilization | The utilization of a limit on evaluation. |
| Incident Type | Specifies whether the incident is a Warning, Breach or Pass. |
| Evaluation status | The status of the limit evaluation. |
| Action | The actions you can carry out on the entry. You can perform workflow actions on incidents, re-evaluate entries, and view any linked dashboards. When viewing linked dashboards, navigating from the status screen applies the scope and as-of-date of the limit to the linked dashboard. |
Filters
You can filter the evaluations using the column filters:
tip
Filters on this screen are saved and re-applied when you next open it.
tip
You can pre-filter the status screen by including one or more incidentIds as a query parameter in the URL. This is
especially useful for sharing direct links to outstanding tasks, such as in email notifications.
To learn about reviewing breaches and checking the Audit log, see Manage incidents.