Charts
ActiveUI uses Plotly charts for chart based data visualization.
Stock ActiveUI chart types#
ActiveUI provides the following Plotly chart types:
The above link is for Clustered columns.
To get clustered bars you must add "orientation: 'h'"to each trace and swap the "x" and "y" axes.
warning
Because charts are plugins, your applicatication may have none, some, or all of the above chart types.
If you cannot find a specific chart type in your Widgets ribbon, it is likely because it was left out intentionally.
Horizontal and vertical subplots#
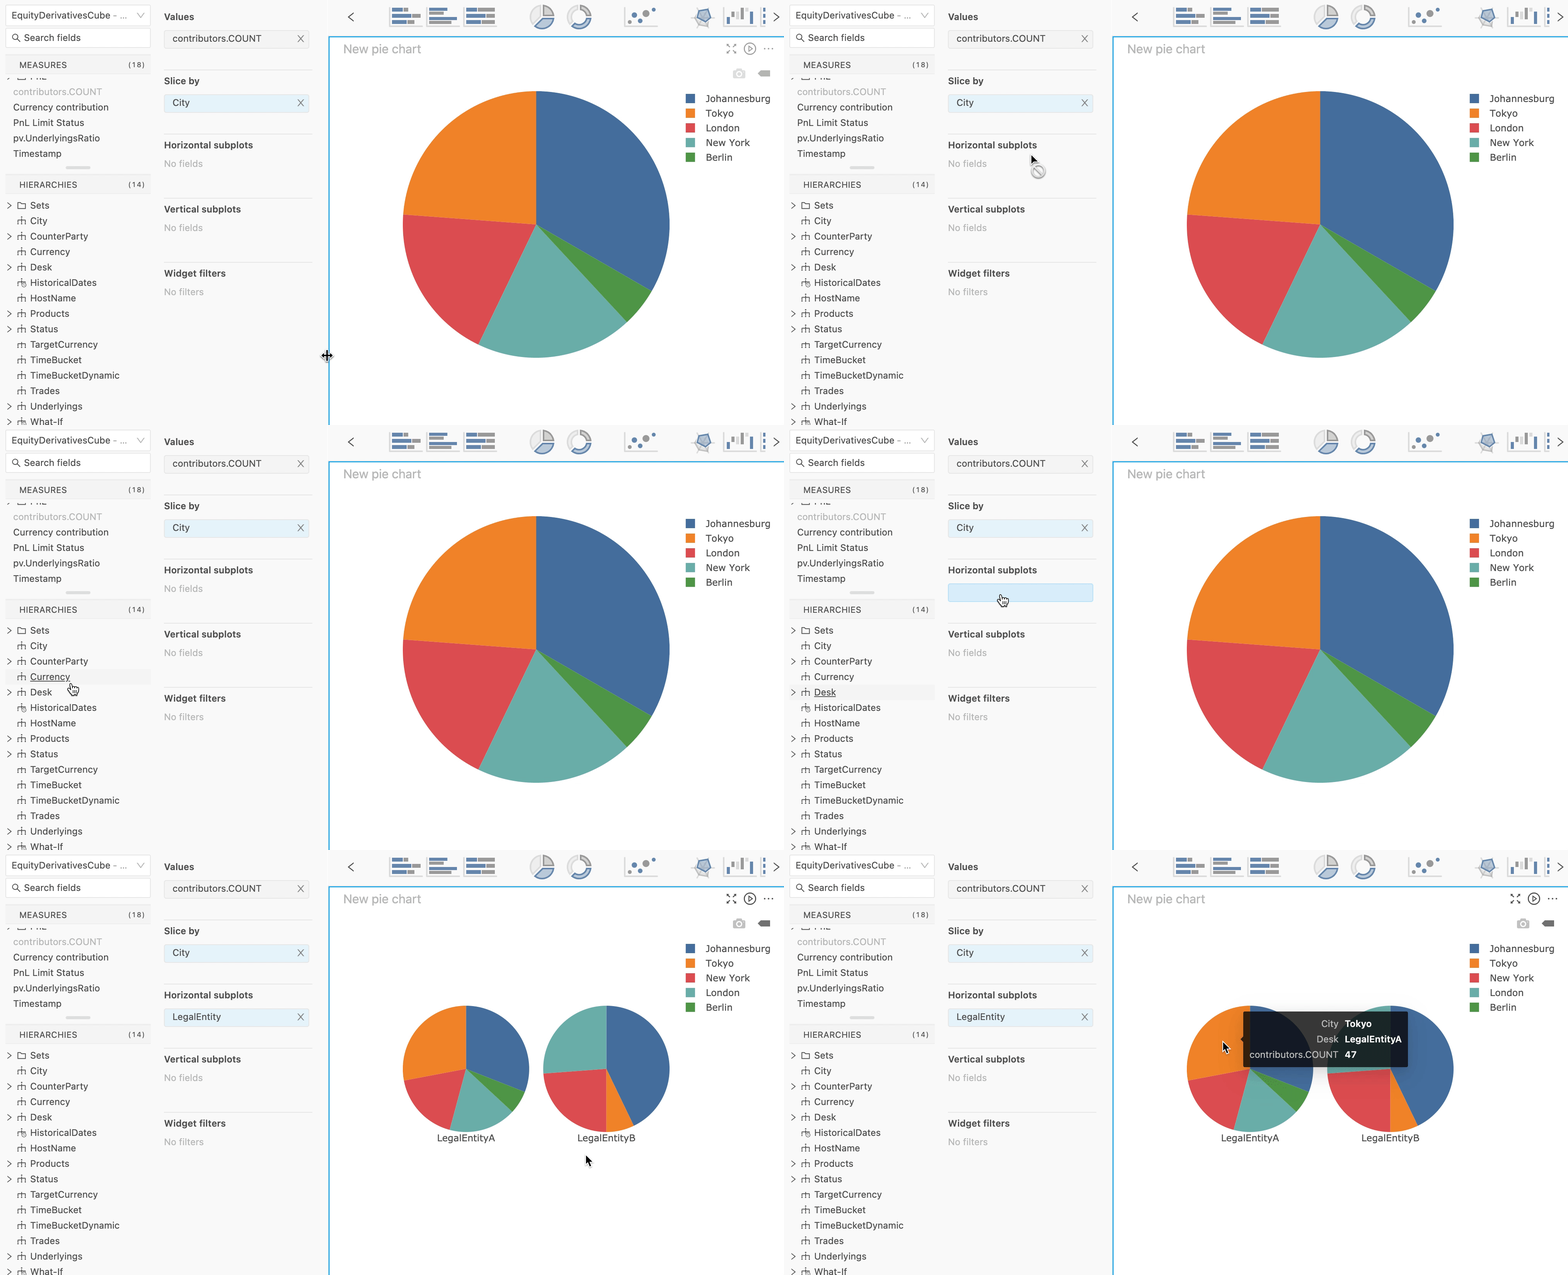
Subplots (also known as facet plots or trellis plots) are groups of mini charts with a common scale and axes.
Each subplot represents a different item from a selected dimension.
Create subplots#
To break a chart out into subplots:
- Add a hierarchy in the Horizontal subplots and/or Vertical subplots Content editor sections.
