Querying ActivePivot : Business Front-ends
The preferred User Interface for ActivePivot is ActiveUI, a dedicated front-end that we build alongside with ActivePivot.
We acknowledge that not all ActivePivot users want to use ActiveUI, especially users already used to manipulating data with another UI. We provide a non-exhaustive list of compatible front-ends.
ActiveUI
ActiveUI is our homegrown Graphical User Interface for analytics. It is the front-end included in atoti and Atoti+. It is the solution we recommend, since it is the only front-end specifically designed to leverage all ActivePivot features, for example context values or real-time.
We continually test ActiveUI against all new ActivePivot developments, and the ActiveUI features are designed with ActivePivot users in mind. A default ActiveUI application is provided with the ActivePivot sandbox project.
Have a look at ActiveUI documentation.
Microsoft Excel
Microsoft Excel communicates seamlessly with ActivePivot by way of the XMLA protocol, without the need to install any add-ons.
Excel on ActivePivot supports the same set of functionalities as Excel on Microsoft SQL Server Analysis Services 2008.
For each new ActivePivot release, we test queries on the sandbox project from Microsoft Excel, thus making sure we stay compatible.
Connecting to an ActivePivot Cube in Excel via the MSOLAP Data Provider
The MSOLAP data provider is also referenced in other articles as the MSAS driver since it is designed to connect to a Microsoft SQL Server Analysis Services server.
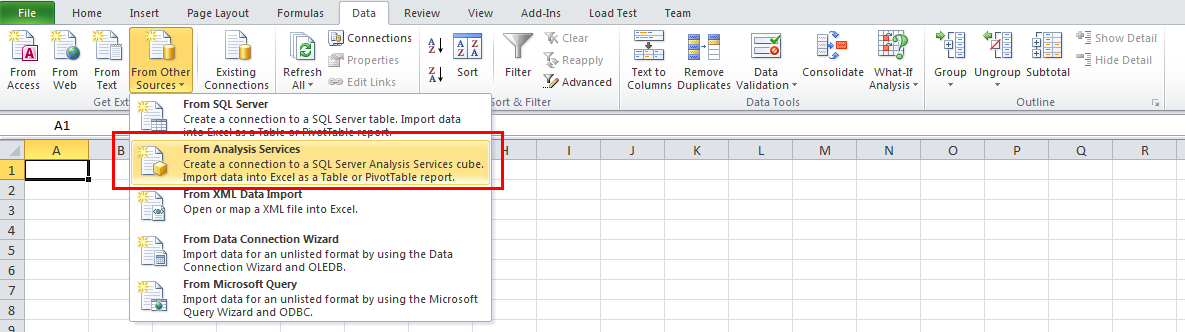
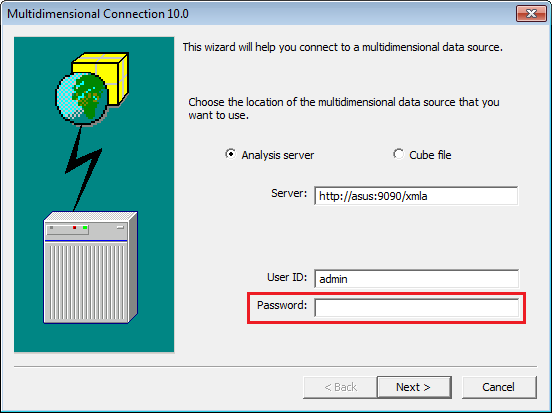
Here are the steps to configure a connection using the MSOLAP 10.0 data provider, including steps related to security configuration. The screen captures are made with Excel 2010. First, open the data tab in Excel and choose to connect to a MSAS server:
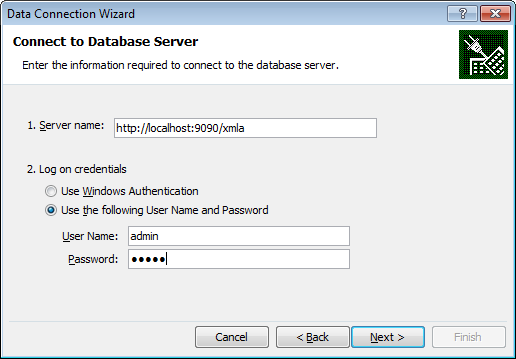
Then enter the connection informations and hit next:
 In this example,
 http://localhost:9090 is the host an port where the ActivePivot server is running
(defaults of the ActivePivot sandbox project) and /xmla is the path to the XMLA service on the
ActivePivot server, with which Excel will communicate.
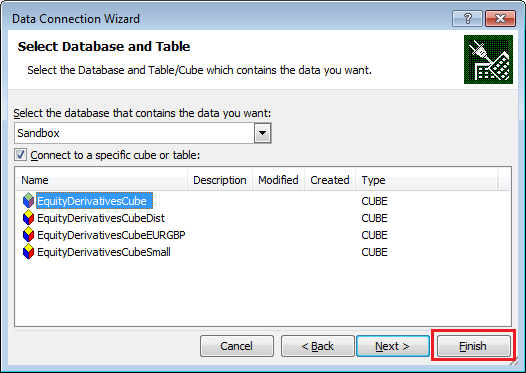
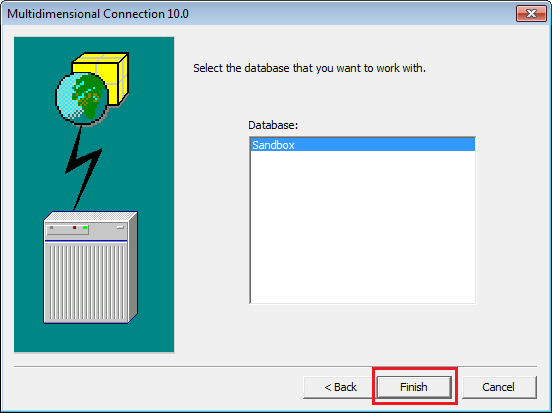
You are then prompted to choose the catalog (called database in this window), here we choose
Sandbox, and then the cube:
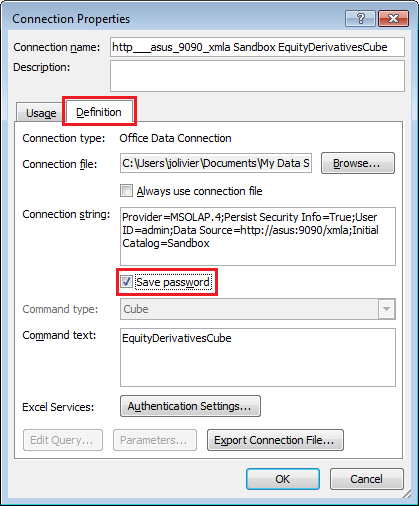
Excel is now asking where to place the pivot table, and here we can change the properties of the
connection when choosing the Properties... button:
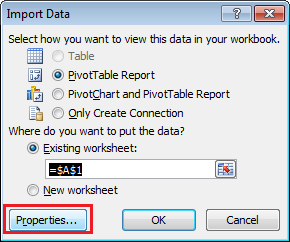
Here we ask Excel to remember the password in the connection file it will create. Of course this is an optional step, you may want to be asked the password at every connection for obvious security reasons. The sandbox project has hardcoded credentials and does not hold sensitive data, so we go for the easiest route. Often on a "real" project, SSO will be enabled and thus you can reuse your windows credentials.
Other parameters of the connections can be changed in this window too:
Then Excel asks for the password again:
After having entered the password that will be saved in the connection file, we can again choose the
catalog we want to connect to, we hit Finish.
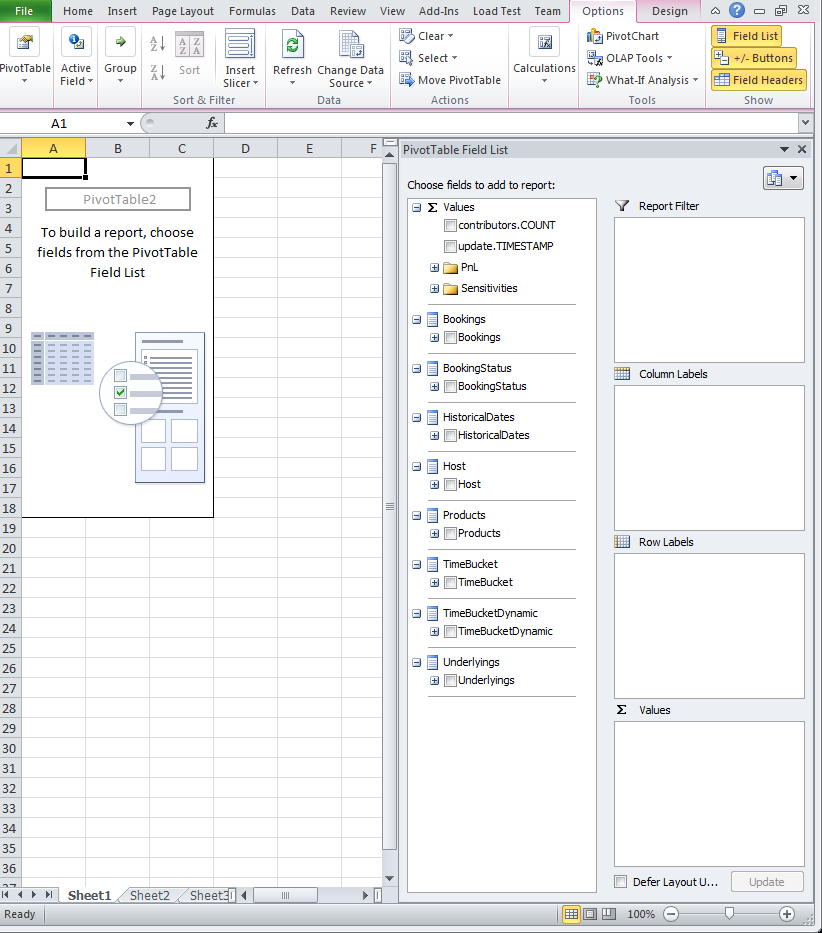
That's done! An empty pivot table appears on Excel, and you can choose the fields to add to it:
Tableau
Tableau is probably one of the most well-known front-ends for business analytics. Several of our customers use it as a front-end for ActivePivot.
Connecting to an ActivePivot Cube from Tableau
The screenshots are from Tableau 2018.2. Start Tableau and click on Microsoft Analysis Services.
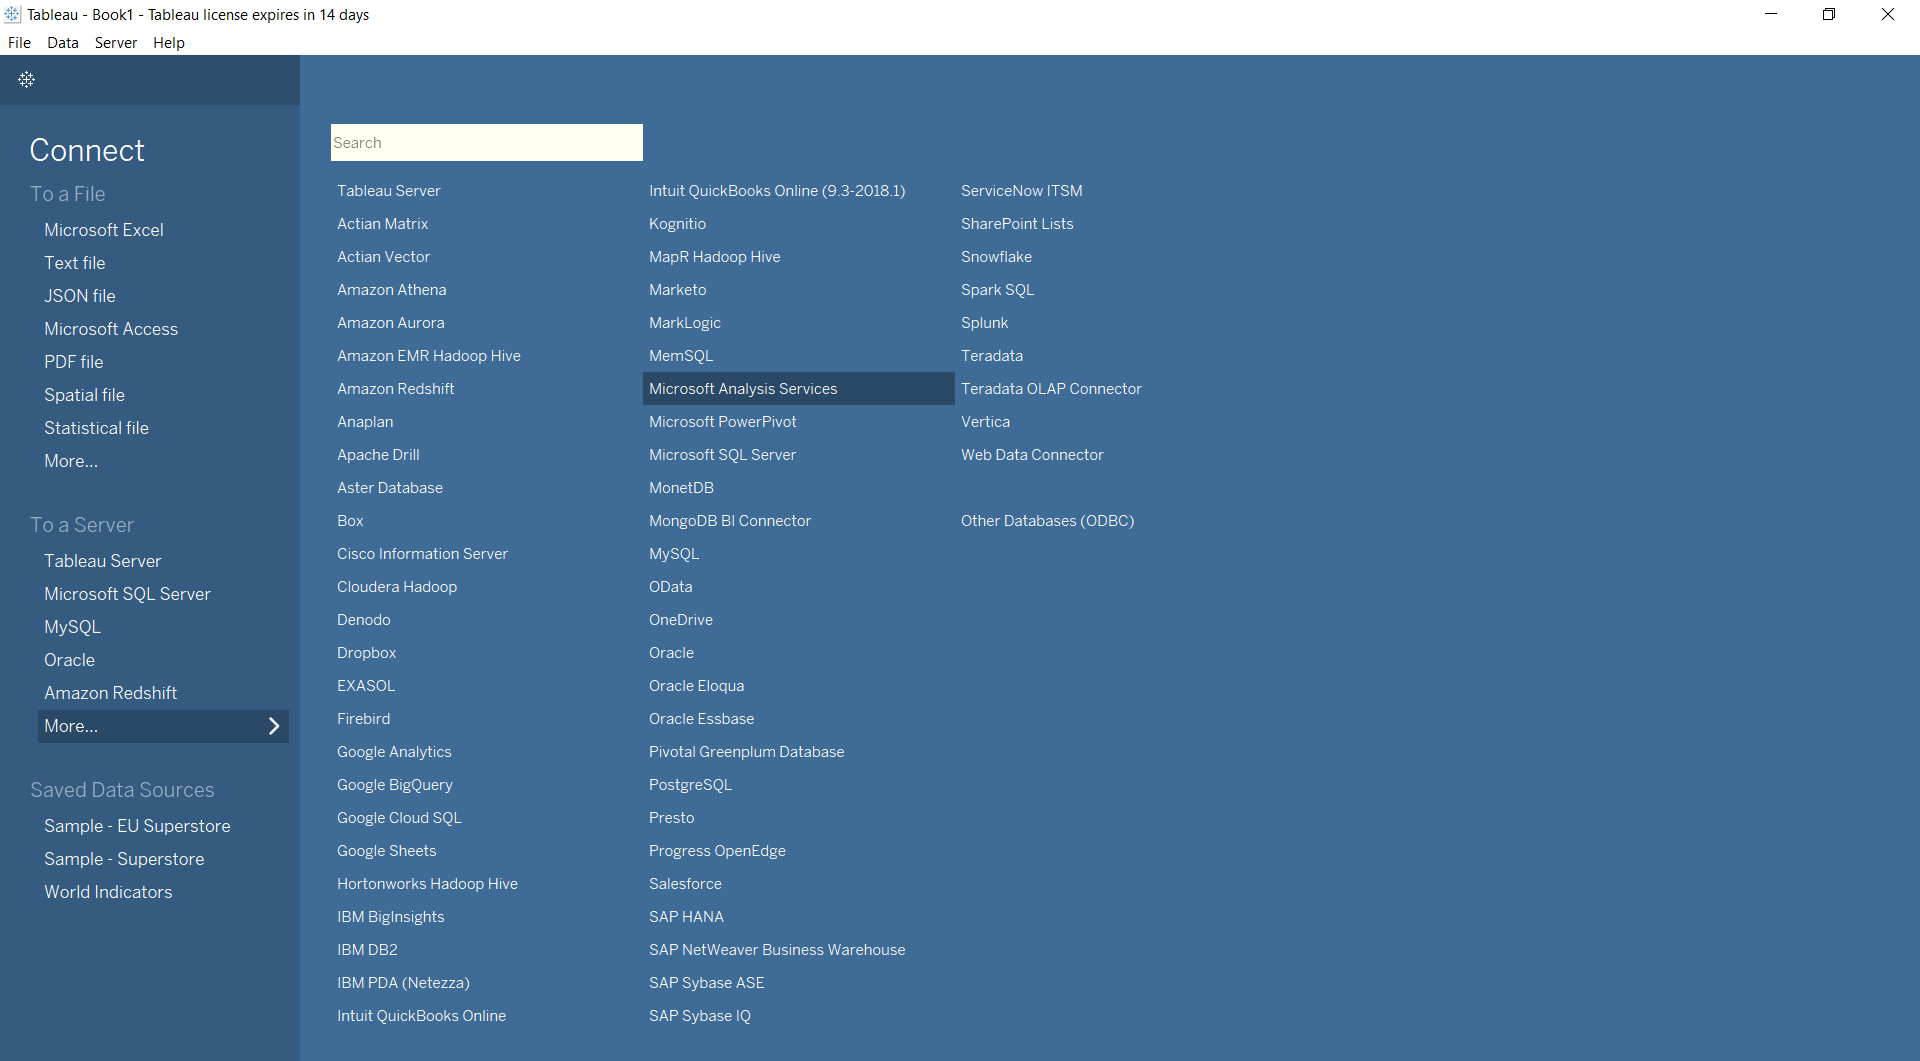
If you are unable to see Microsoft Analysis Services in the list, please install drivers for 2014 SP1 (version 12.0.2000.8) from Tableau's Driver Download page.
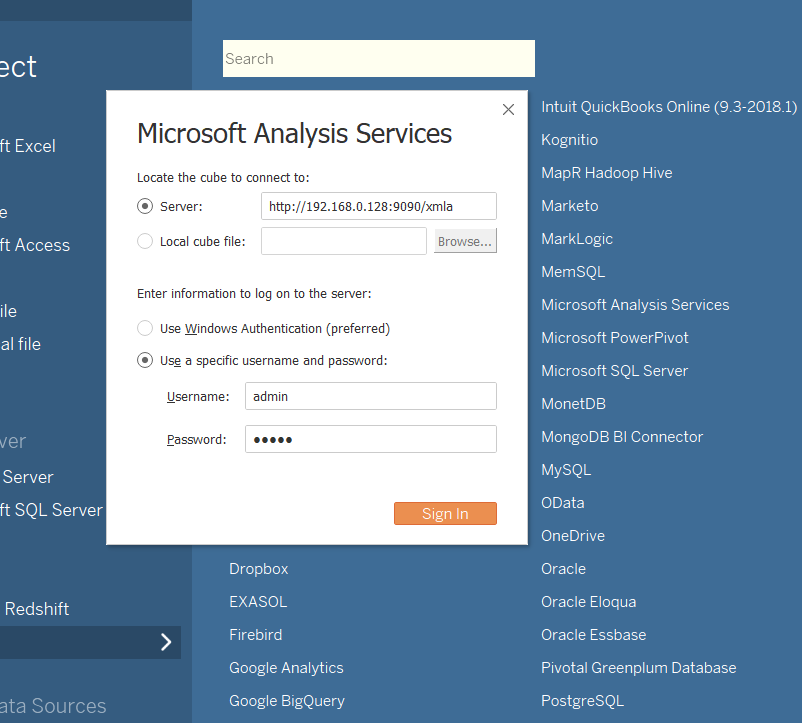
Enter the ActivePivot server address (do not forget the /xmlathat gives access to the XMLA servlet
which simulates a Microsoft Analysis Services answering Tableau's requests), and your
username/password as configured in ActivePivot.
Once you are able to connect, you will see the Cubes as below:
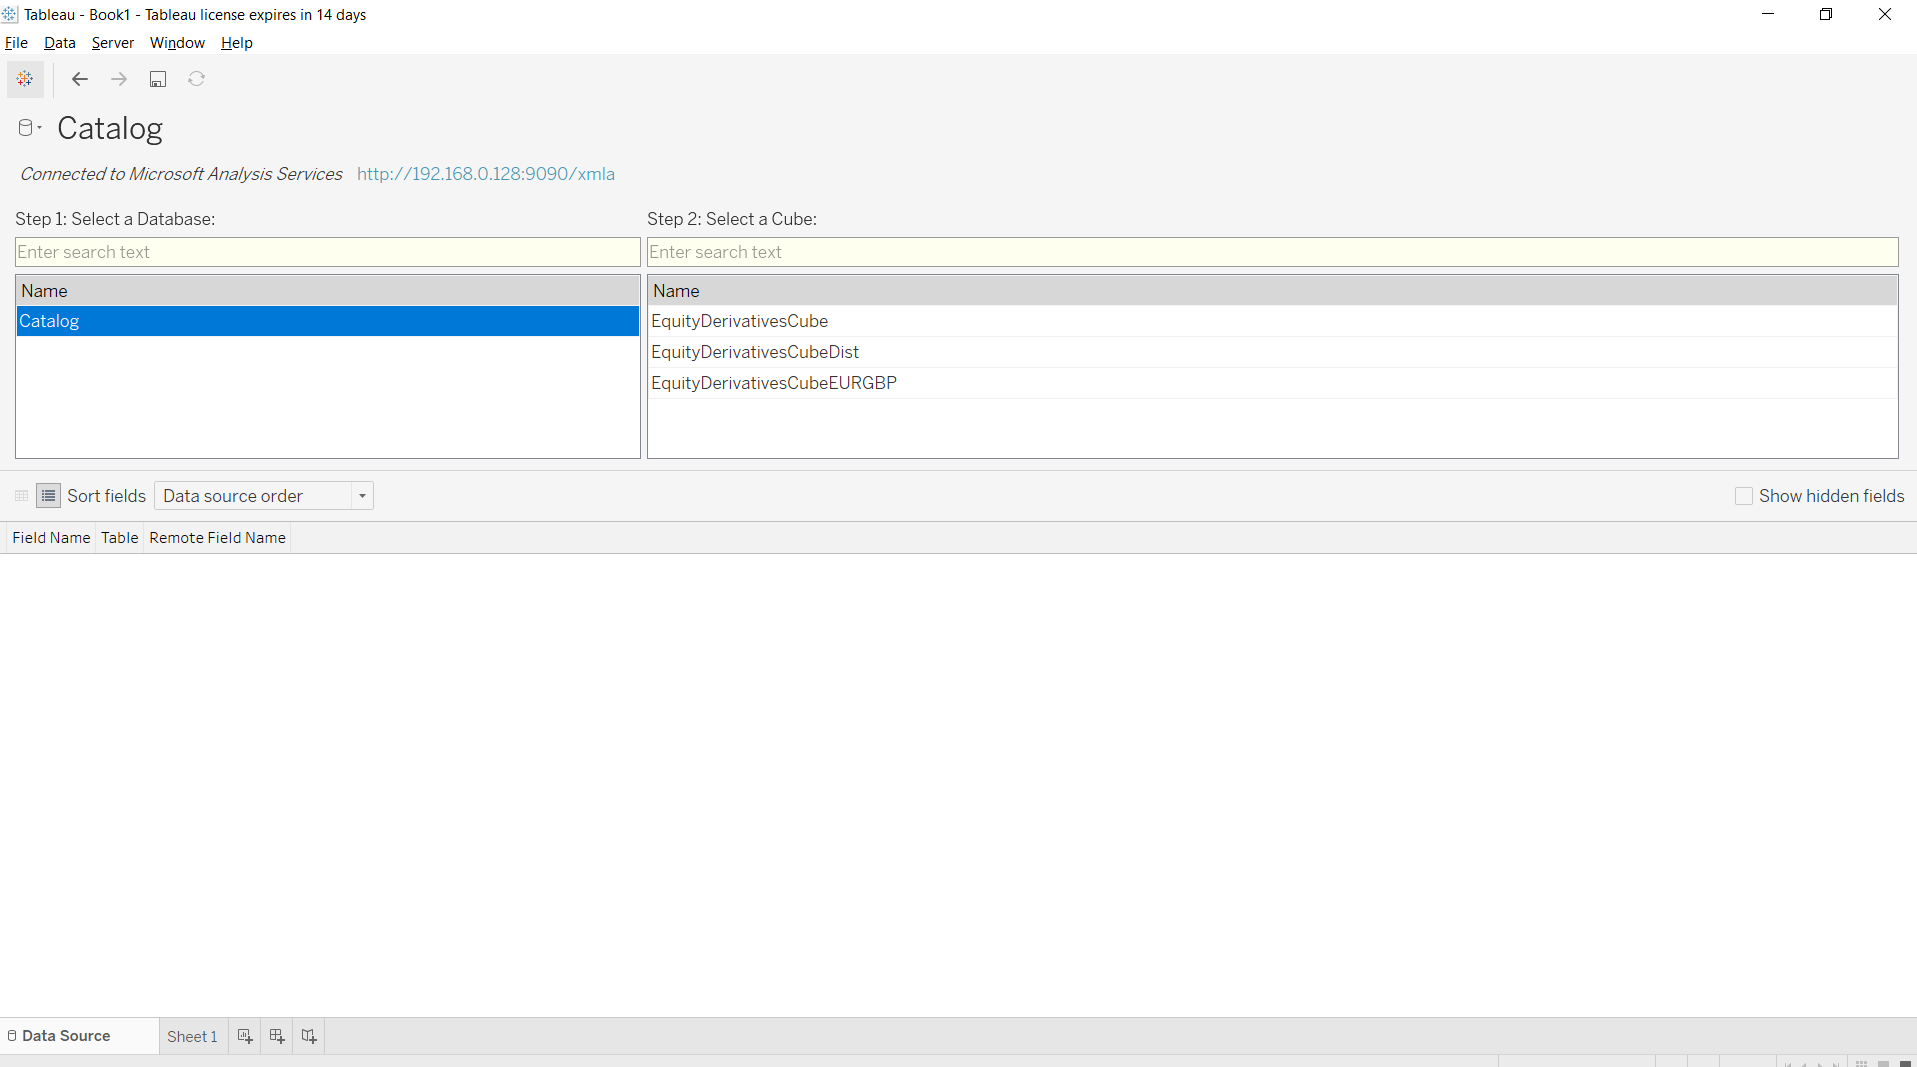
Select the Cube you are interested in, it will then show the dimensions and measures:
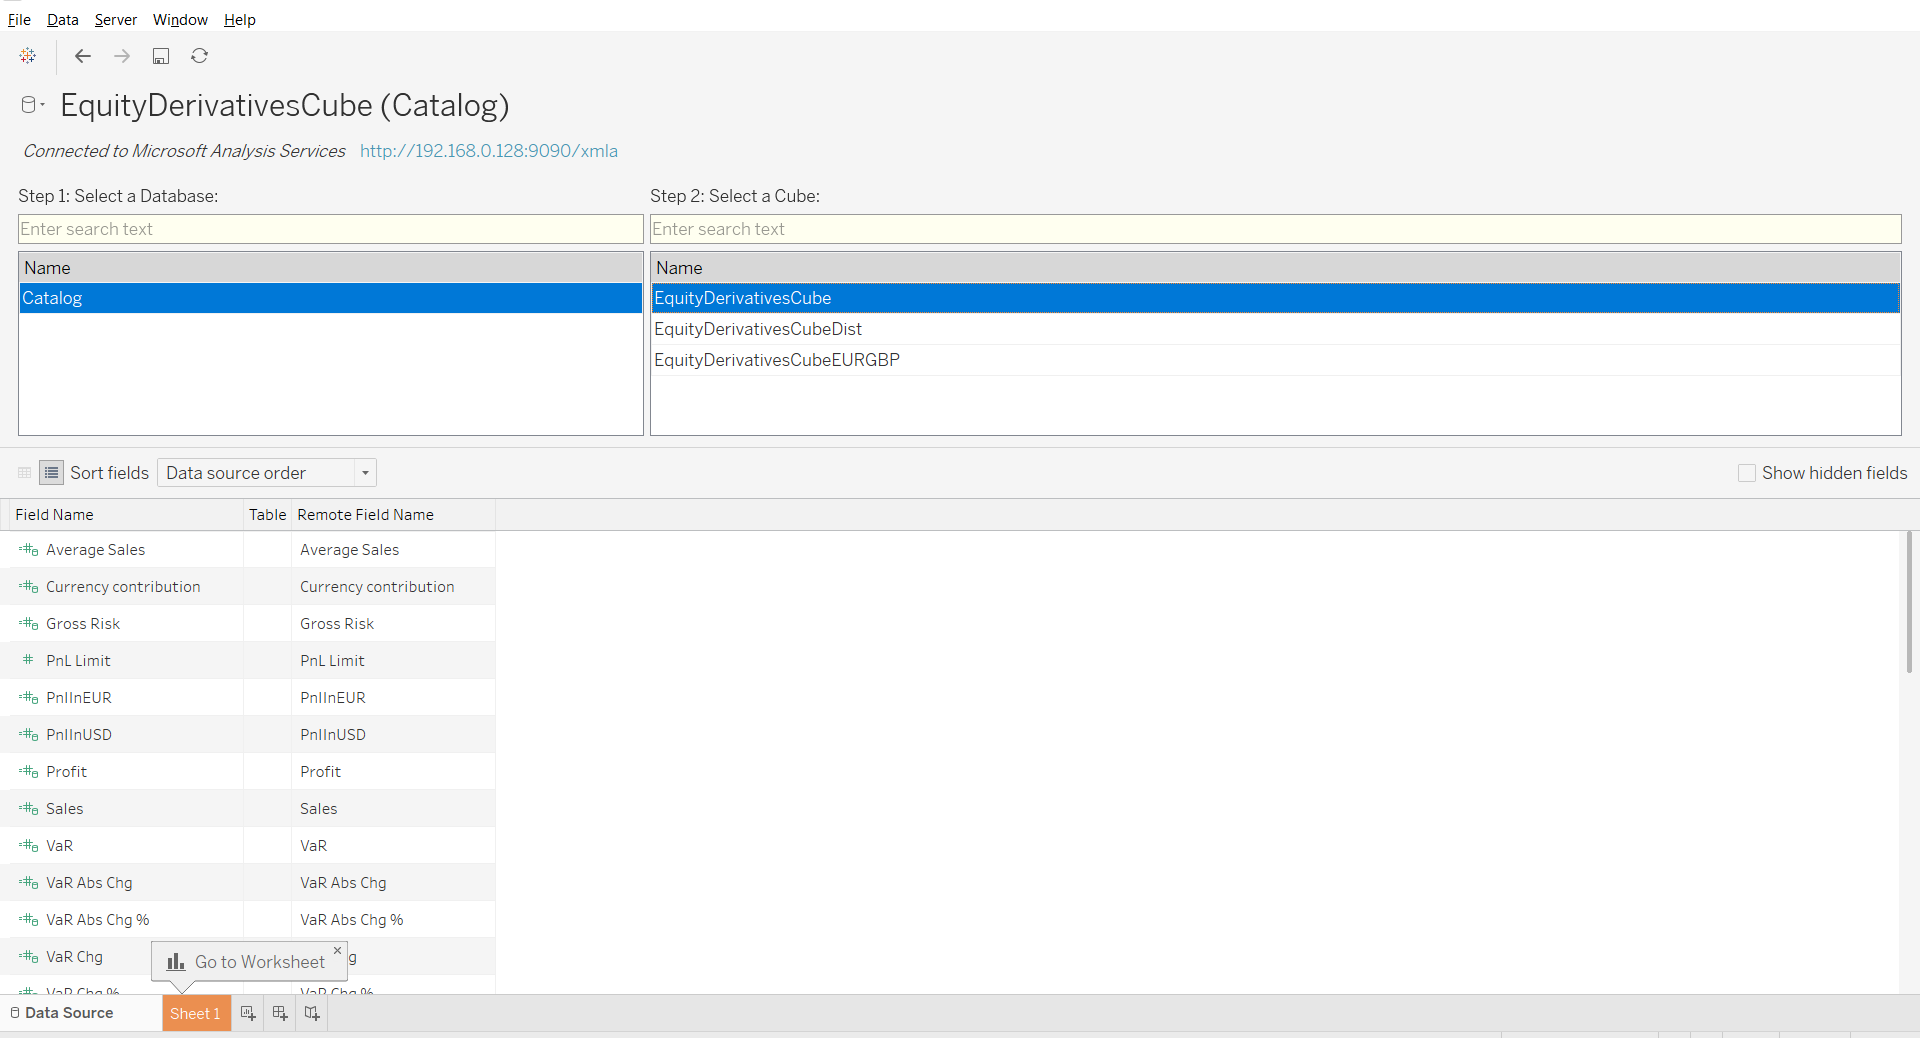
Once you have selected dimensions and measures to display, you have your pivot table!
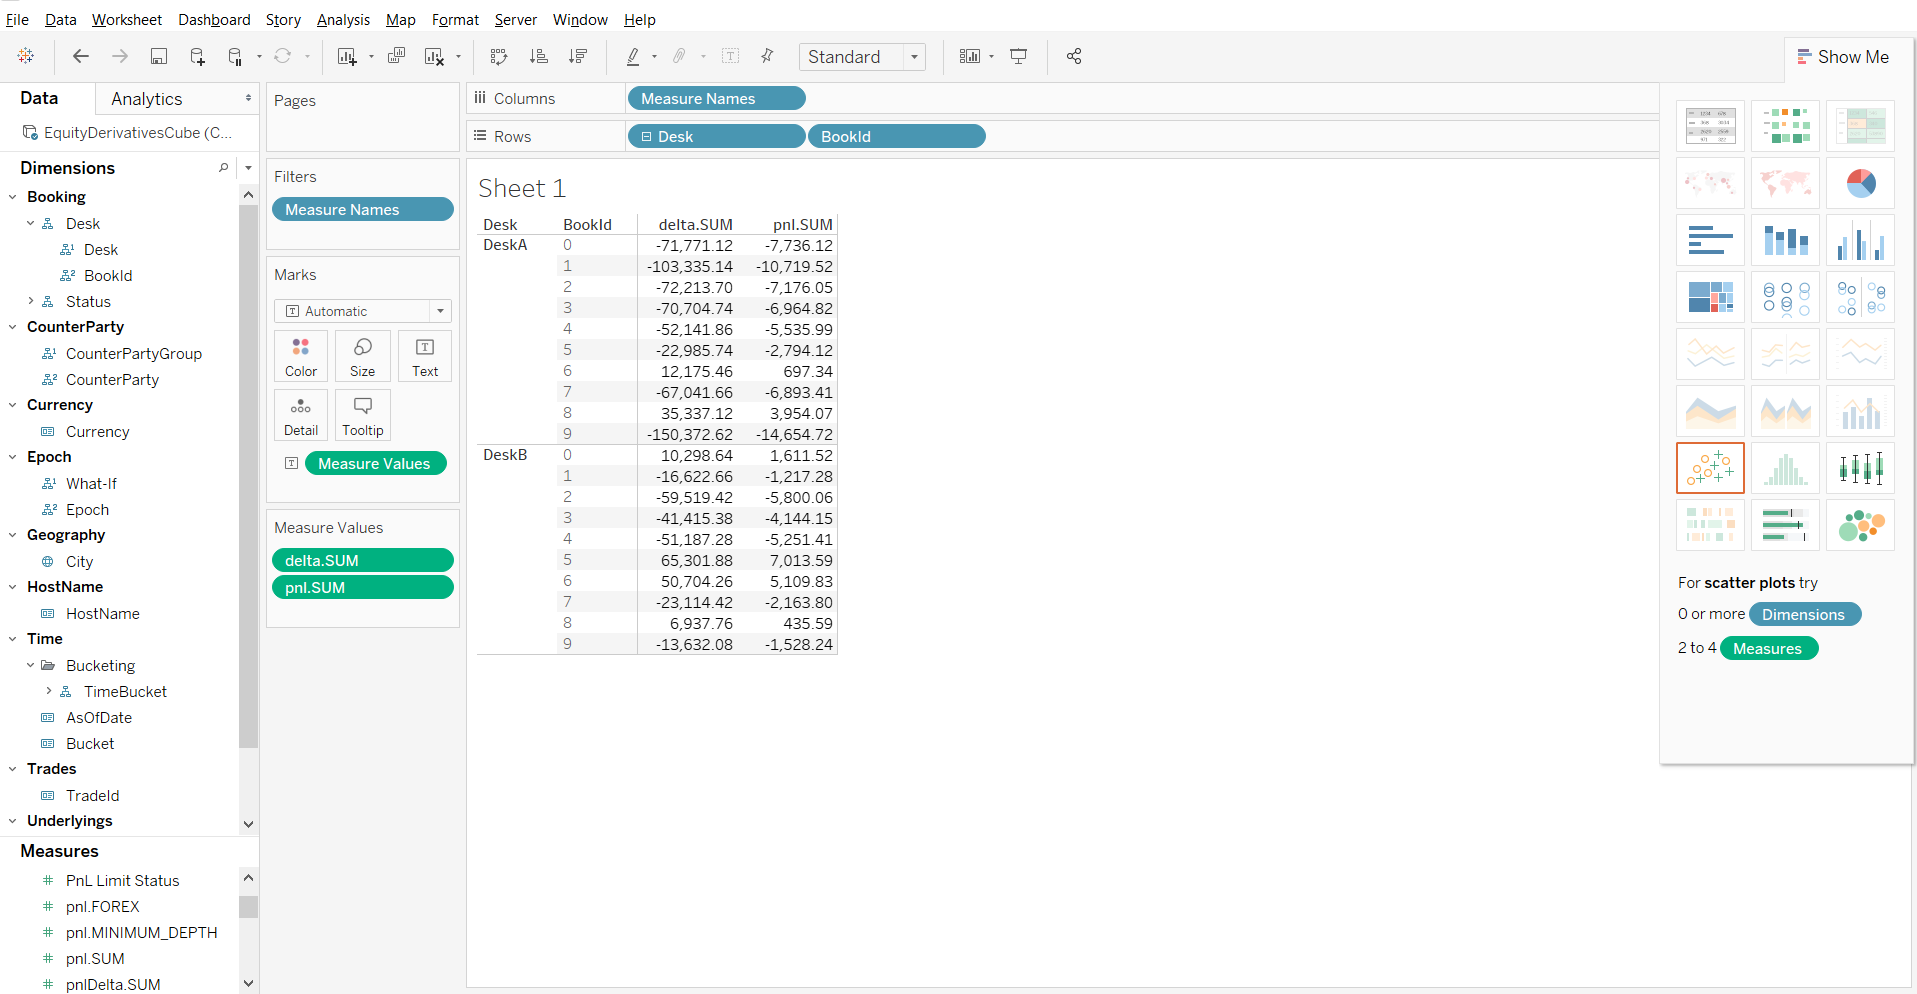
You can now create your charts and reports with Tableau using data from ActivePivot.
How to Convert a Field from String to Date
It is a known issue that sometimes Date fields are shown as Strings in Tableau.
- Change the data type of the field, changing it from String to Date
- If your dates are not recognized (and shown as null in the data view), revert the data type to
String and create a calculated member. A calculated member is an MDX expression that will be
evaluated during query.
From the Dimensions panel, select Calculated Members and create a new one. Choose a name, make sure to select Date as its result type and write the MDX expression using the `cdate`function. As an example, the MDX formula to use to transform the date field "AsOfDate" on the " HistoricalDates" from the "Time" dimension is ```cdate([Time].[HistoricalDates].CurrentMember.MemberValue)```.
Microsoft PowerBI
PowerBI itself does not support multidimensional datasources. It does not let end users explore cubes interactively, like they can with a tabular datasource supporting the DirectQuery feature. But on the other hand you can import data from an ActivePivot cube into PowerBI and use this data to create dashboards.
A primitive method for doing that is to export the output of a query into a CSV file, and load this CSV file into PowerBI. It always works. If you only have access to ActivePivot without the atoti Python library, that's what you have to do.
However if you have atoti or Atoti+, then you have the atoti Python library on top of the ActivePivot analytics engine. Here we're looking at an online technique that does not require to transfer files and that supports data refresh: we'll be using the atoti client Python library within the PowerBI Python connector.
Connecting to atoti or Atoti+ in PowerBI using Python script
Prerequisites are to have Python 3.8+ (64 bit) installed, to have PowerBI configured for running Python scripts, and to have the atoti Python library installed. In case several Python environments are installed on the machine, then atoti must of course be installed in the environment referenced in the PowerBI configuration.
To create our sample atoti cube let's use
the atoti tutorial. After running the first few cells
of the first tutorial notebook we have a cube called "Sales" with a few hierarchies and measures,
we're going to use this cube for our experiment. We need to record the port of this cube (that we get
by evaluating session.port in the notebook) for later use.
In PowerBI we open the Get Data wizard and select the Python script option.
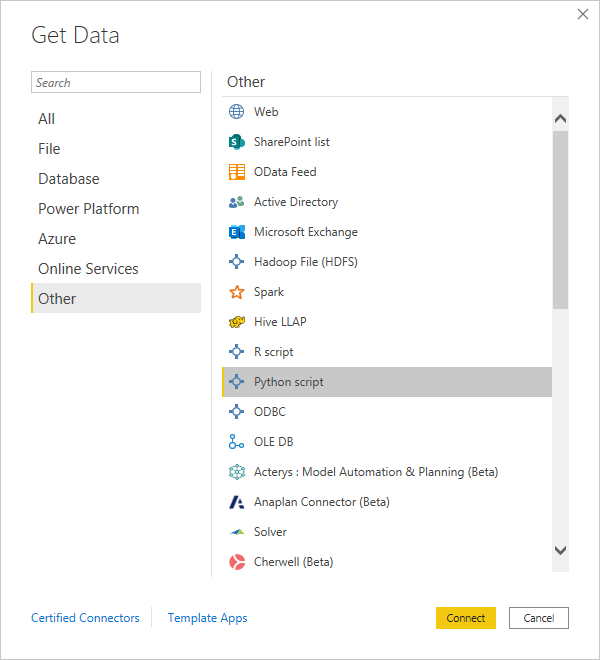
PowerBI opens a window where we can paste a simple Python script (expected to return a pandas
dataframe). We're going to do that with the atoti Python library.
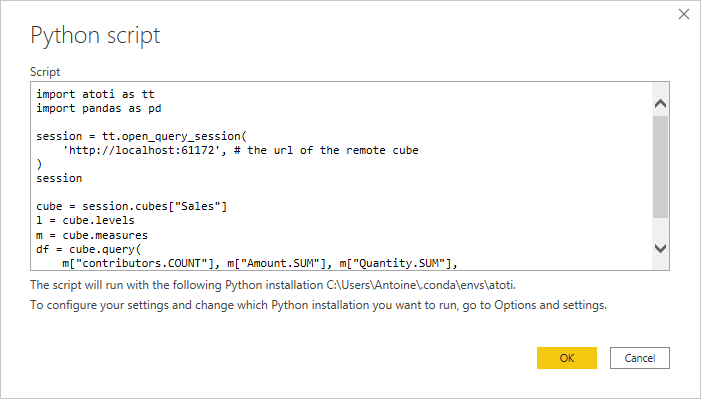
Querying a remote cube with atoti is covered in the tutorial. Here is an example:
from atoti_query import QuerySession

session = QuerySession(
        'http://localhost:61172' # the url of the remote cube
    )

cube = session.cubes["Sales"]
l = cube.levels
m = cube.measures
df = cube.query(
        m["contributors.COUNT"], m["Amount.SUM"], m["Quantity.SUM"],
        levels=[l["Date"], l["Shop"], l["Product"]]
    ).reset_index()
No security is used here. Look at the rest of the documentation for access to secured cubes, including cubes developed with Atoti+ and the Java API.
Why the .reset_index() command applied to the atoti query result? When processing cube queries,
atoti returns a dataframe with a hierarchical index that represents the hierarchies involved in the
query. PowerBI does not support this pandas feature and we must reset the index to a standard flat
column.
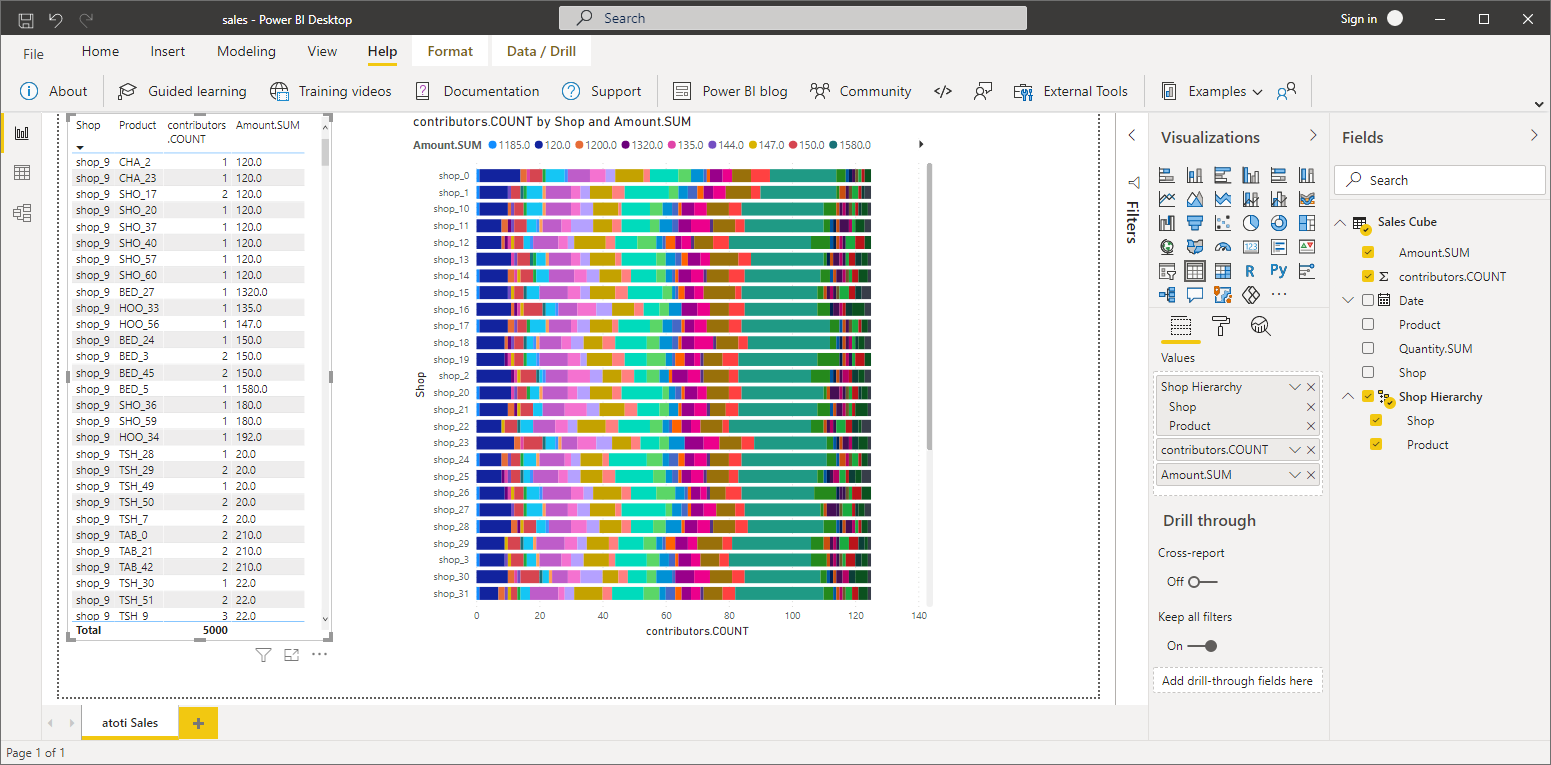
After you press 'OK', PowerBI will take a while to run the python script, get the data and make it
available in the model for dashboarding as usual.
Other front-ends
How can I know if my front-end is compatible with ActivePivot?
In order to be compatible with Microsoft Excel, we have developed an XMLA service that mimics the behaviour of Microsoft SQL Server Analysis Services. All front-ends that use the XMLA protocol should be compatible with ActivePivot.
Do you guaranty compatibility with all front-ends using the XMLA protocol?
No, we do not monitor every front-end to make sure we maintain compatibility. Some front-ends may break compatibility in newer versions.
Do you guaranty performance with all front-ends using the XMLA protocol?
The performance of the association of ActivePivot with a specific front-end will be largely dependent of the MDX queries generated by the front-end. That is a variable that we do not control, so we cannot guaranty the resulting performance.
Do you offer support for other front-ends?
Yes, if you want to use a specific XMLA-enabled front-end, we encourage you to just try it and report any difficulty. We will do our best to help you.