What is Atoti Admin UI?
Atoti Admin UI is a web-based administration interface for Atoti Server. It connects to an Atoti Server instance and a content server, and provides operational visibility without requiring changes to the application itself. This page is intended for administrators and infrastructure engineers managing Atoti environments.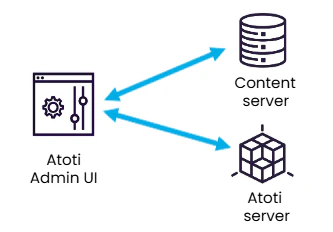
Atoti Server and Content server are dissociated
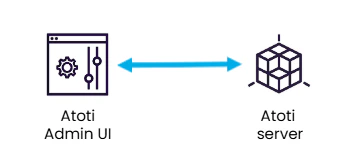
Atoti Server acts as the Content server
What can be done with Atoti Admin UI?
Inspect and manage the content server
Content Service is served by your Atoti application. This hierarchical key-value store is used by various components to persist data.- Atoti Server
- User content data (KPI, calculated members and named sets)
- Branch permissions
- Content service API version
- User locale
- Atoti Admin UI
- User settings
- Atoti UI
- User permissions
- User settings
- User content data (dashboards, filters…)
- Inspect the data stored into the content server
- Manage the users permissions, preferences and content data for Atoti UI
- Manage the user content data for Atoti Server