DoctorPivot - viewing measures and PostProcessors
DoctorPivot provides you with a means to investigate the measures and PostProcessors that are employed within your ActivePivot Accelerator projects:
-
Enables you to view the measure chains that make up any measure in the cubes, together with the properties and descriptions of every measure in these chains
-
Shows how these entities interact with each other
-
Facilitates instant access to the JavaDoc descriptions of the Plugin Keys that are associated with the key PostProcessor classes
-
Runs as part of the server component and comprises the DoctorPivot API and DoctorPivot Web App
DoctorPivot API
DoctorPivot API is a REST service that gets information about your ActivePivot Accelerator project’s cubes and measures. This service can be used with the DoctorPivot Web App or used to power other user interfaces or tools.
DoctorPivot Web App
The web app is an intuitive web-based application for viewing the data that the DoctorPivot API exposes. While the network for the selected cube is traversed, the following entities are made available:
- Datastore fields
- Measure details
- Parent/child relationships between the measures
- PostProcessor classes
- Javadocs
- Plugin keys
Getting Started
This section walks you through the sequence of installing, configuring, and then running DoctorPivot.
Installing
DoctorPivot is bolted onto existing projects by added the code shown below. If you only wish to use the API, Web App dependencies can be omitted.
/pom.xml:
    </properties>
    <dependency>
        <groupId>com.activeviam.tools</groupId>
        <artifactId>doctorpivot-api</artifactId>
        <version>${doctorpivot.version}</version>
    </dependency>

    <dependency>
        <groupId>com.activeviam.tools</groupId>
        <artifactId>doctorpivot-web-app</artifactId>
        <version>${doctorpivot.version}</version>
    </dependency>
{submodule}/pom.xml:
<dependency>
      <groupId>com.activeviam.tools</groupId>
      <artifactId>doctorpivot-api</artifactId>
</dependency>
<dependency>
      <groupId>com.activeviam.tools</groupId>
      <artifactId>doctorpivot-web-app</artifactId>
</dependency>
note
Please be aware that the above code includes an element of hard-coding (the use of the version number ‘1.0.1’ in the following line): <doctorpivot.version>1.0.1</doctorpivot.version>.
This will require updating, as appropriate, for future versions. It then
allocates this value to {doctorpivot.version, which is used further
down within the pom.xmlfile.
Configuring
The following files are key to the configuration of DoctorPivot:
- Java Server file
- Java Configuration file
Add the following DoctorPivot Web App code to your project:
<plugin>
   <groupId>org.apache.maven.plugins</groupId>
   <artifactId>maven-dependency-plugin</artifactId>
   <version>2.2</version>
   <executions>
       <execution>
           <id>unpack-doctorpivot-web-app</id>
           <phase>package</phase>
           <goals>
               <goal>unpack-dependencies</goal>
           </goals>
           <configuration>
               <includeGroupIds>com.activeviam.tools</includeGroupIds>
               <includeArtifactIds>doctorpivot-web-app</includeArtifactIds>
               <outputDirectory>generated/</outputDirectory>
           </configuration>
       </execution>
   </executions>
</plugin>
<plugin>
   <artifactId>maven-antrun-plugin</artifactId>
   <version>1.8</version>
   <executions>
       <execution>
           <phase>package</phase>
           <configuration>
               <target>
                   <echo file="generated/doctorpivot-web-app/env.js">
                       window.env = {
                       serverUrl: {YOUR_SERVER_URL_HERE},
                       javadocUrl: {YOUR_JAVADOC_URL_HERE},
                       javadocVersion: {YOUR_JAVADOC_VERSION_HERE}
                       };
                   </echo>
               </target>
           </configuration>
           <goals>
               <goal>run</goal>
           </goals>
       </execution>
   </executions>
</plugin>
Java Server file
Set the location of DoctorPivot Web App in your project, and the URL used to access it. You can change the access URL here.
public static final String DOCTORPIVOT_DIRECTORY = "./generated/doctorpivot-web-app";
public static final String DOCTORPIVOT_PATH = "/doctorpivot";
Within the createServer function, add the following block:
ResourceHandler doctorPivotResources;
if (port != DEFAULT_PORT) {
    // modify env.js file on the fly, to change the port
    doctorPivotResources = new ActiveUIResourceHandler(port);
} else {
    doctorPivotResources = new ResourceHandler();
}
doctorPivotResources.setDirectoriesListed(true);
doctorPivotResources.setResourceBase(DOCTORPIVOT_DIRECTORY);
ContextHandler doctorPivotContextHandler = new ContextHandler();
doctorPivotContextHandler.setContextPath(DOCTORPIVOT_PATH);
doctorPivotContextHandler.setHandler(doctorPivotResources);
GzipHandler doctorPivotGzipHandler = new GzipHandler();
doctorPivotGzipHandler.setHandler(staticContextHandler);
handlers.addHandler(doctorPivotContextHandler);
Java Configuration file
Set the following:
import com.activeviam.tools.doctorpivot.config.DoctorPivotConfig;
and
@Import(value = {
      ...
      DoctorPivotConfig.class
      ...
})
Running and accessing DoctorPivot
note
Ignore yourDOCTORPIVOT_DIRECTORYin version control, as this folder
is generated upon installation.
To launch DoctorPivot, run mvn clean install
Accessing DoctorPivot within your project
With your project running, access DoctorPivot Web App by visiting
{project_url}/doctorpivot, or the URL you set in the configuration
above. So for FRTB, for example, you would go to
FRTB_Accelerator/doctorpivot.
Navigating the UI
For more information, use the application Wizard to guide you through the sequence of exploring the measures.
UI controls for exploring cubes and measures
This section describes all the buttons, drop-down menus and other menu items that are provided within DoctorPivot to enable you to effectively mine and display information regarding the measures you are interested in.
| Action | What to do in the UI | |
|---|---|---|
| Select a cube | Either use the Cube selector dropdown, or start typing the appropriate cube name, allowing DoctorPivot to perform the auto-completion of the names for you. | |
| Select measures | With the cube selected, the measures can be explored. Use the Measure Selector dropdown menu, or simply start typing. DoctorPivot will auto-complete the measure names for you if you are not entirely sure what you are looking for. You can select as many measures as you like. The measures are displayed in the measure tree. |
|
| Select hidden measures | Some measures are hidden, which means that they are not meant to be seen in your ActivePivot project. Although these hidden measures are actually displayed in your measure trees, by default they cannot be selected by DoctorPivot. To override this, select the Allow selection of hidden measures checkbox. Separate counts of hidden and visible measures are now displayed. For more info, see Hidden measures | |
| Change orientation | Click the Orientation icon. For more info, see Orientation | |
| Add parent measures | Click the parent measure to add it to the tree. To add all parents of the current measure to the tree, click All Parents. For more info, see Parents |
|
| Focus on the current measure | As clicking on keys like All Parents (and other actions) can potentially add many new measures all at once, it’s easy for the tree to rapidly grow large and complicated. To help simplify this, click Isolate to immediately focus on the currently selected measure and its children. | |
| Remove measures | Click the X for the specific measure to remove it from the tree. | |
| View Javadoc | Click Javadoc for the currently highlighted measure |
Orientation
The orientation determines whether the current measure (or set of current measures) being explored will appear at the top of the display (with the descendants being shown at the bottom) or vice versa. The Orientation icon toggles between the two different orientation states.
Measure details
Whenever a measure is selected (and therefore becomes the current measure) all its details are displayed in a format that is easy to digest and understand on the Measure Details card as detailed below.
Arrows and color-coded measures
In all DoctorPivot measure trees, the arrows (arrow-headed connectors) lead from child measures to parent measures, indicating the flow of data. Measures are displayed with the following colour-coding:
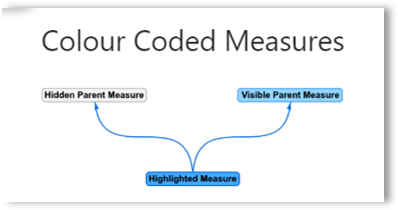
- The currently selected measure is highlighted in dark blue, with bold text
- Visible measures are displayed in a paler blue
- Hidden measures are shown in grey
Hidden measures
Hidden measures are indicated in grey in the selector, tree and details card. This means they are not visible in the ActivePivot project, but instead only serve other visible measures.
By default, you cannot add hidden measures to your selection, but this can be reversed by selecting the Allow selection of hidden measures option. Hidden measures will always appear in the tree regardless of this setting.
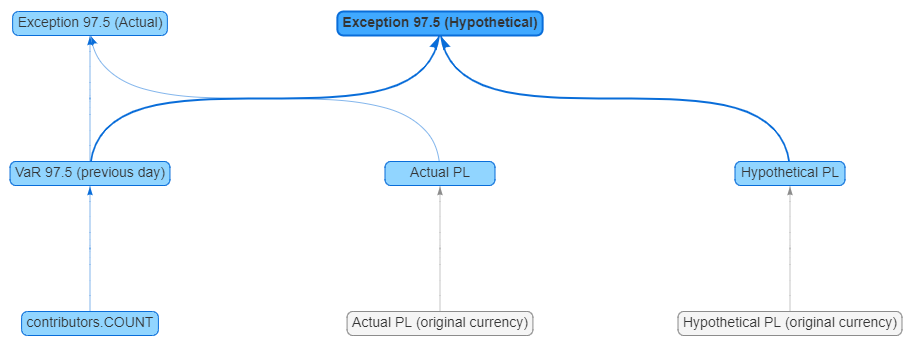
In the example below:
- The hidden measures
Actual PL (original currency)andHypothetical PL (original currency)can be easily identified, because they are displayed in grey. - The current measure
Exception97.5(Hypothetical)is shown in dark blue, with bold text. - The remaining five measures, referred to as the visible ones, are displayed in paler blue.
Viewing hidden measures
-
Beneath the Measures selection field, select the checkbox Allow selection of hidden measures.
The count of hidden measures is now also displayed, alongside that for visible ones.
Example
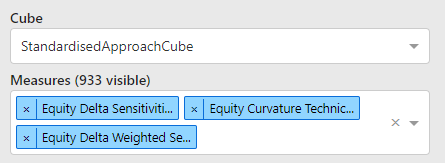
This section provides an example of using DoctorPivot for obtaining, expanding and refining the display of measure chains on the screen. The example is drawn from the FRTB Accelerator Project, using the Standardised Approach cube.
Step 1 : Selecting the measure
Type in Equity Delta Sensitivities in the cube selection window.
DoctorPivot will auto-complete and present a list of measures as shown below. In this instance, the selection has been reduced to about a dozen members. Please note that this type of selection is ‘fuzzy’ to allow a little leeway in the typing of the required measure. The fuzziness of the selection algorithm throws up a range of alternatives which can be useful if you are uncertain about the name of the measure.
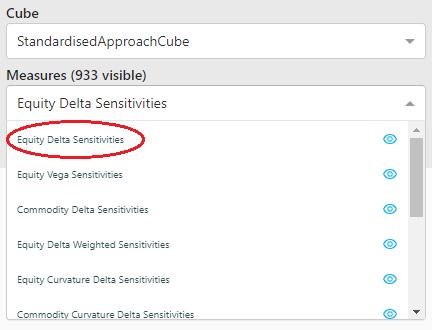
Click Equity Delta Sensitivities (ringed in the above image). The following measure tree is displayed.
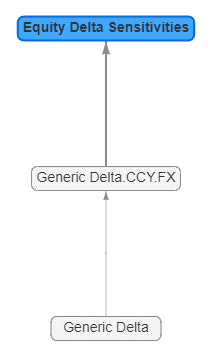
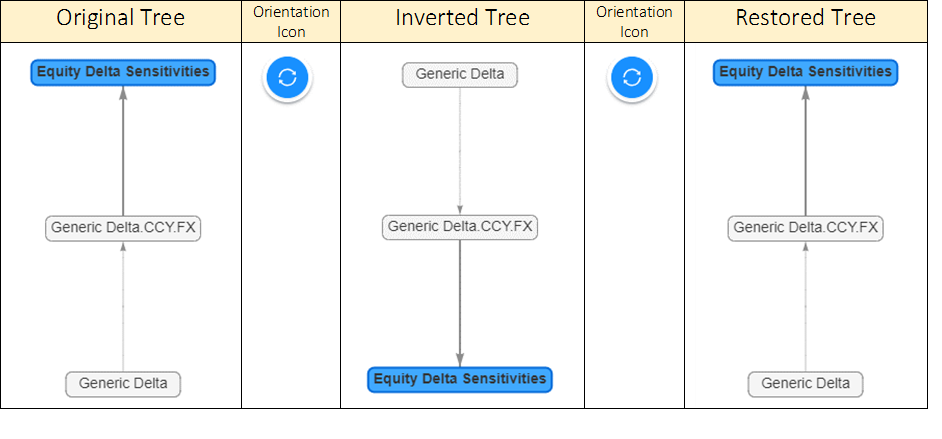
Step 2: Toggling the orientation
Click the Orientation icon. The entire tree is inverted so that the currently-selected measure is shown at the bottom. You can click the Orientation icon a second time to toggle the displayed tree back to its original order.
Step 3: Viewing the measure details
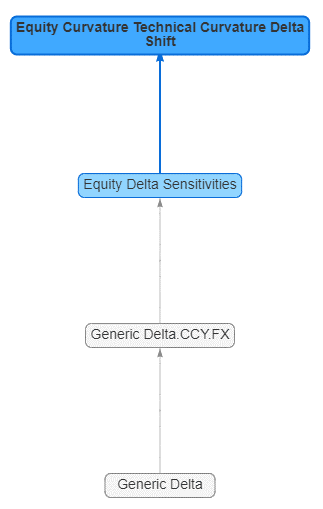
While Equity Delta Sensitivities remains as the current measure (the
one that is focused on by DoctorPivot) the Measure Details card is displayed:
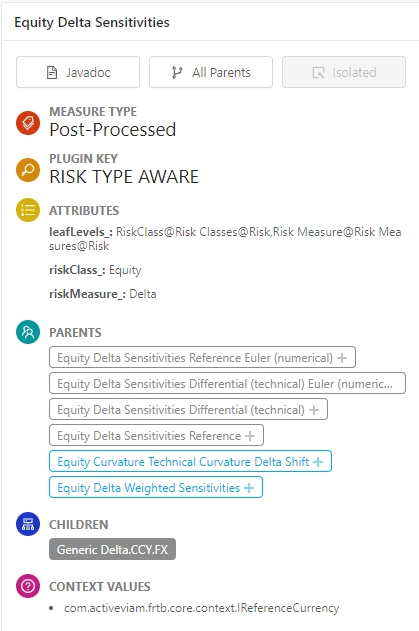
You can now click any measure within the PARENTS section to add this measure to the measure tree. The clicked
measure becomes the current measure. So if, within the PARENTS section, you click the measure
Equity Curvature Technical Curvature Delta Shift as shown below
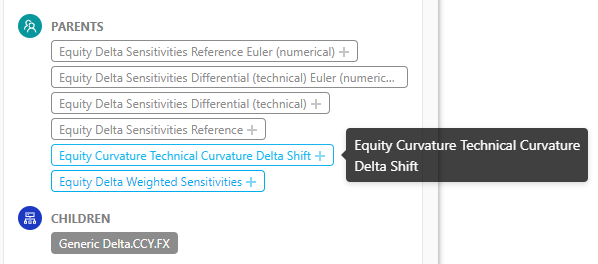
this measure becomes the current measure and the following tree is displayed:
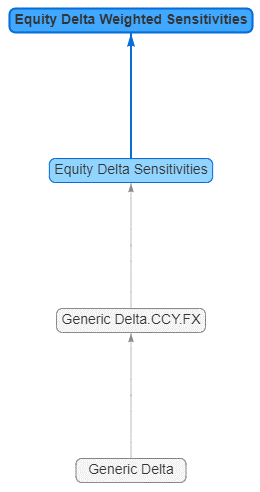
Similarly, if you then click the Equity Delta Weighted Sensitivities,
then the tree is updated, as shown below:
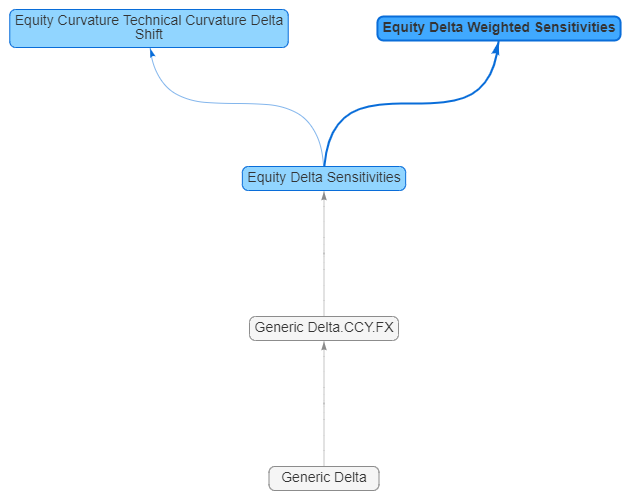
note
Equity Delta Weighted Sensitivities is now highlighted to indicate
that it is the current measure.
Now if you click Equity Delta Sensitivities again:
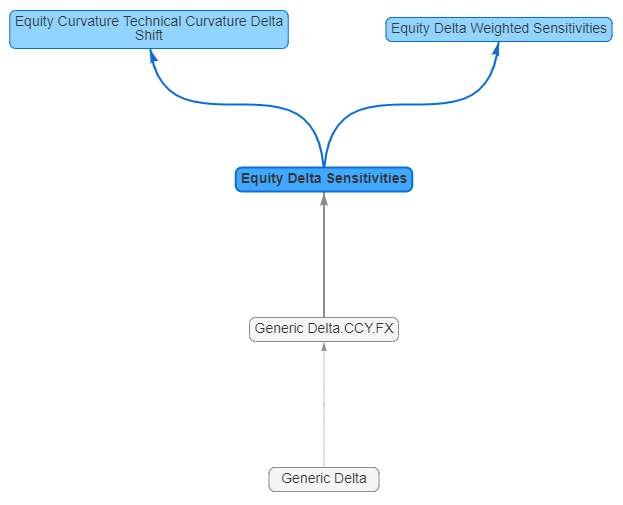
The selectiSelection panelike this:
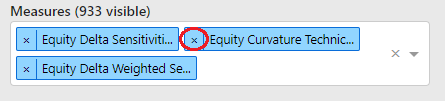
Step 4: Removing measures
Click the X beside the
Equity Curvature Technical Curvature Delta Shift to remove this
measure from the tree.
The focus is now on Equity Delta Weighted Sensitivities and this
becomes the current measure: