This feature is experimental.
It must be manually enabled with the following property:
activeviam.feature.experimental.atoti_sql_server.enabled=true.- An active Atoti application with a cube available.
- Tableau Desktop or Tableau Cloud access.
- Atoti Tableau Adapter configured and running.
- Basic knowledge of Atoti cubes and Tableau concepts such as dimensions, measures, and aggregation.
How is an Atoti cube represented in Tableau?
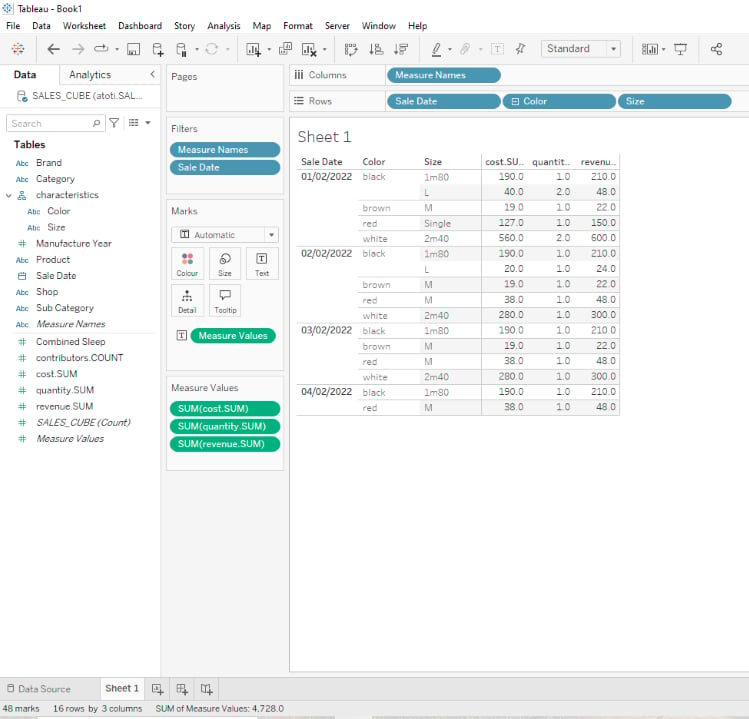
Once connected through the Tableau Adapter, the cube appears on Tableau’s data source page.Fields classification by Tableau
Field is the term used by Tableau to designate a column in a discovered SQL table. In this case, this refers to both exposed cube levels and measures. Internally, Tableau automatically identifies each field as a dimension or measure. This classification is made depending on the type of data the field contains. A field is also classified as discrete or continuous based on Tableau’s standard logic. More information can be found in the official documentation. The image below illustrates how Atoti exposed levels and measures are represented in the Data pane.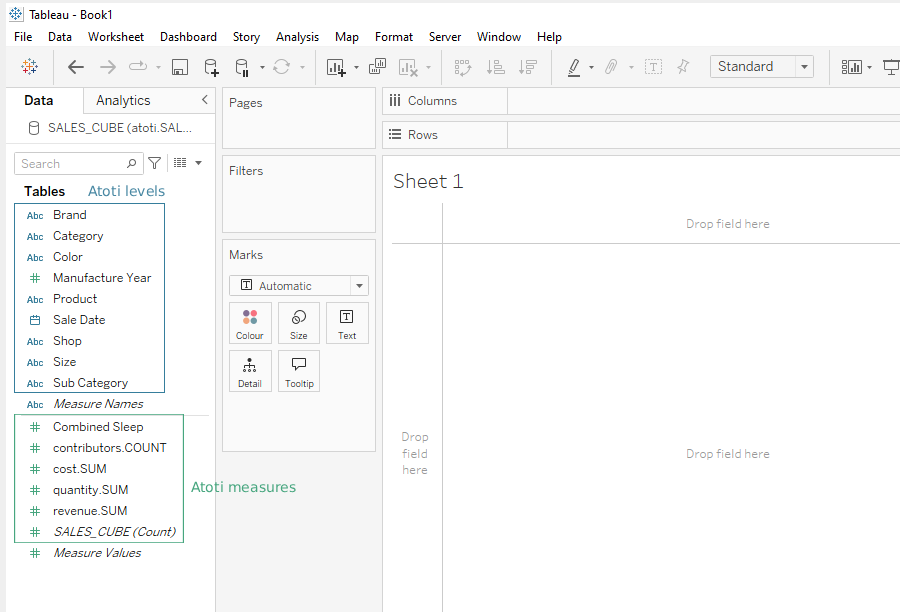
How to reproduce the cube’s structure
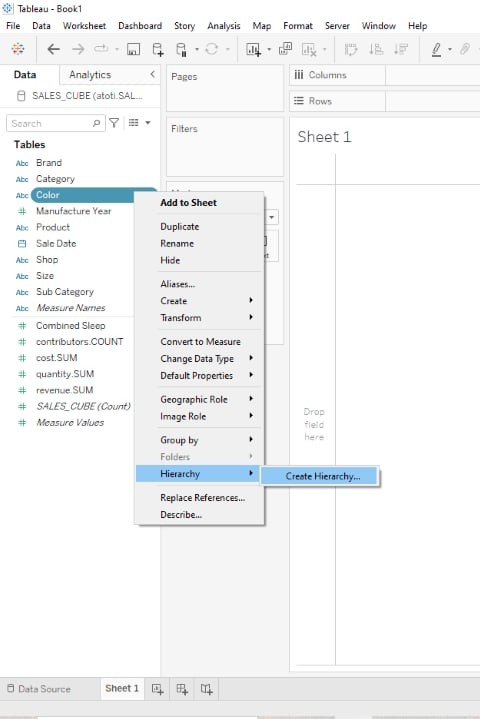
Tableau is unaware of the cube’s structure behind the SQL table. This is why no hierarchies are present in the Data pane once the connection has been established. It is still possible to reproduce the cube’s structure in Tableau, as explained below.Create a hierarchy
- Right-click the dimension (Atoti level) in the Data pane.
- Select
HierarchyandCreate Hierarchy.
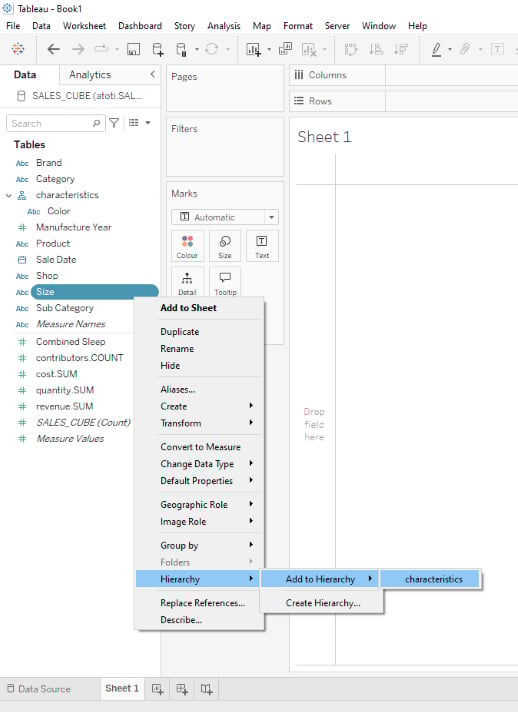
Add a level to an existing hierarchy
- Right-click the dimension (Atoti level) in the Data pane.
- Select
HierarchyandAdd to Hierarchy.
Adjust the granularity of the dashboard
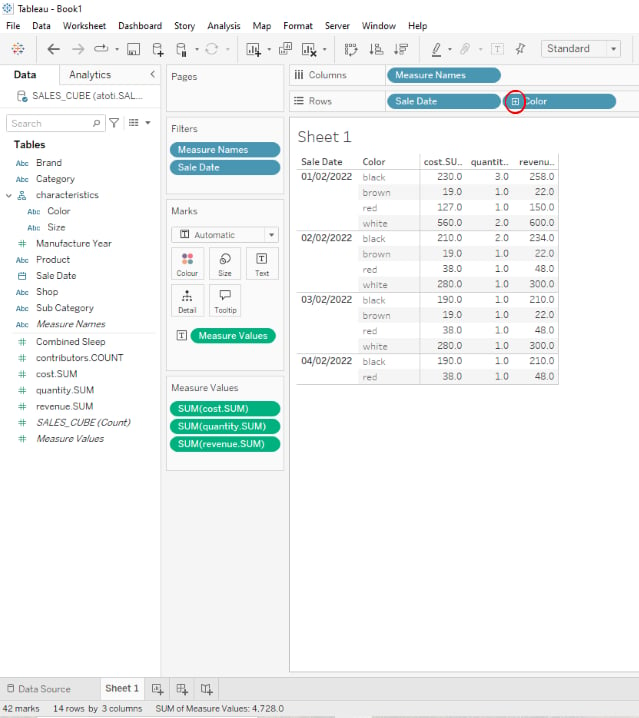
Once a hierarchy has been created and populated, it can be used to drill down or up. This can be done by clicking on the+ or - icon next to the hierarchy level:
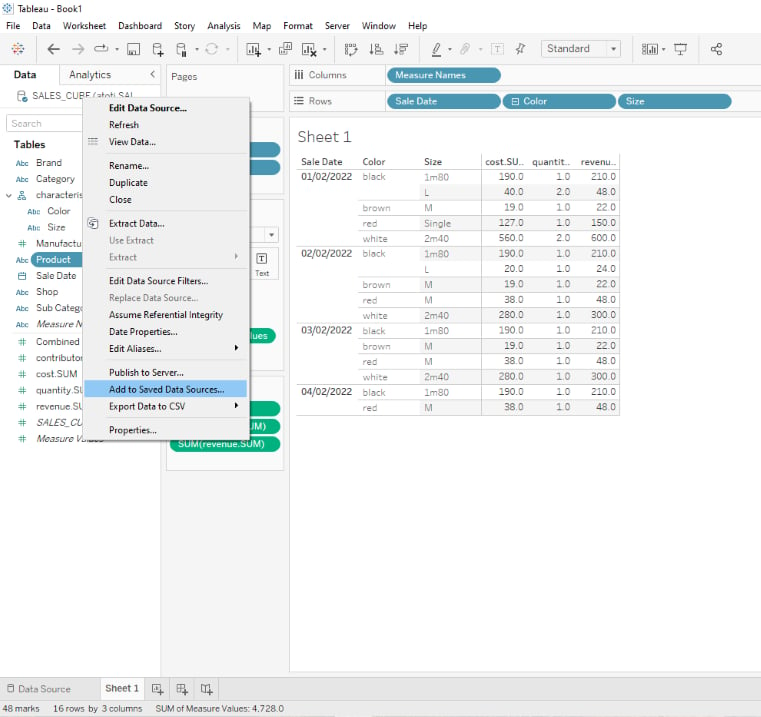
Save the structure
Once the cube’s structure has been reproduced, it is possible to save it for later Tableau sessions using the Tableau-specific.tds file format.
- Right-click on the cube’s name in the Data pane
- Select
Add to Saved Data Sources - Save the file using the
.tdsformat
How live mode works
In live mode, Tableau sends a SQL query to the cube each time a visualization is displayed.Use of measures
When a measure is placed in the view, Tableau adds an aggregation operator (for example,SUM(Mtm.SUM)).
Atoti ignores this operator because the measure is already aggregated in the cube.
Changing the aggregation function in Tableau does not affect the cube result.
Changing a measure to a dimension or an attribute does not change the result either.
Tableau still displays a single value per member.
This value corresponds to the aggregated value computed by Atoti from multiple underlying facts.
In extract mode or when joining with other tables, Tableau may apply aggregation on its side.
How extract mode works
Extract mode retrieves data from the cube and stores it locally in Tableau. No live queries are sent after extraction, so data can be queried even if the cube is offline.Considerations
- Apply filters to limit the extraction scope.
- Hide unnecessary fields to reduce data volume.
- Aggregation operators are applied by Tableau in this mode.
- Be cautious with reaggregation:
Mtm.SUMcan be reaggregated withSUMorAVG.- Non-linear measures cannot be reaggregated.
What are the supported data types?
The following types are supported without any required action:StringDoubleBooleanLongIntFloatArray
Date and time support
Tableau’s default behavior with date and time fields is to extract the different parts of those fields to allow drilldown. For example, the year of a date field is extracted first, and the user can then drill down to the month and the day. This behavior may lead to incorrect results, due to a semantic gap between SQL and the Atoti OLAP Cube. Tableau extracts the date component using SQL functions (EXTRACT, CAST, TRUNC), and may reaggregate the values, leading to incorrect results.
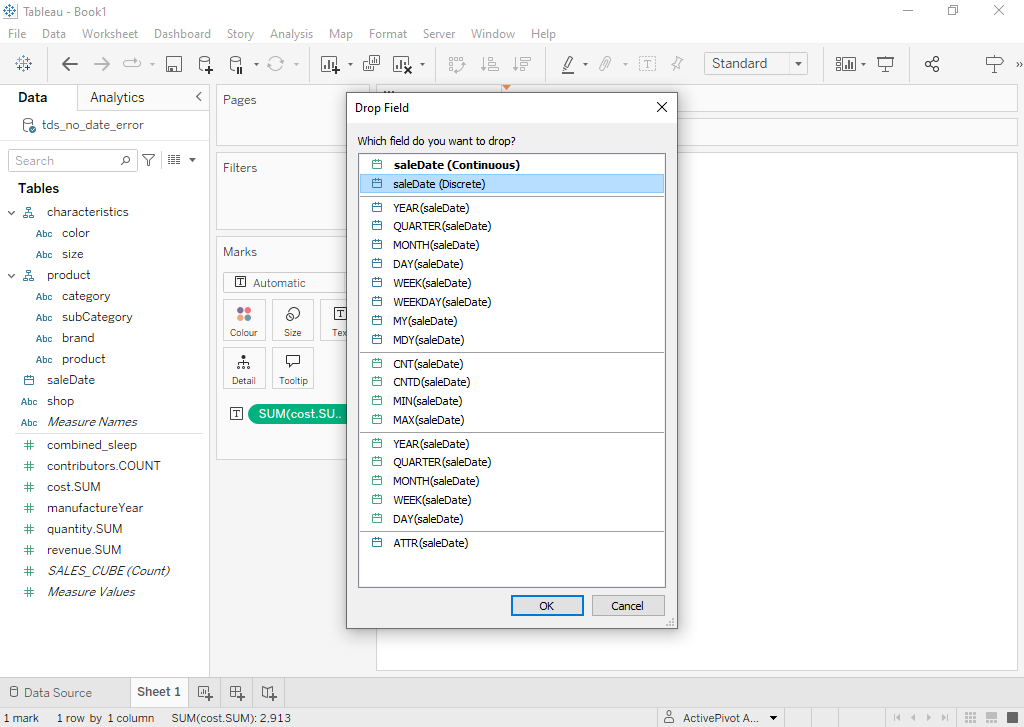
The following error message is displayed when it occurs: Atoti does not support Tableau's default behavior with date fields
More generally, calculated fields are not supported by the Atoti Tableau Adapter. Only the plain detected Atoti fields can be queried.There are three ways to work around this limitation:
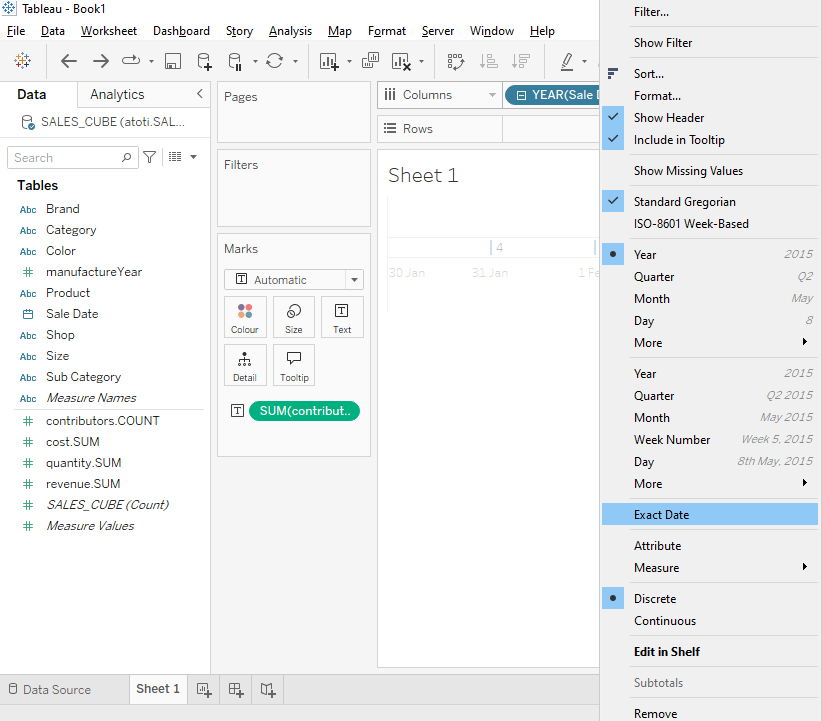
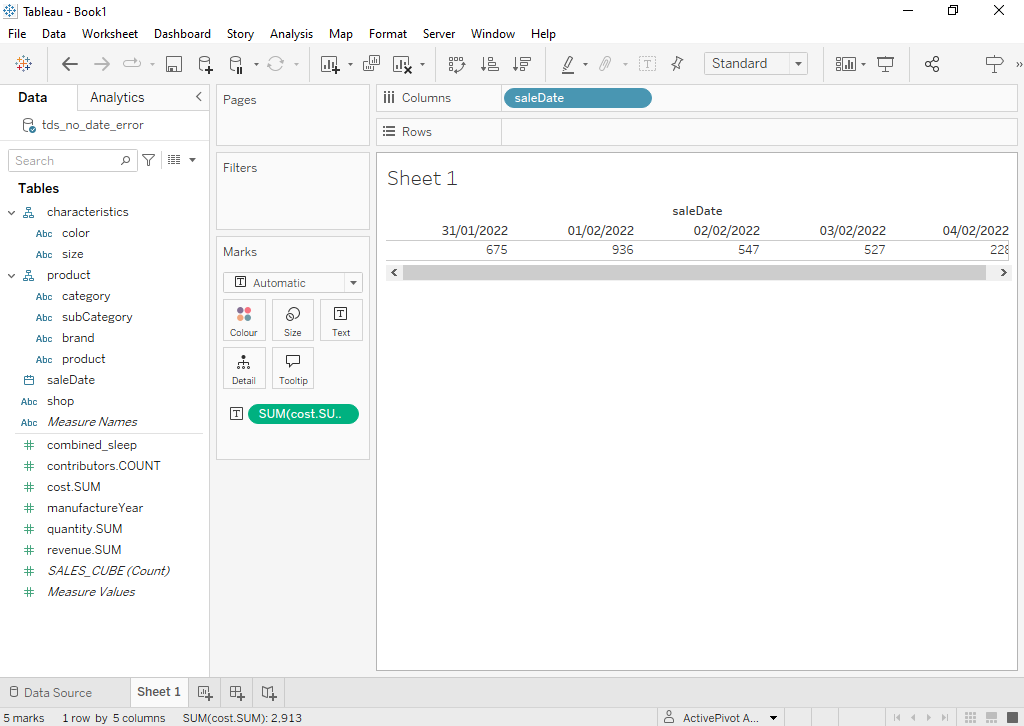
Option 1: Modify the date’s format after it has been dropped as a column or row
Once the error message has been thrown and closed, it is possible to change the date’s format:- Right-click the date field
- Select
Exact Date
Option 2: Modify the field’s data type
Use a right-click drag instead of a left-click drag for date and time fields:- Right-click the date or time field in the Data pane (do not left-click).
- Drag and drop it into the desired location (for example, Columns or Rows).
- From the context menu, select the
(Discrete)option for the field.
Option 3: Configure a multi-level date hierarchy in Atoti Server
Instead of exposing a flat, single-level date hierarchy with members like2024-11-21,
configure the cube with a multi-level date hierarchy that has separate levels for each date part, for example Year > Month > Day.
With this setup, Tableau can query each date part (year, month, day) directly as a separate level, without needing to extract it client-side.
This also enables proper drilldown behavior in Tableau.
Data preview
Some Tableau screens allow a preview of a cube’s content. In this case, a drillthrough is performed, but not all values are retrieved:- A level value is retrieved only if its originating store field has the same name.
- No measure value is retrieved. Edge cases exist, such as a vector-type store field with a measure based on it that has the same name but a different value type (for example, the sum of all the vector’s coordinates).