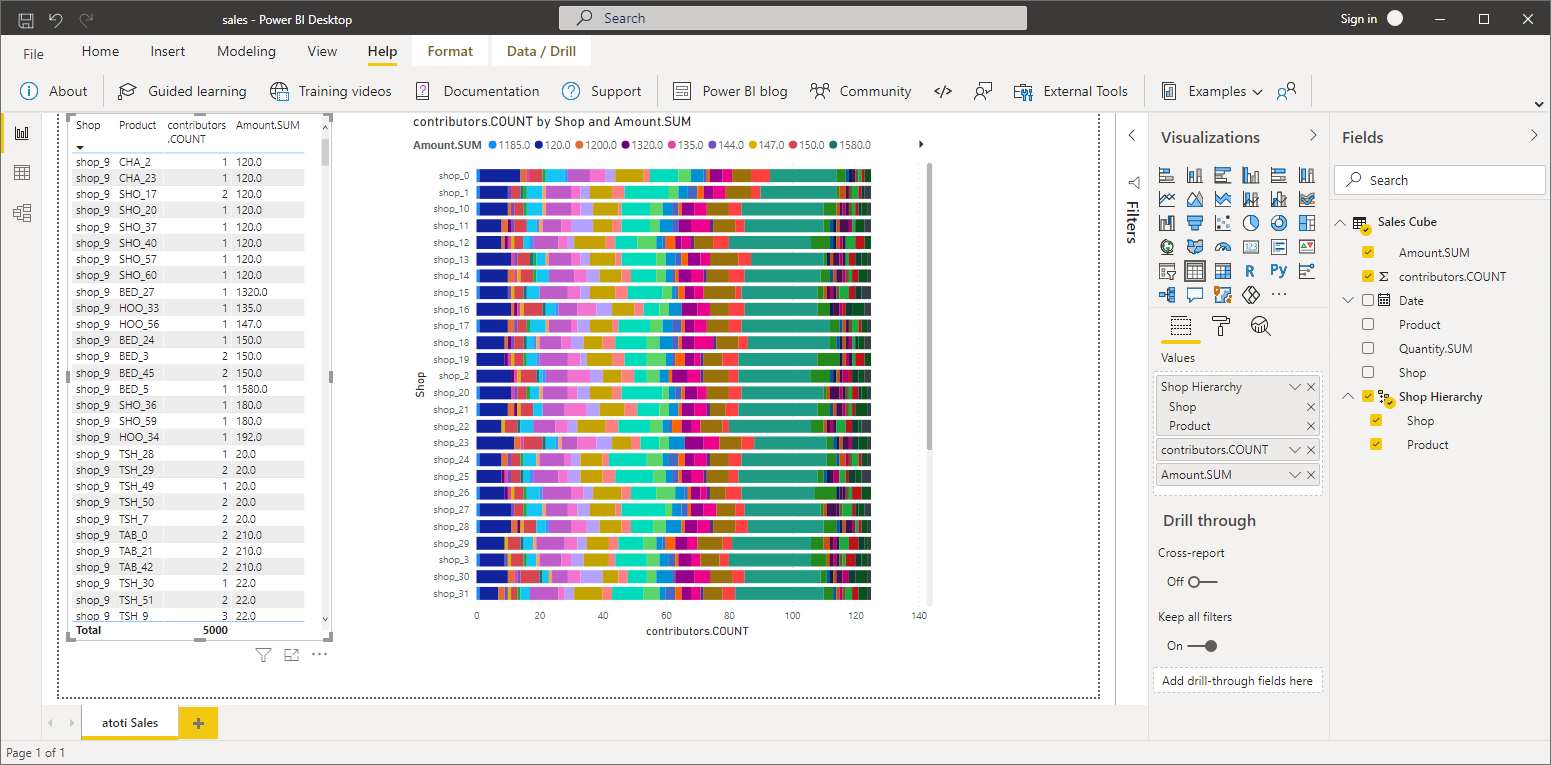
Connecting to Atoti in PowerBI using an MDX query
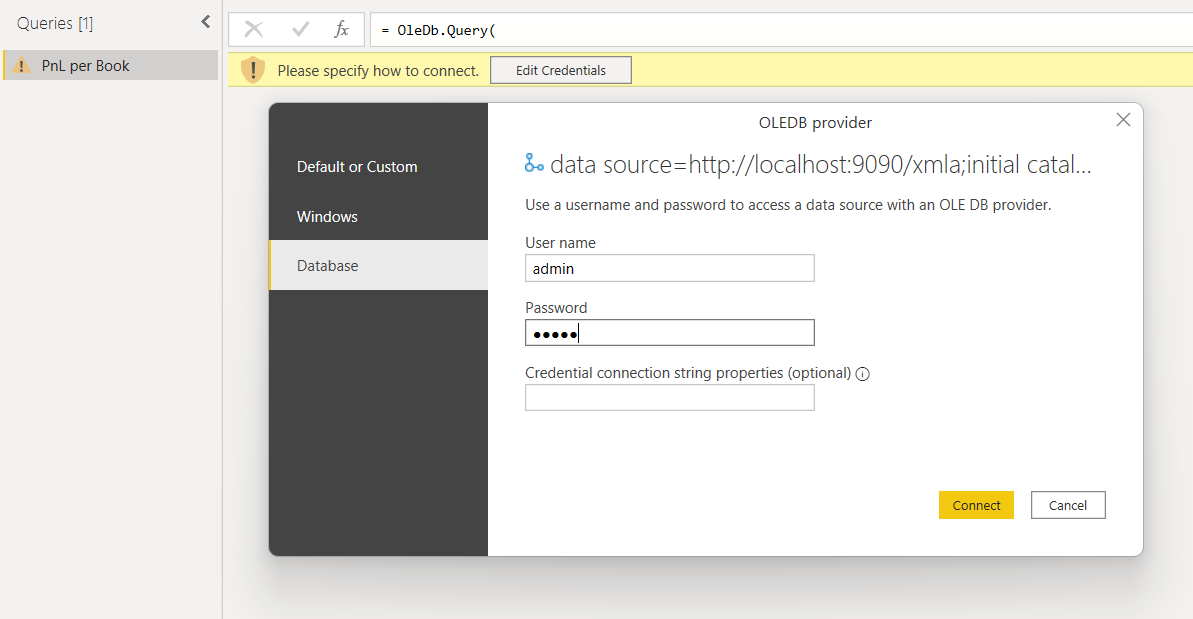
Open Power BI, click on “Get Data” drop down menu from the ribbon, select the “Blank Query” data source type. This will open the Power Query editor.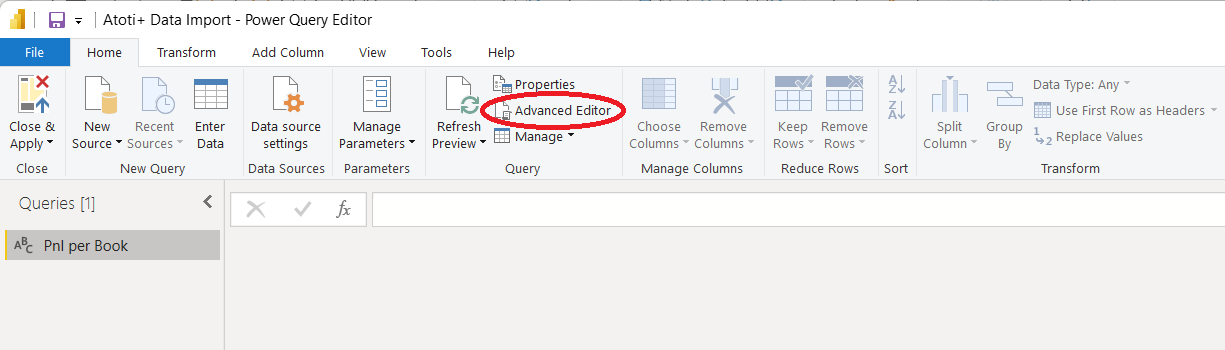
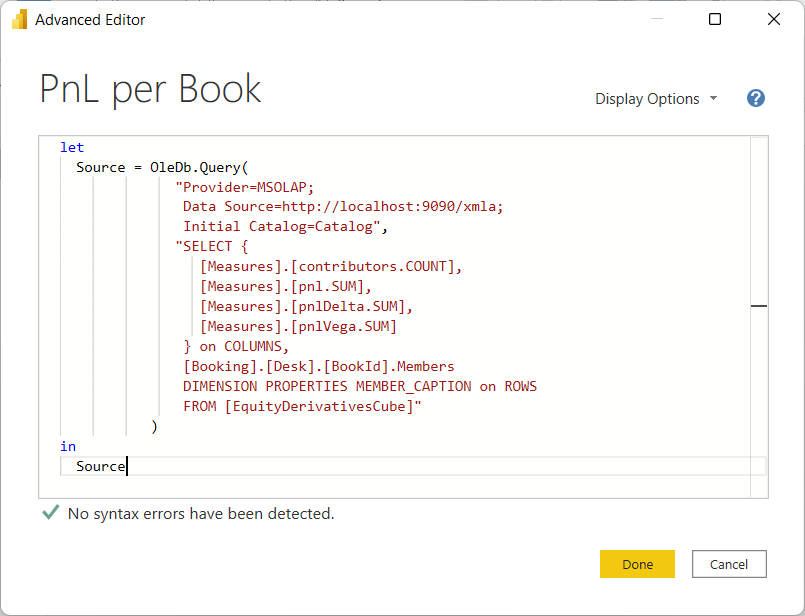
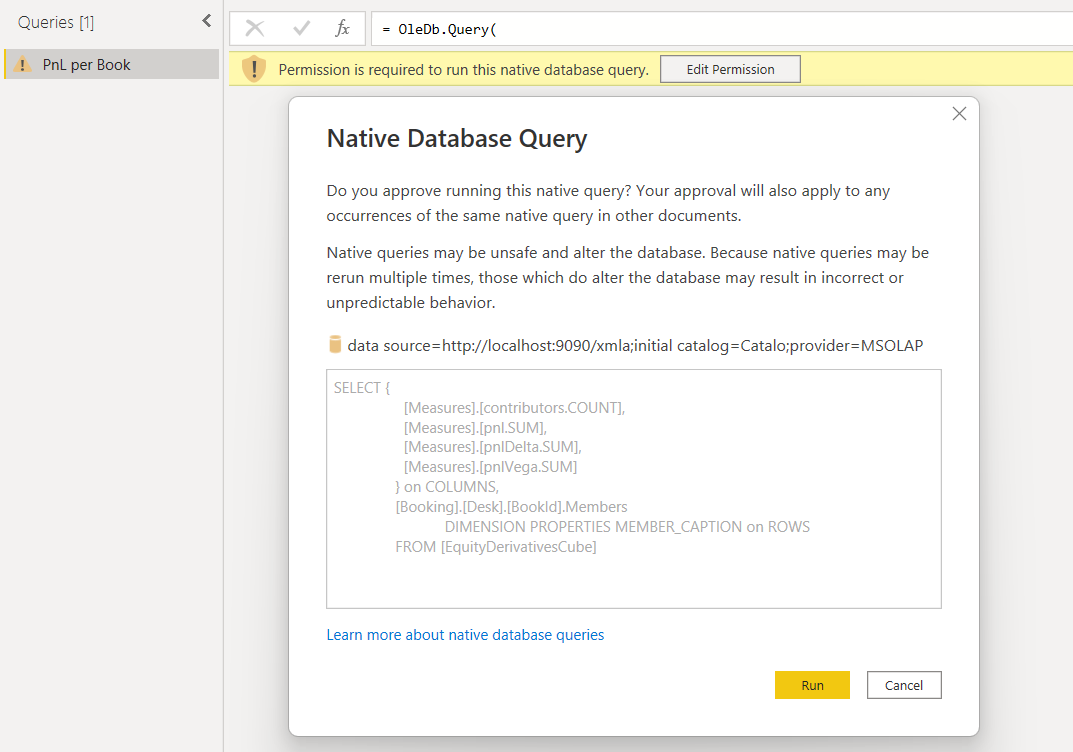
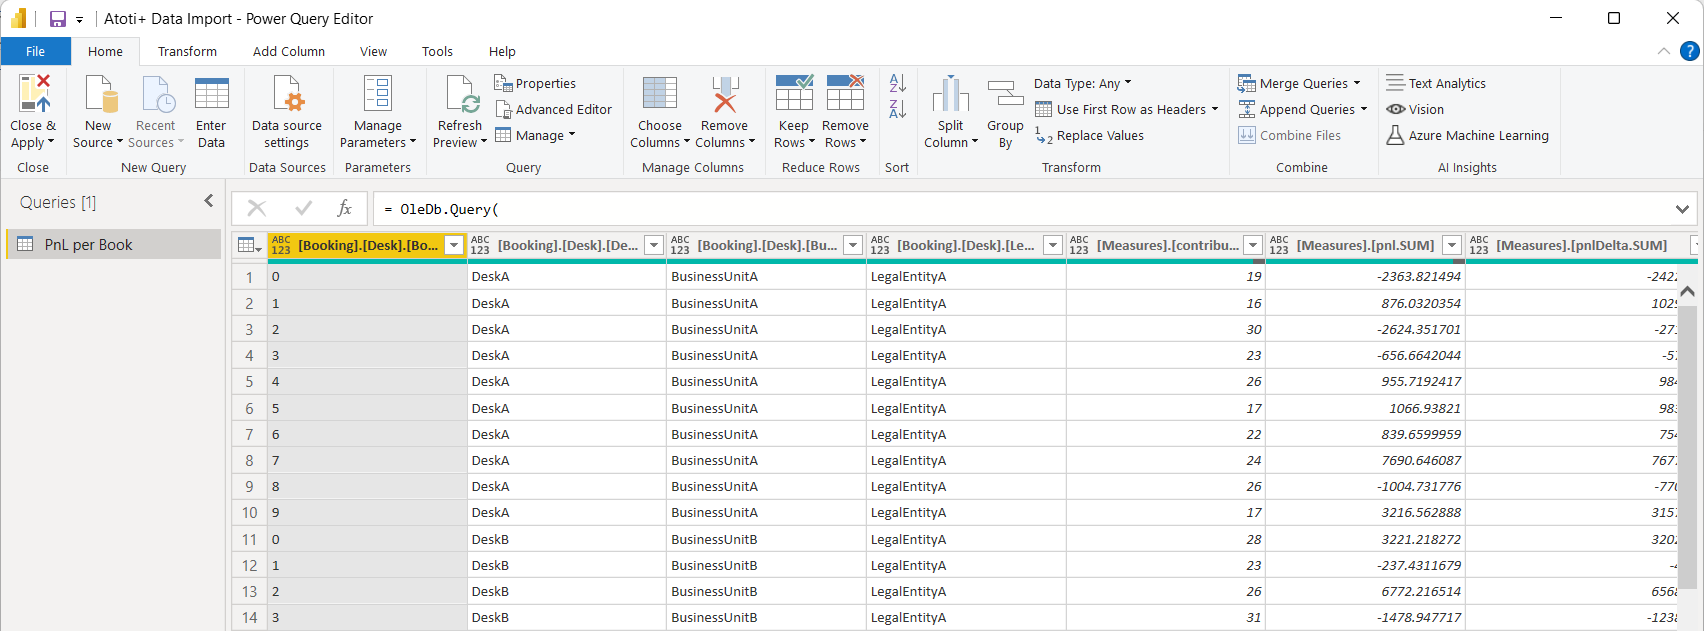
MDX query for PowerBI (click to expand)
MDX query for PowerBI (click to expand)
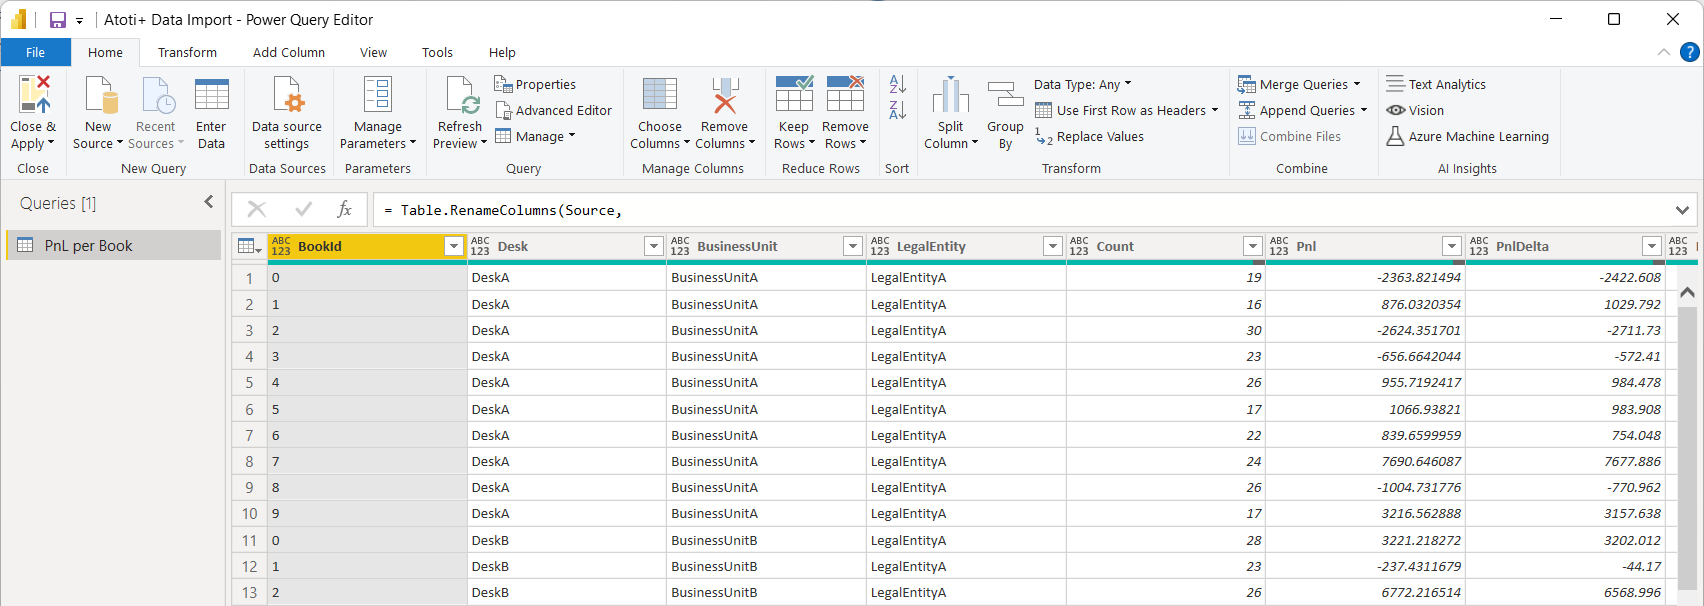
MDX query with improved display (click to expand)
MDX query with improved display (click to expand)
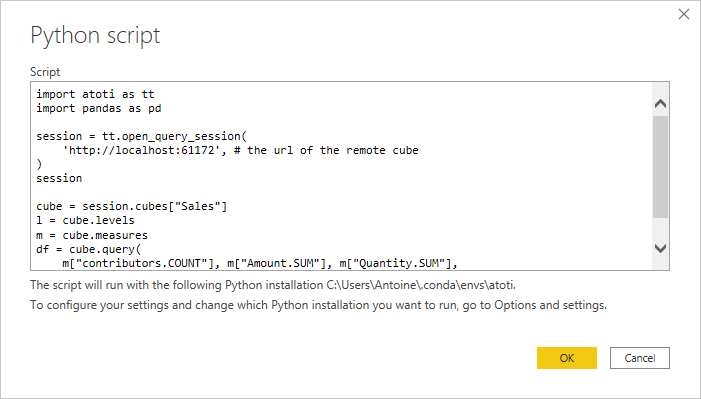
Connecting to Atoti in PowerBI using a Python script
Prerequisites are to have Python 3.8+ (64 bit) installed, to have PowerBI configured for running Python scripts, and to have the Atoti Python library installed. In case several Python environments are installed on the machine, then Atoti must of course be installed in the environment referenced in the PowerBI configuration. To create our sample Atoti cube let’s use the Atoti tutorial. After running the first few cells of the first tutorial notebook we have a cube called “Sales” with a few hierarchies and measures, we’re going to use this cube for our experiment. We need to record the port of this cube (that we get by evaluatingsession.port in the notebook) for later use.
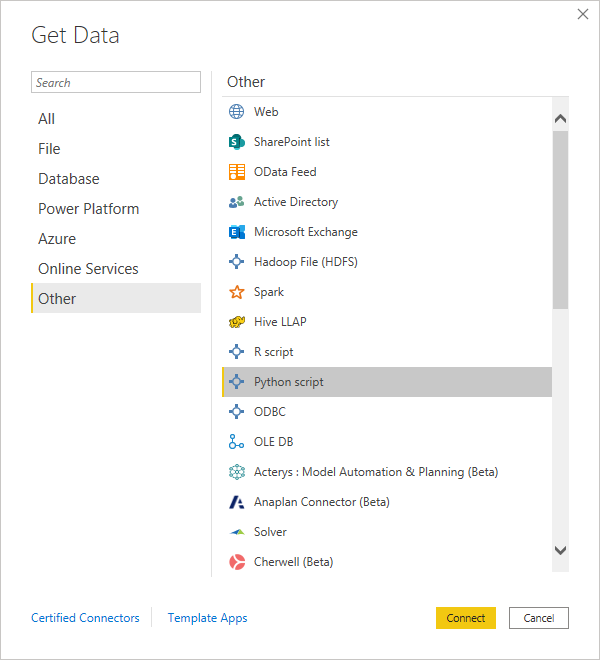
In PowerBI we open the Get Data wizard and select the Python script option.
.reset_index() command applied to the Atoti query result? When processing cube queries,
Atoti returns a dataframe with a hierarchical index that represents the hierarchies involved in the
query. PowerBI does not support this pandas feature, and we must reset the index to a standard flat
column.
After you press ‘OK’, PowerBI will take a while to run the python script, get the data and make it
available in the model for dashboarding as usual.