
IMemoryAnalysisService. These memory reports list all off-heap memory used by ActivePivot, with
detailed ownership information (e.g. which store allocates which type of memory, which dictionaries,
indexes, …).
This service can be instantiated and used
programmatically, or it can be
exposed by setting up a JMX bean.
These reports can then be analyzed using the
Memory Analysis Cube project (MAC). It is a specialized
tool enabling in-depth analysis of the off-heap memory consumption of ActivePivot applications.
For more detail on the analysis process, please refer to the documentation of the MAC repository.
Export Memory Reports Programmatically
The basic implementation ofIMemoryAnalysisService is MemoryAnalysisService.
It can be instantiated through its constructor, passing the Datastore and
ActivePivot Manager we want to export.
exportPath.
Path of the exported report.
Export Memory Reports through an MBean
TheIMemoryAnalysisService can be created and exposed through a JMX MBean,
using the following snippet:
temp directory. All generated reports will be created inside that directory
as sub-folders.
The implementation MemoryAnalysisService is MBean friendly and will
automatically name itself as MemoryAnalysisService.
Generating the Report
To export a new report, connect to your application using your favorite MBean browser. In this guide, we will be using Java Mission Control. Alternatives are JConsole or JVisualVM - which are proprietary software of Oracle - or the open-sourced VisualVM. In the MBean folder com.quartetfs, you will see the MBean MemoryAnalysisService.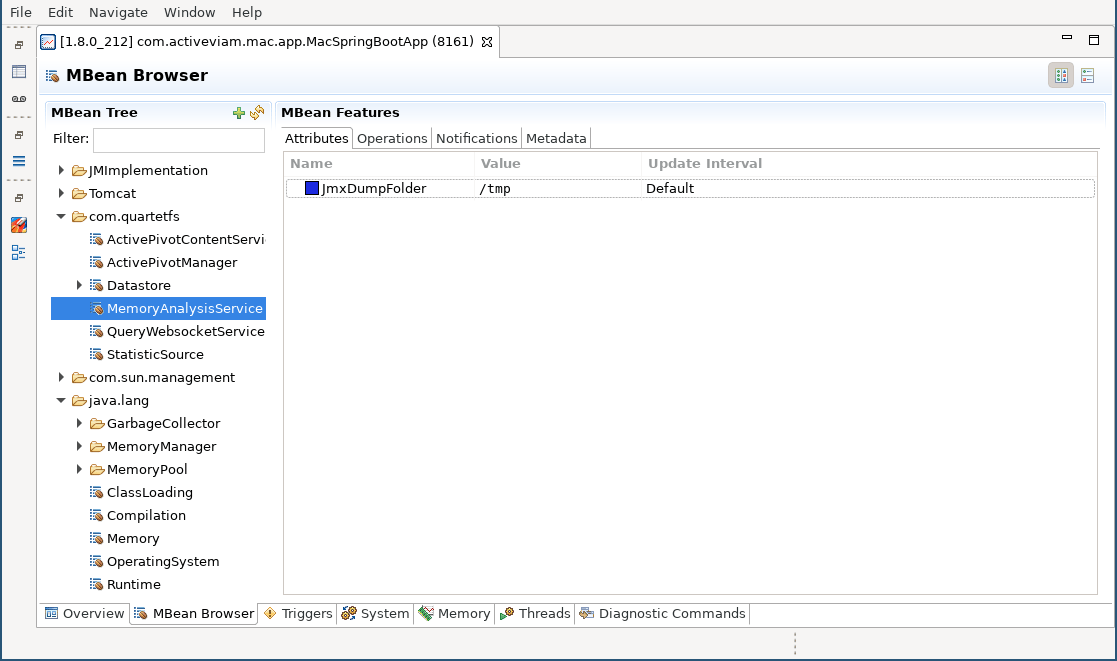
JmxDumpFolder corresponds to the path to the service’s export directory, in
case you are unaware of the application configuration.
Within the operation screen, you have the ability to export a report for the
entire application - see the following screenshot - or for a selected range of
epochs. Exporting a range allows exporting only the memory required for a given
epoch or series of epochs. Exporting the whole application helps detect how
much memory is truly retained (very handy for spotting objects leaking memory).
Full Export
When exporting the whole application, you are asked to provide a name for the export. This name is used to create a sub-folder inside the application export directory. The result of the operation call tells us exactly where the report is located. For our example, we want to generate a report in the folder export-1, that will be located under /tmp/export-1. In case we already have a folder export-1, the application will add a timestamp at the end of the specified folder name.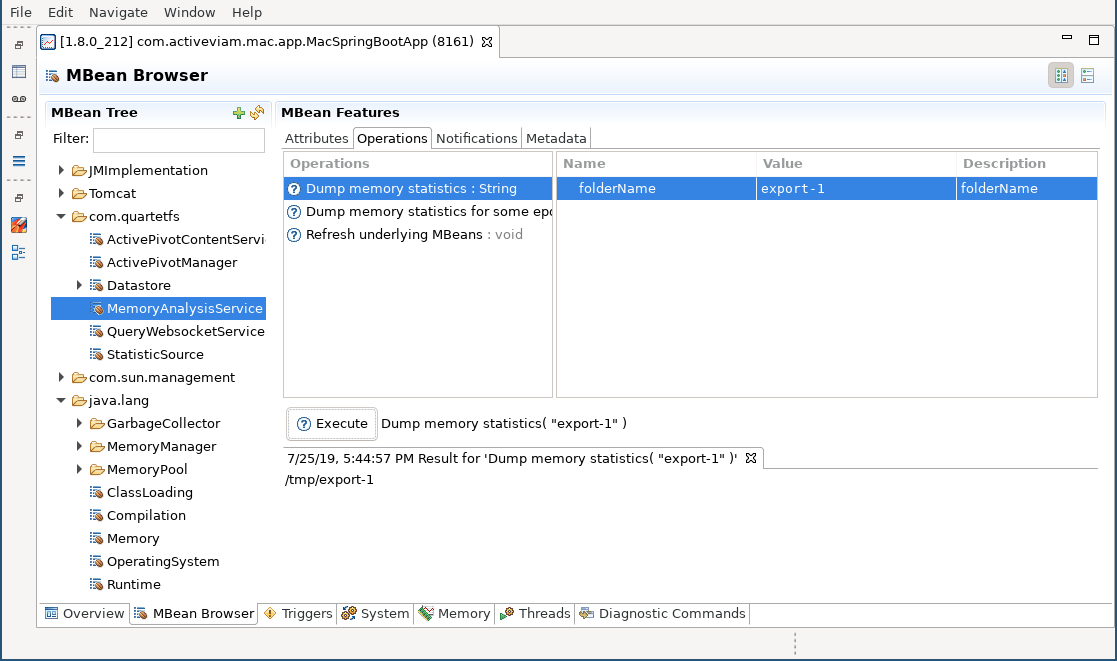
Version Export
Doing an export of the application for a range of epochs is very similar to doing the full application export. In addition to the export folder, the list of epochs to export needs to be specified. This list is a comma-separated list of ranges. A range can be one of the following:- a single value like
1, that will export Epoch 1, - a range like
1-3, that will export Epochs 1, 2 and 3
1,4-6,9 represents Epochs 1, 4, 5, 6 and 9.
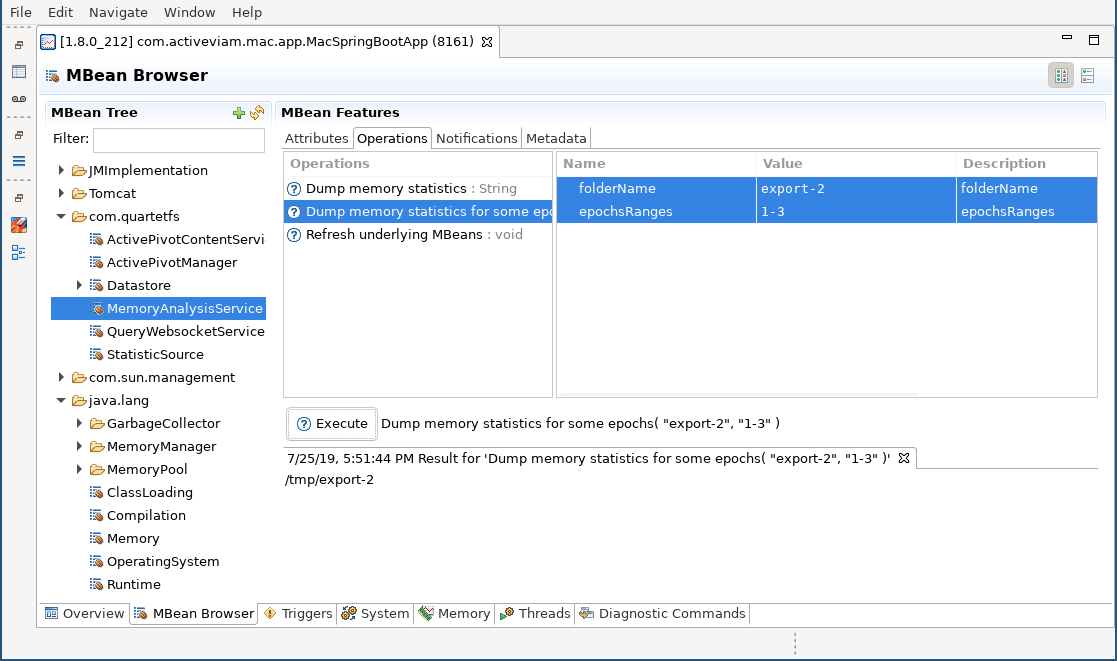
In our example, we export Epochs 1, 2 and 3 into export-2.