Introduction
Atoti UI allows our users to analyze data using a variety of functionalities. The Atoti Excel Add-in brings some of these functionalities into Excel:- Allow users to drillthrough into special datagrids and widgets in Excel and bypass the Excel row limit;
- Refresh the pivot table when real-time updates occur;
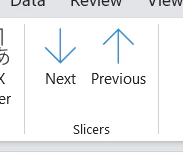
- Move through sliced filters more easily using next and previous buttons;
- View and configure context values;
- View MDX queries executed by the pivot table.
Installation
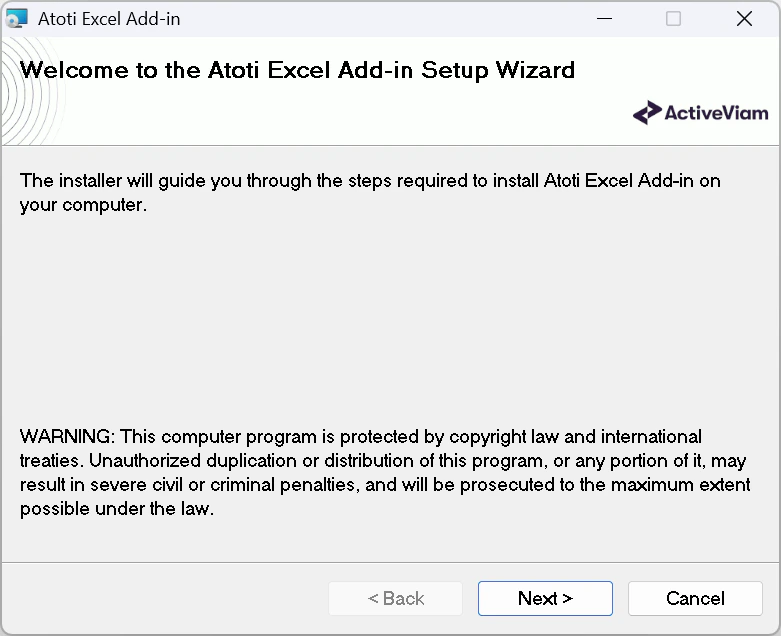
To use the add-in, Atoti Server must first be configured as explained here. The Excel Add-in itself is released and installed thanks to a setup.exe file and an accompanying MSI file. Dependency information (shipped as DLLs with the installer):- Antlr3
- VSTO 4.0
- .NET Framework 4
How to use the add-in
Introduction
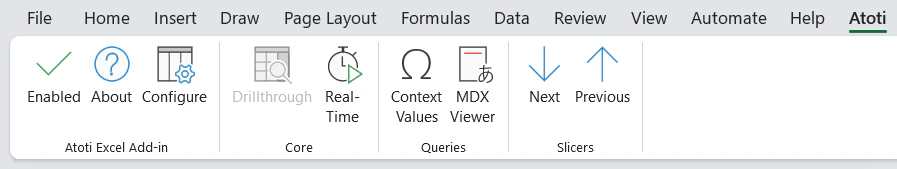
Each additional feature of the add-in is available from both the “Atoti” ribbon section and the context menu of a valid pivot table.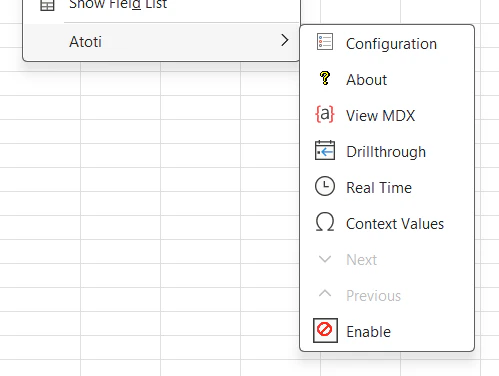
Enable
The Enable button allows to enable or disable the add-in.About
The About button opens a pop-up showing the add-in version and the versions of Atoti it is compatible with.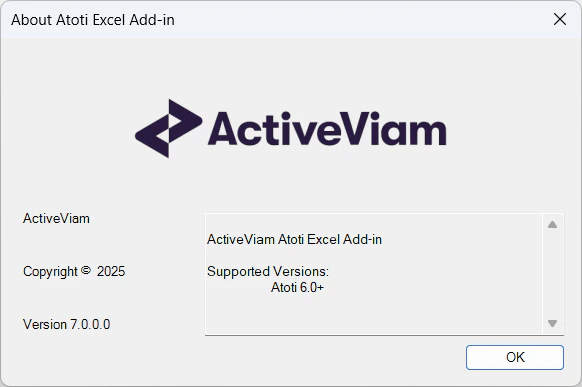
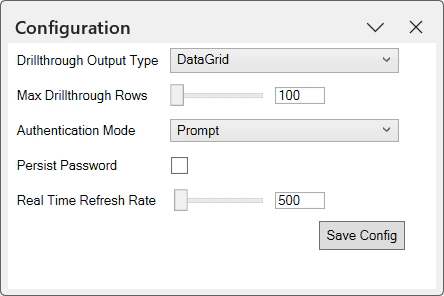
Configuration
The configuration button opens a pop-up that allows you to choose different settings:- the authentication method
- the drillthrough output type
- the refresh rate of the real time
Drillthrough
There is a native function for drillthrough in Excel. The add-in provides an alternative drillthrough function that:- can use a context value
drillthrough.maxrowsto configure the maximum number of rows in the output; - can display the drillthrough result as a datagrid or a spreadsheet.
drillthrough.maxrows limit can be configured from Excel with the context values action of the add-in. The output format of the drillthrough (datagrid or spreadsheet) can be chosen from the configuration settings.
How to create a new drillthrough
A drillthrough can be performed on a cell of a pivot table by either double-clicking on the cell or selecting the cell and selecting the ‘Drillthrough’ option from the ribbon or the context menu. There are several kinds drillthrough that can be performed, you can select the type by changing the ‘Drillthrough Output Type’ in the configuration settings.Spreadsheet Drillthrough
The spreadsheet drillthrough option is similar to the native drillthrough, but is not limited by the native Excel drillthrough row limit. The drillthrough displays the number of rows based determined by the ‘Max Drillthrough Rows’ context value, and opens the result in a new sheet: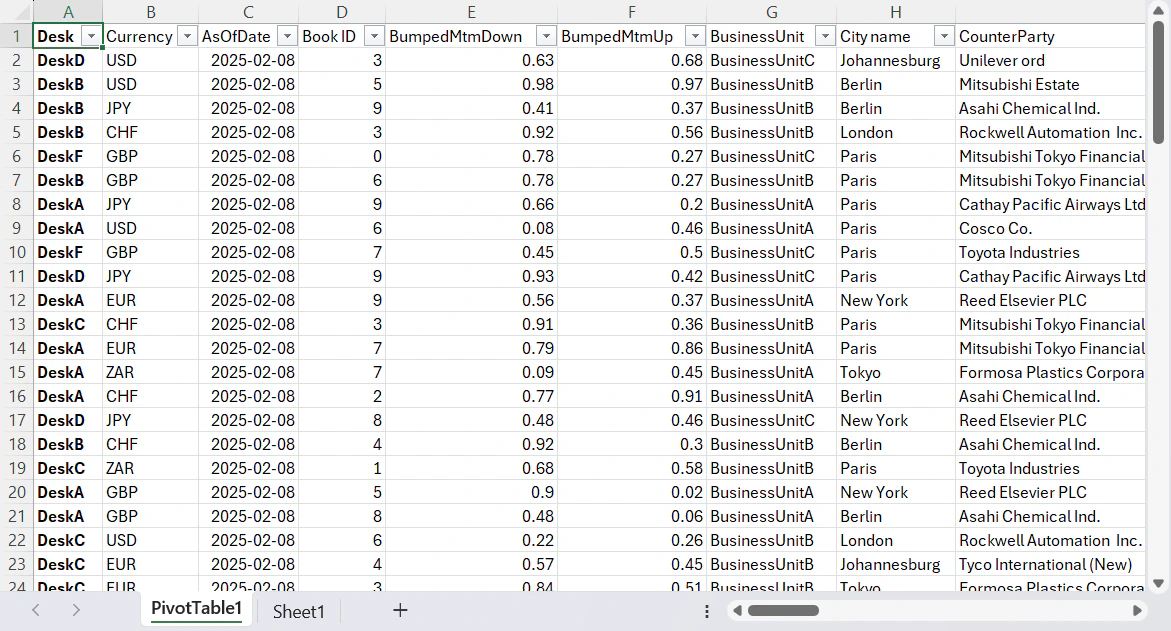
Datagrid Drillthrough
The datagrid drillthrough performs a drillthrough up to the first 100 rows of a selection and displayed it a popup that can be docked within the Excel window: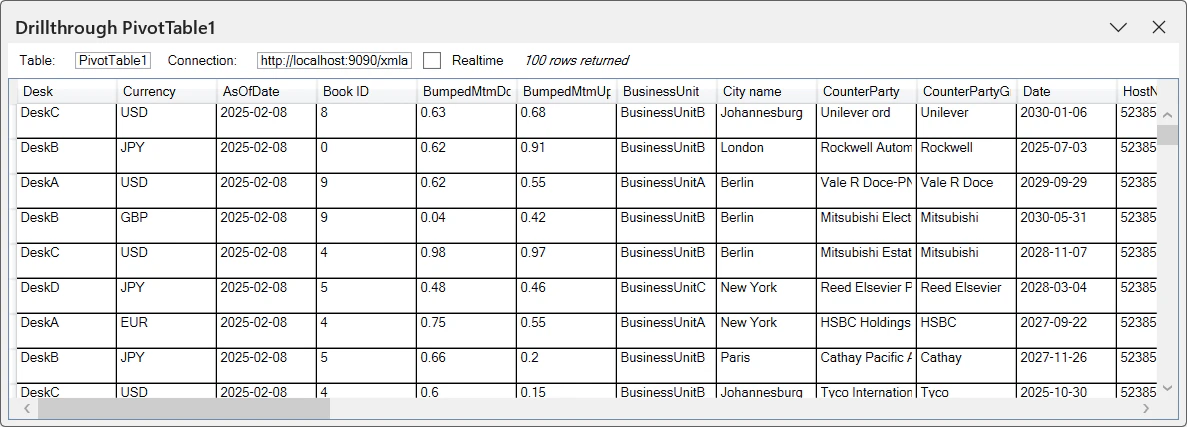
RealTime
The realtime button enables the update of the data in real-time. The refresh interval can be modified in the configuration settings. The minimum and default value is 500ms.Context Values
When a pivot table cell is selected, the context values for that specific pivot can be viewed and manipulated in a popup by selecting the ‘Context Values’ button in the ribbon. Uninitialized context values can be set by selecting them from the drop-down menu and pressing the ‘Initialize’ button. Context values can be unset by selecting the ‘Remove’ button. Some context values (e.g. reference currency) will always have a value set for them, so will reappear in the list with a default value if removed. To confirm any changes you want to be submitted to the cube select the ‘Apply Context’ button. The ‘Clear Cache’ button clears the internal context values cache held by the add-in and re-requests the values from the cube,so this will cancel any changes you have made but not applied. Close the window when you are done.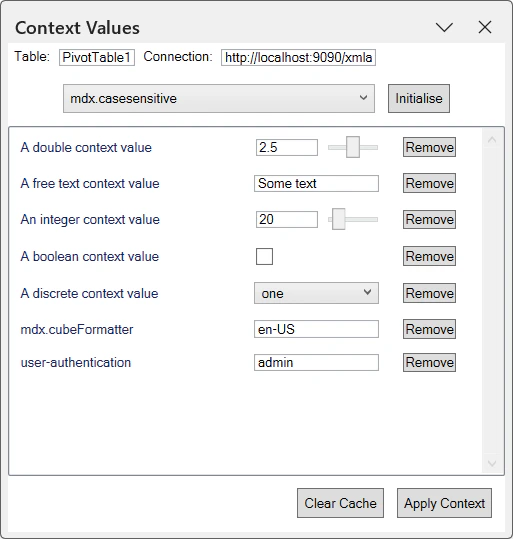
MDX Viewer
The Mdx viewer button displays the current MDX query made by the pivot table in a drawer at the bottom of the Excel window.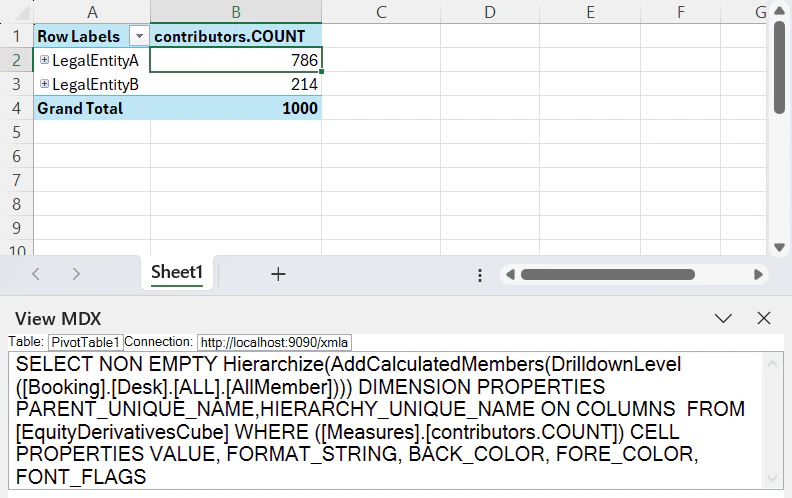
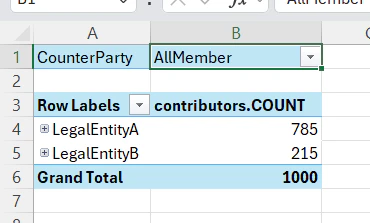
Hierarchy Navigation
Filters can be applied to a pivot table, and these are then displayed in the pivot table.