Using DoctorPivot
Accessing DoctorPivot within your project
With your project running, access the DoctorPivot Web App by visiting
{project_url}/doctorpivot, or the URL you set in the configuration
above. So for FRTB, for example, you would go to
FRTB_Accelerator/doctorpivot.
Navigating the UI
For more information, use the Application Wizard to guide you through the sequence of exploring the measures.
UI controls for exploring cubes and measures
This section describes all the buttons, dropdown menus and other menu items that are provided within DoctorPivot to enable you to effectively mine and display information regarding the measures you are interested in.
| Action | What to do in the UI |
|---|---|
| Select a cube | Use the Cube selector dropdown, or start typing the appropriate cube name, allowing DoctorPivot to auto-complete the name for you. |
| Select measures | With the cube selected, the measures can be explored. Use the Measure Selector dropdown menu, or simply start typing. DoctorPivot will auto-complete the measure names for you if you are not entirely sure what you are looking for. You can select as many measures as you like. The measures are displayed in the measure tree. |
| Select hidden measures | Some measures are hidden, which means that they are not meant to be seen in your Atoti Server project. Although these hidden measures are actually displayed in your measure trees, by default they cannot be selected by DoctorPivot. To override this, select the Allow selection of hidden measures checkbox. Separate counts of hidden and visible measures are now displayed. For more info, see Hidden measures |
| Change orientation | Click the Orientation button. For more info, see Orientation |
| Add parent measures | Click the parent measure to add it to the tree. To add all parents of the current measure to the tree, click All Parents. For more info, see Parents |
| Focus on the current measure | As clicking on keys like All Parents (and other actions) can potentially add many new measures all at once, it’s easy for the tree to rapidly grow large and complicated. To help simplify this, click Isolate to immediately focus on the currently selected measure and its children. |
| Remove measures | Click the X for the specific measure to remove it from the tree. |
| View Javadoc | Click Javadoc for the currently highlighted measure. |
Orientation
The orientation determines whether the current measure (or set of current measures) being explored will appear at the top of the display with the descendants being shown at the bottom or the other way round. The Orientation button toggles between the two different orientation states.
Measure details
Whenever a measure is selected, all its details are displayed in a format that is easy to digest and understand on the Measure Details card as detailed below.
Arrows and color-coded measures
In all DoctorPivot measure trees, the arrows lead from child measures to parent measures, indicating the flow of data. Measures are displayed with the following color-coding:
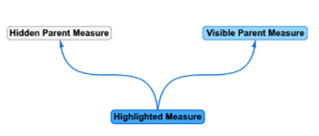
- The currently selected measure is highlighted in dark blue, with bold text.
- Visible measures are displayed in a paler blue.
- Hidden measures are shown in grey.
Hidden measures
Hidden measures are indicated in grey in the selector, tree and details card. This means they are not visible in the Atoti Server project, but instead only serve other visible measures.
By default, you cannot add hidden measures to your selection, but this can be reversed by selecting the Allow selection of hidden measures option. Hidden measures will always appear in the tree regardless of this setting.
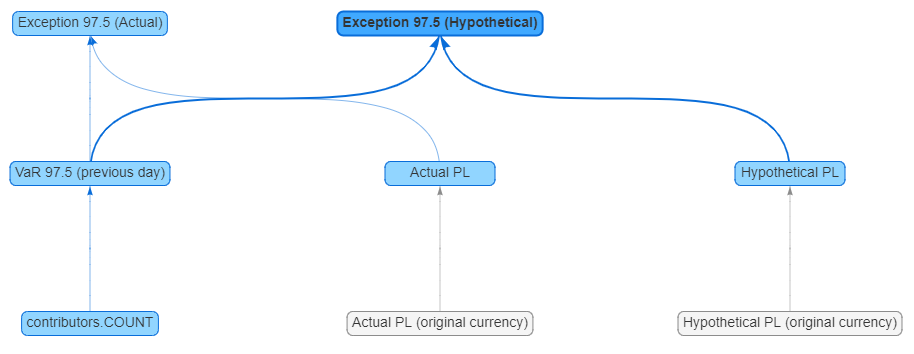
In the example below:
- The hidden measures
Actual PL (original currency)andHypothetical PL (original currency)can be easily identified, because they are displayed in grey. - The current measure
Exception97.5(Hypothetical)is shown in dark blue, with bold text. - The remaining five measures, referred to as the visible ones, are displayed in paler blue.
Viewing hidden measures
-
Beneath the Measures selection field, select the checkbox Allow selection of hidden measures.
The count of hidden measures is now also displayed, alongside the one for visible ones.
Example
This section provides an example of using DoctorPivot for obtaining, expanding, and refining the display of measure chains on the screen. The example is drawn from the FRTB Accelerator Project, using the Standardised Approach cube.
Selecting the measure
- Start typing Equity Delta Sensitivities in the cube selection window. DoctorPivot will auto-complete and present a list of measures as shown below.
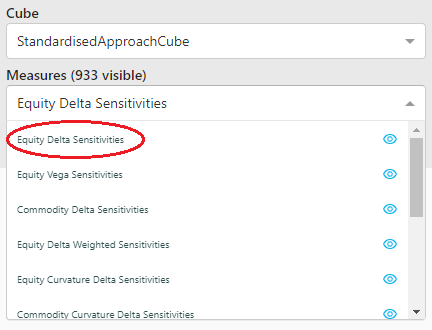
- Click Equity Delta Sensitivities. The following measure tree is displayed.

- (Optional) Click the Orientation button to invert the tree and display the selected measure at the bottom. You can click the Orientation button again to toggle the tree back to its original order.
Viewing the measure details
While Equity Delta Sensitivities remains as the current measure the Measure Details card is displayed:
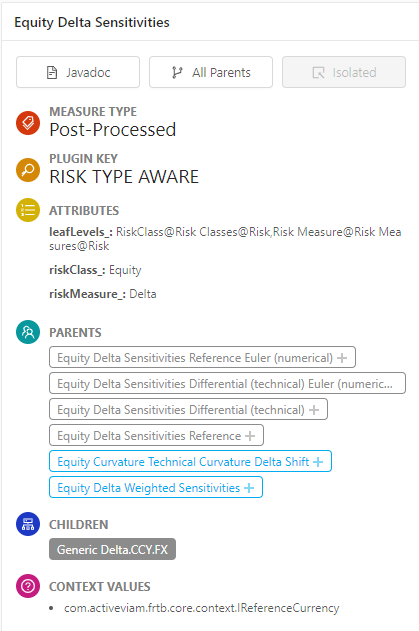
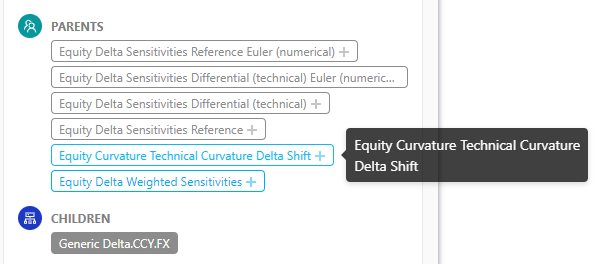
You can now click any measure within the PARENTS section to add this measure to the measure tree. The selected
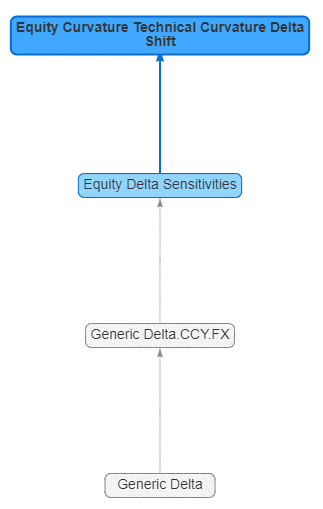
measure becomes the current measure. For example, clicking the measure Equity Curvature Technical Curvature Delta Shift selects it as the current measure.
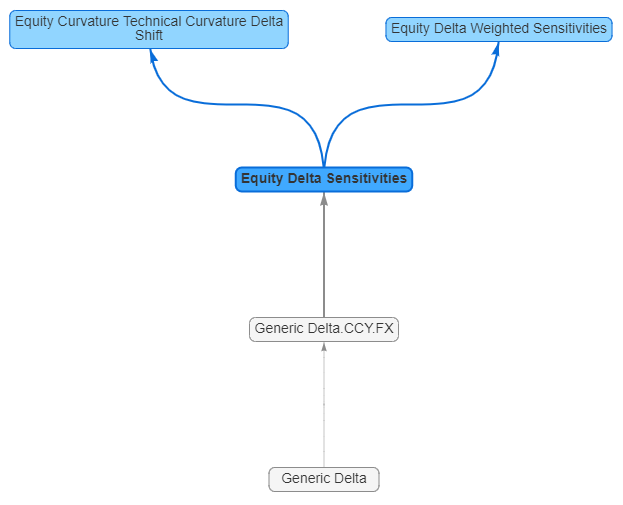
The following tree is displayed:
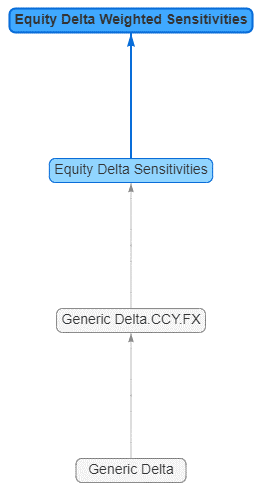
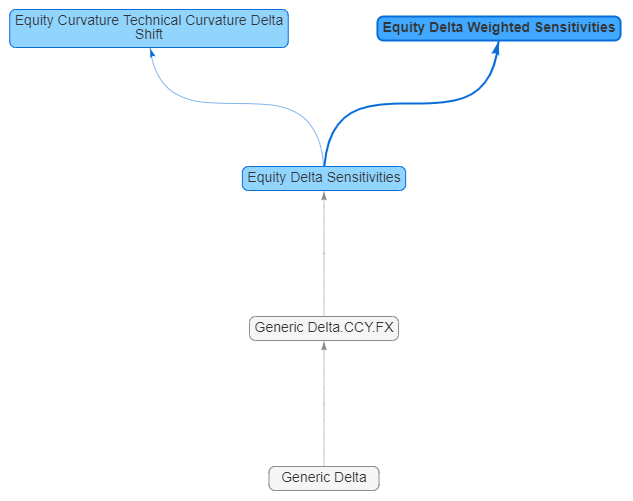
If you then click the Equity Delta Weighted Sensitivities, the tree is updated, as shown below. Equity Delta Weighted Sensitivities is now highlighted to indicate that it is the current measure.
Now if you click Equity Delta Sensitivities again:
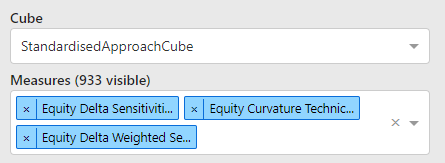
The Selection panel will look like this:
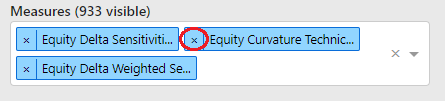
Removing measures
Click the X next to the Equity Curvature Technical Curvature Delta Shift to remove this measure from the tree.
The focus is now on Equity Delta Weighted Sensitivities and this becomes the current measure: