Sensitivity ladders
The purpose of the sensitivity ladder is to increase the PnL calculation accuracy by computing the sensitivities at different market configurations.
Input data
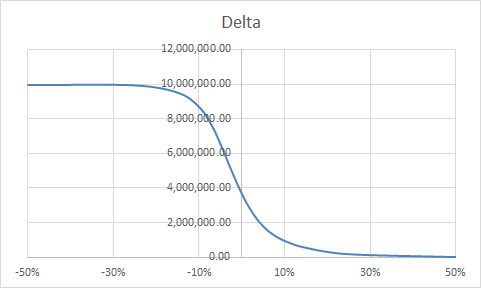
The system is fed with a table of sensitivities shifted from the current market value.
For instance:
| Shift | Delta | Gamma |
|---|---|---|
| -50% | 9,944,227.53 | -0.00019762 |
| -25% | 9,924,531.37 | -492,746.23 |
| -15% | 9,501,104.56 | -6,432,540.09 |
| -10% | 8,668,816.62 | -18,453,313.35 |
| -7% | 7,569,003.25 | -33,894,475.23 |
| -5% | 6,499,116.86 | -42,468,327.80 |
| -3% | 5,306,289.78 | -44,427,553.97 |
| -1% | 4,157,778.67 | -41,418,870.50 |
| 0% | 3,633,050.69 | -38,673,906.17 |
| 1% | 3,153,644.65 | -35,250,054.12 |
| 3% | 2,353,529.88 | -27,317,737.12 |
| 5% | 1,765,164.79 | -19,914,252.52 |
| 7% | 1,348,405.85 | -14,333,377.94 |
| 10% | 934,996.82 | -9,143,072.19 |
| 15% | 539,326.70 | -5,111,151.27 |
| 25% | 171,999.71 | -2,095,135.72 |
| 50% | 2,613.78 | -59,994.40 |

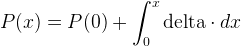
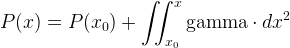
Calculation theory
The purpose is to calculate the price based on the delta or gamma.
As we have:
We will have
and also
Discrete calculation
Delta effect
We will sum the surface under the delta curve. The delta curve is formed by taking the closest delta value to 0.
In our sample:
- Between -3% and -1% we take delta of -1%
- Between -1% and 1% we take delta of 0%
- Between 1% and 3% we take delta of 1%
- Between 3% and 5% we take delta of 3%
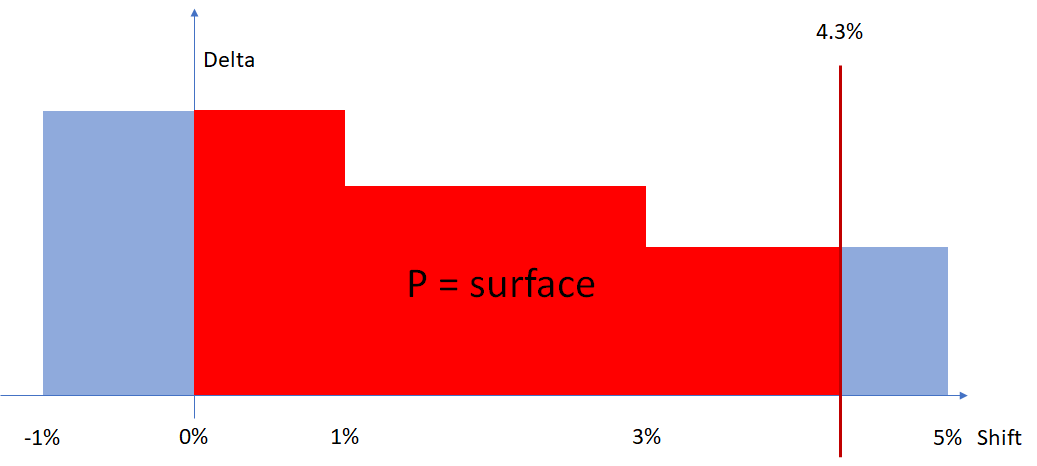
So for PNL(4.3%) we will have the sum of:
- Between 0% and 1% : 1% x delta of 0%
- Between 1% and 3% : 2% x delta of 1%
- Between 3% and 4.3% : 1.3% x delta of 3%
Gamma effect
The gamma expresses the slope of the delta curve.
It is sampled in the same way as delta.
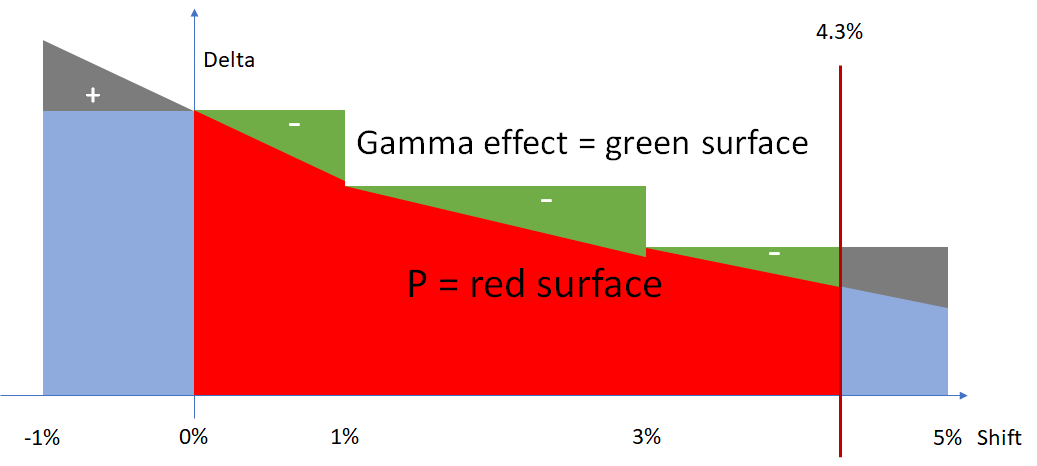
So for the gamma part of the PNL(4.3%) we will have the sum of:
- Between 0% and 1% : square of 1% x gamma of 0% divided by 2
- Between 1% and 3% : square of 2% x gamma of 1% divided by 2
- Between 3% and 4.3% : square of 1.3% x gamma of 3% divided by 2
note
The gamma can be implied by taking the slope between two deltas.
Implementation
Input files
Ladder pillar definition
| Column name | Content | Sample |
|---|---|---|
| RiskClass | The name of the risk class the ladder is intended to be used for | Equity |
| ShifType | The type of shift used to construct the ladder: * S = Spot => Si = Li * A = Absolute =>Si = Li + S * R = Relative => Si = (Li + 1) * S |
R |
| Scale | The ladder scale to use. | -0.5;-0.25;-0.15-;-0.1;-0.07;-0.05;-0.03;-0.01;0;0.01;0.03;0.05;0.07;0.1;0.15;0.25;0.5 |
Ladder file
| Column name | Content | Sample |
|---|---|---|
| AsOfDate | The current working date. | 2018-09_28 |
| TradeId | The trade identifier. | EQ_FUT_Merck & Co. b661100e |
| RiskClass | The risk class. | Equity |
| RiskFactor | The name of the risk axis. | Equity_Merck & Co._Repo rate |
| TenorLabels | The list of the tenors. | 1Y;10Y |
| TenorDates | The associated dates. | |
| MaturityLabels | The list of maturities. | |
| MaturityDates | The associated dates. | |
| Moneyness | The list of moneyness. | |
| Ladder | The matrix of the ladder. | The 1Y ladders; The 10Y ladders |
Datastore
The ladder definition is stored as is in a standalone store.
The ladder files are stored in the Ladder datastore.
For a scalar model, each line is split by tenor, maturity, and moneyness according to the scalar model of data.
In the standard model, the lines are stored with the bucket expansion.
There is a relation between the TradeSensitivities store and the Ladder store. So for delta plus gamma the store will be joined twice.
Cube
The Ladder column is populated by native measures in the sensitivity Cube. The Cube will also have an analysis dimension on the ladder definition. So with an expand post-processor you can view the content of the ladder.
If there is no vanilla sensitivity, the ladder will not be displayed in the Cube.
warning
We also need two extra dimensions that display the actual presence of the ladder for the calculation.
Calculation logic
| Ladder | calculation |
|---|---|
| No | Standard calculation. |
| Yes | Calculation of the delta effect of the Ladder. |