Navigation :
test ../ test user-ref.html
User & Reference Guide
test ../ test getting-started.html
Getting started
test ../ test getting-started/about.html
- Using this guide
test ../ test getting-started/whats-new.html
- What's New
test ../ test getting-started/data-model.html
- Market Risk Data Model
test ../ test dashboards.html
Dashboards
test ../ test what-if.html
What-If Analysis
test ../ test limits.html
Limit monitoring
test ../ test sign-off.html
Sign-Off Approvals
test ../ test calculations.html
Calculations Guide
test ../ test configuration.html
Configuration files
test ../ test cube.html
Cube Reference
test ../ test cube/context-values.html
-
Context Values
test ../ test cube/enablemdstringdebug.html
-- EnableMDStringDebug
test ../ test cube/esconfidencelevel.html
-- ESConfidenceLevel
test ../ test cube/etgconfidencelevel.html
-- ETGConfidenceLevel
test ../ test cube/percentilebuckets.html
-- PercentileBuckets
test ../ test cube/shiftpercentile.html
-- ShiftPercentile
test ../ test cube/vaeconfidencelevel.html
-- VaEConfidenceLevel
test ../ test cube/varconfidencelevel.html
-- VaRConfidenceLevel
test ../ test cube/weightedvarlambda.html
-- WeightedVaRLambda
test ../ test cube/dimensions.html
-
Dimensions
test ../ test cube/measures.html
-
Measures
test ../ test datastore.html
Datastores
test ../ test input-files.html
Input file formats
test ../ test dev.html
Developer Guide
test ../ test dev/dev-release.html
-
Release and migration notes
test ../ test dev/dev-getting-started.html
-
Getting Started
test ../ test dev/dev-mr-application.html
-
The Market Risk Application
test ../ test dev/dev-libraries.html
-
Market Risk Libraries
test ../ test dev/dev-extensions.html
-
Extending Atoti Market Risk
test ../ test dev/dev-tools.html
-
Configuring tools and methodologies
test ../ test dev/dev-sign-off.html
-
Sign-Off
test ../ test dev/dev-whatif.html
-
What-If
test ../ test pdf-guides.html
PDF Guides
PercentileBuckets
Description
Number of buckets for the empirical distribution charts
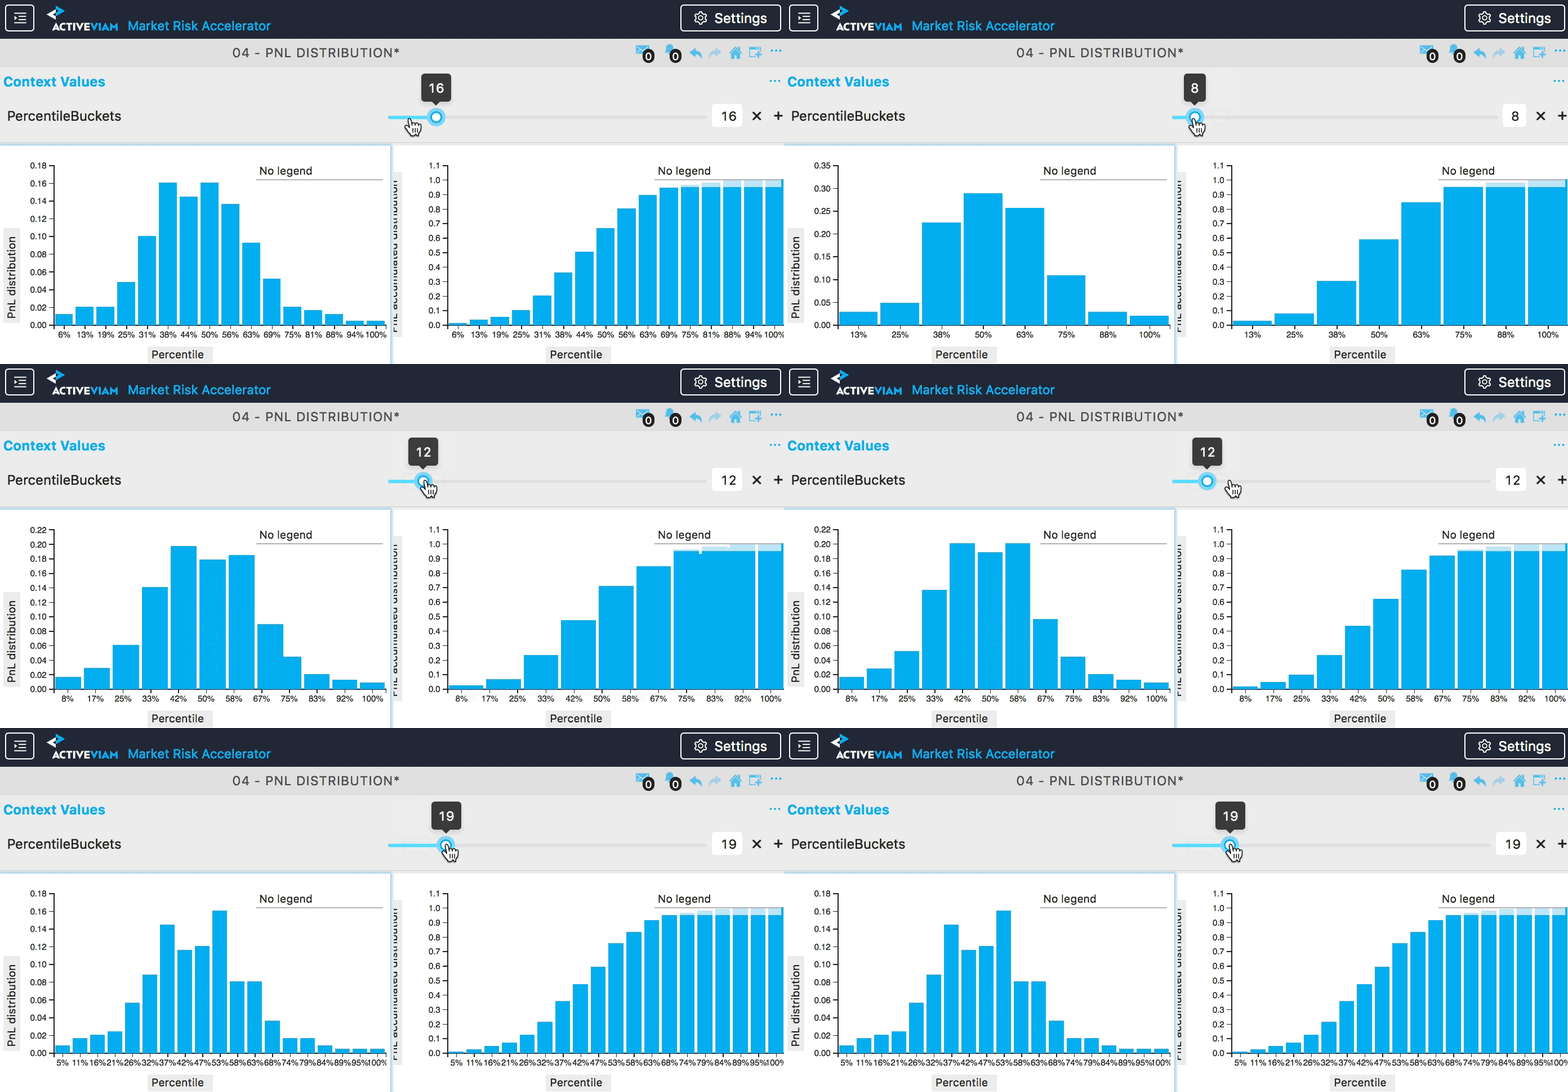
The “PercentileBuckets” context value enables you to control the number of buckets used by the distribution histograms.
The animation below of the “PNL Distribution” dashboard shows the “PercentileBuckets” context value. If a user changes it to, say, 10 then the PnL values are re-bucketed and the distribution charts updated.
