Data Sanity Check
In this section we provide an overview of the Data Sanity Check bookmarks.
Here’s a video walk-through on performing a data sanity check:
Validating Correctly-Loaded Data with the Data Sanity Check Dashboard
Atoti FRTB comes with a set of pre-defined bookmarks visualizing the risk metrics.
When you launch the application, you can see the list of bookmarks available to you on the left navigation bar. In this tutorial we will talk about the Data Sanity Check summary bookmark:
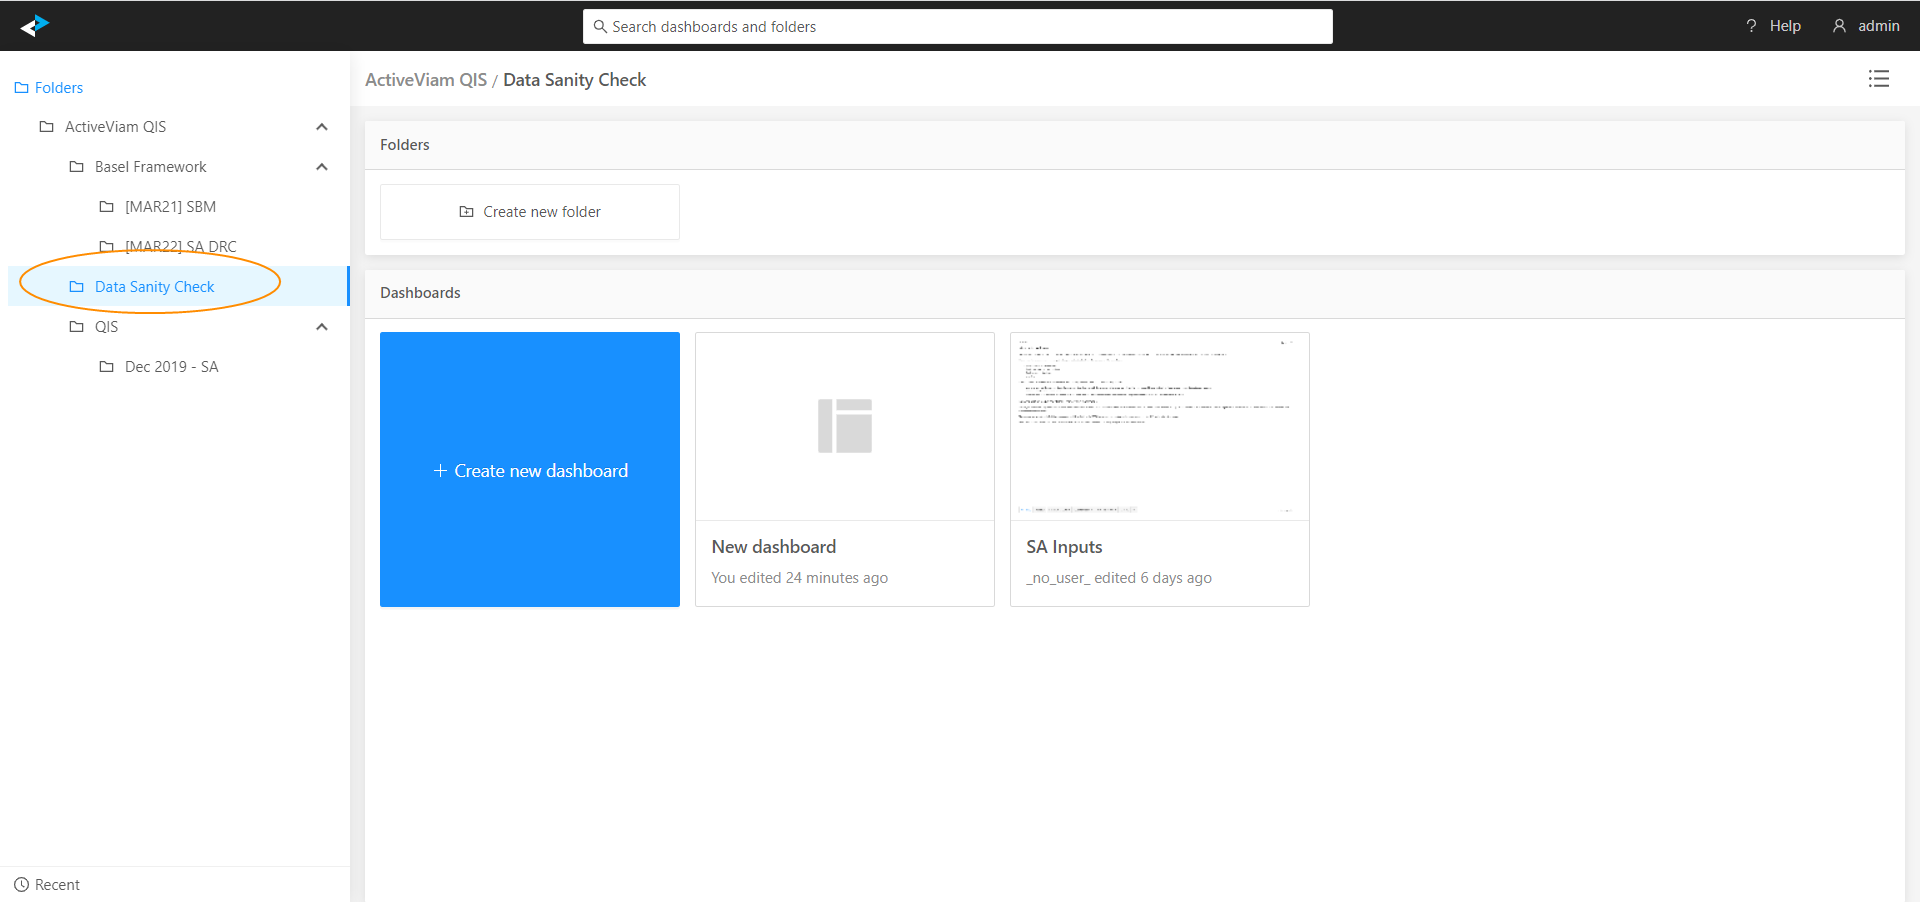
The Data Sanity Check bookmark gives you access to the SA Inputs dashboard.
SA Inputs dashboard
In this version of Atoti FRTB we have pre-configured views for checking the SA Inputs.
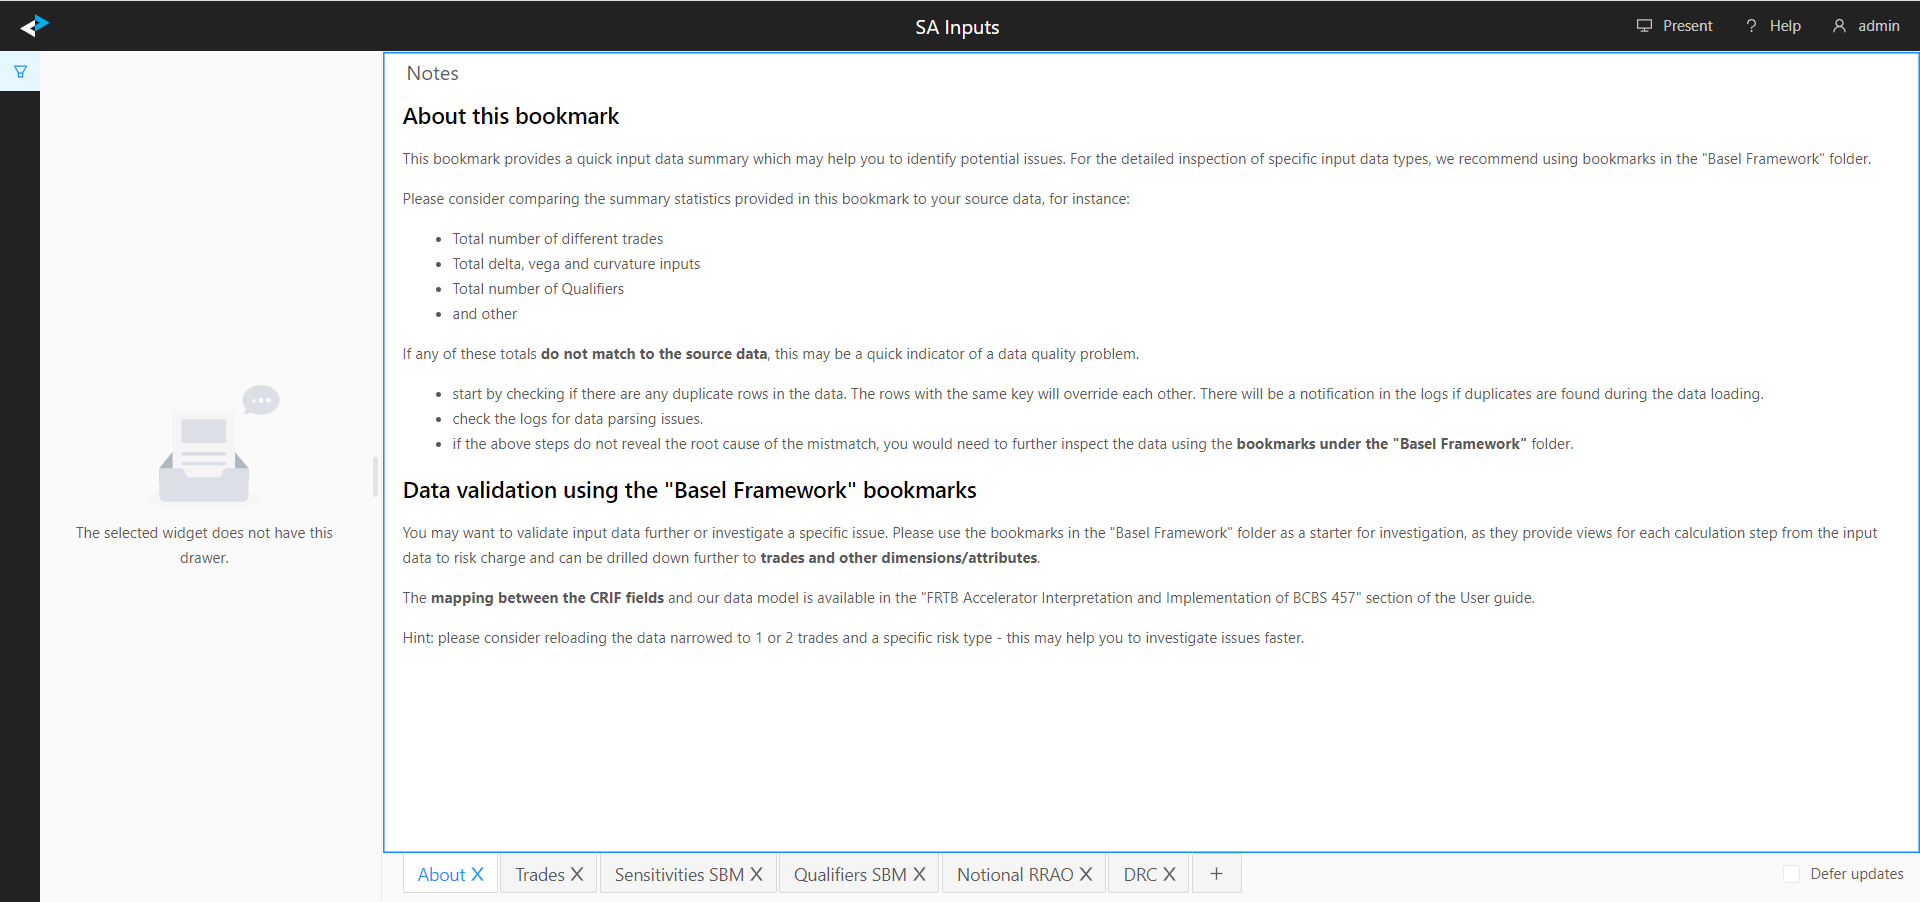
note
Although this dashboard helps you identify potential issues faster, checking these views does not guarantee that all input fields are populated correctly. The views in this bookmark can help to reveal file parsing errors and provide a quick input data summary.
| Tab | What to check |
|---|---|
| Trades | Review the total number of distinct trades and compare against that expected for different risk types. |
| Sensitivities | Compare the delta, vega totals. The totals must match the input files. If not, check for duplicate records, invalid static data or the FX rates you are using. |
| Qualifiers | Review the counted number of different underlyings for non-GIRR risk types and the number of different currencies for GIRR. These attributes represent the main component of the risk factor. Compare the counts against the expected. |
| Notional RRAO | Review the notional amounts sourced from the Trade Attributes file. |
| DRC | Review the Gross JTD summary for the DRC SA calculations. |
tip
To limit the scope of data and simplify analysis and investigation, consider setting a filter on a particular trade, book or attribute.
Further data validation
You may want to validate input data further or investigate a specific issue. For this, use the bookmarks in the “Basel Framework” folder as a starting point. They provide views for each calculation step from the input data through to the risk charge, and you can drill down further to trades and other dimensions or attributes.
If you have loaded the data using the Sensitivity files format, you can find the mapping between the CRIF fields and our data model in this section: Interpretation and Implementation of BCBS 457.
See also
- The user interface features in the Atoti UI User Documentation