Establishing the stressed period (ES Tool)
The FRTB Accelerator provides a tool that contains some of the technical features required to establish the stressed period, including:
- Cube with a desk dimension
- Datastore to hold the raw data with attributes including desk and P&L[double]
- Post-processor that implements a sliding window with an API for a pluggable strategy for extracting the loss (i.e. to compute an ES or a sum)
- Sufficient measures that allow the stressed period to be identified and visualised in ActiveUI
- Context value that determines the start and end dates of the sliding window
- Context value that determines the number of days to be used for the sliding window
Data, configuration, and postprocessors
Input Data
| Column name | Format |
|---|---|
| TradeId | String |
| AsOfDate | Date(yyyy-MM-dd) |
| Desk | String |
| PnLVector | Double[] |
Properties File
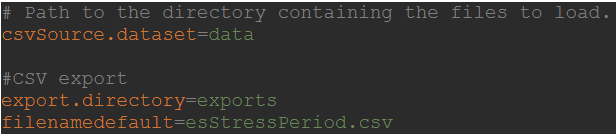
To configure the input file location, use the csvSource.dataset parameter in the frtb-es-tool properties file.
The configuration option for the export file location is also specified in the properties file as follows:
Output Data
| Column name | Format |
|---|---|
| AsOfDate | Date(yyyy-MM-dd) |
| Desk | String |
| ES Stress Period (PL Vector) | Double[] |
Context Values
There are two context values defined in the ES Tool Cube.
| Name | Default Value | Description |
|---|---|---|
| es | 97.5 | ES level |
| esStressPeriodSlidingWindow | 250 | Number of days to be used for the sliding window |
PostProcessors
There is one principal PostProcessor in the cube, ES_STRESS_PERIOD that takes as underlying measure the whole PL vector and returns an array containing three elements :
- Index 0, the calculated loss
- Index 1, the index of the first element of the sub vector containing the ES stress period
- Index 2, the sub vector containing the ES stress period
After that there is the ES_STRESS_PERIOD_RESUL_TYPE postprocessor that returns the element of an array at a given index. The measure ES Stress Period (PL Vector) uses that postprocessor with input parameter 2.
Visualising the ES Stress Period using the EST Tool
Deploy the war file into your Tomcat.
You can then view the ES Stress Period either via a REST call or in ActiveUI.
Rest Service
Example
ES Tool REST Service Information:
- The ES tool REST service works under Windows, Linux and OSX. Input strings for the generated file name are checked against a blacklist of substrings.
- For improved security in the /frtbestool/esstressperiod REST service, the “filename” parameter now facilitates the specification of sub-directories.
- The export.directory parameter is included in the frtb-es-tool.properties, and all files will be saved under this directory.
- A csv file will be generated containing the ES stress period.
The rest service executes a query MDX on the ES Tool Cube and saves the result in a csv file.
SELECT NON EMPTY {[Measures].[ES Stress Period (PL Vector)]}
ON COLUMNS,NON EMPTY Crossjoin([Dates].[Date].[AsOfDate].Members, [Desks].[Desks].[Desk].Members) ON ROWS
FROM [ESStressPeriodCube]
That query can be edited in frtb-es-tool.properties file, entry mdx.export.csv .
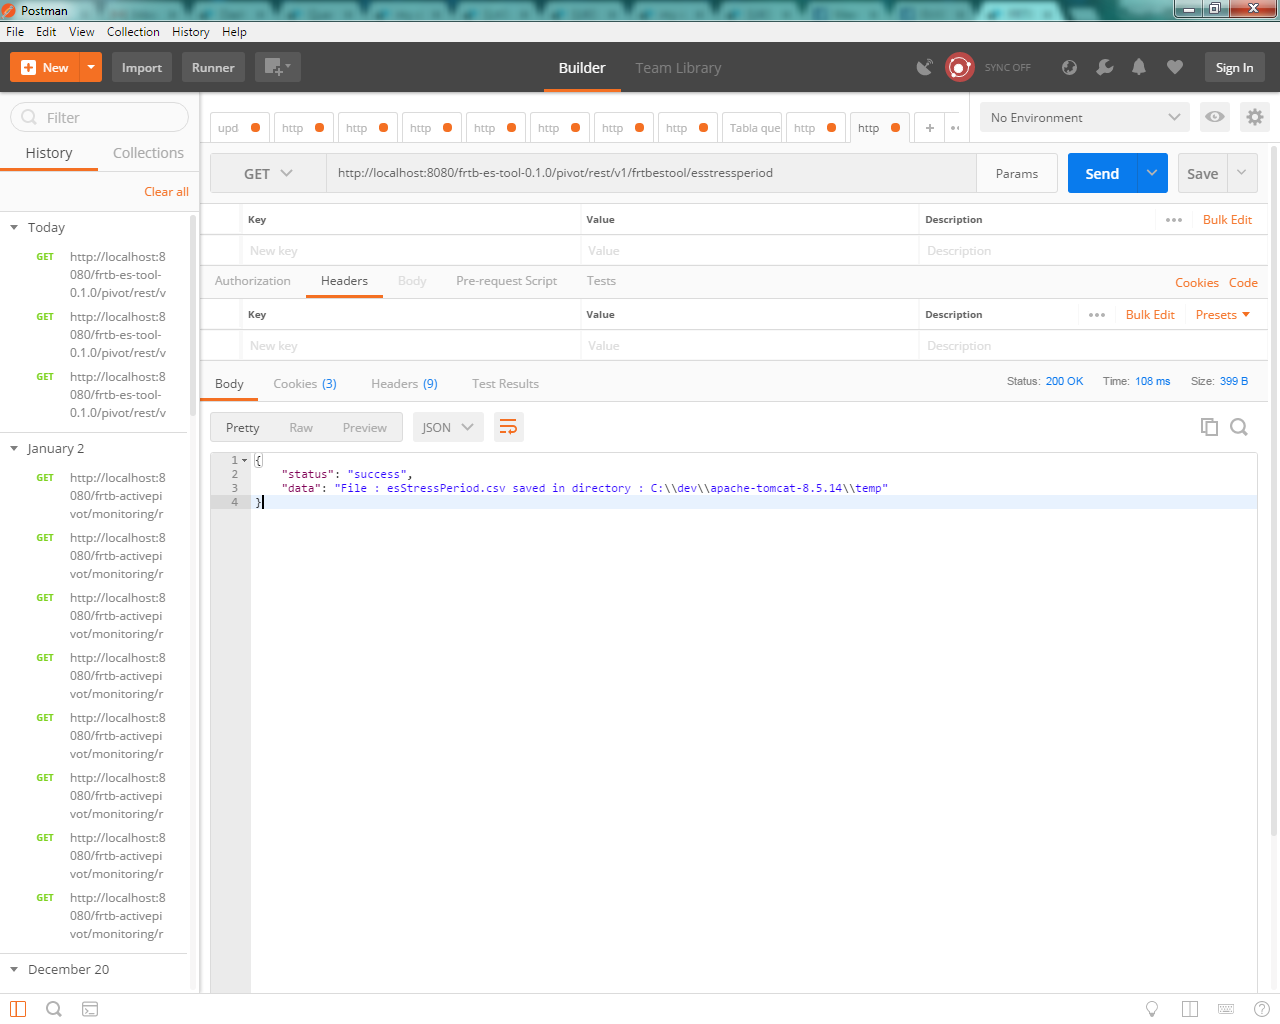
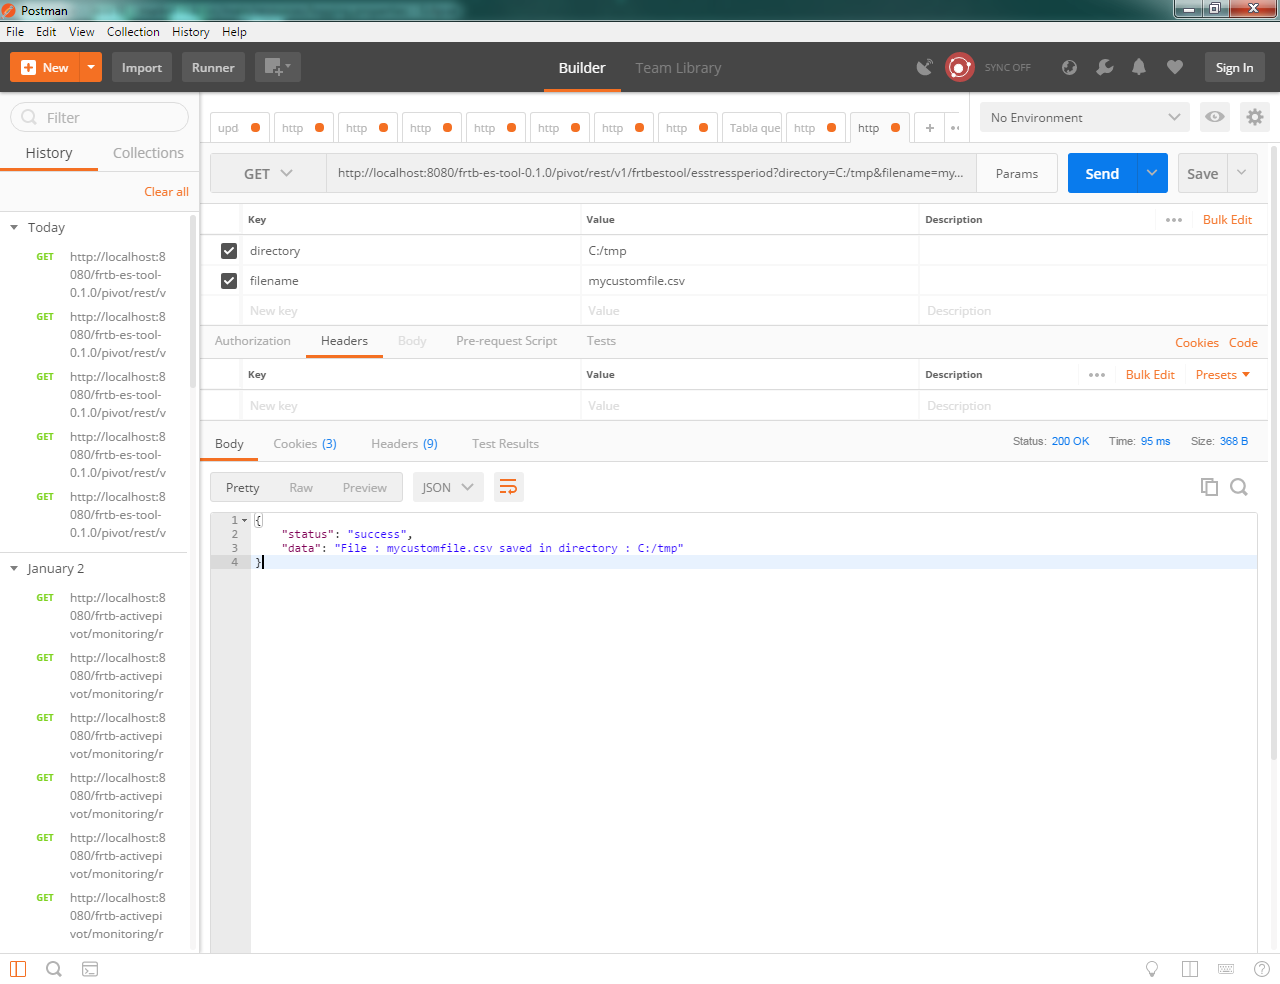
Call the GET rest service pivot/rest/v1/frtbestool/esstressperiod with optional parameters, filename and delimiter for the output csv file.
| Parameter | Default value |
|---|---|
| filename | esStressPeriod.csv |
| delimeter | , |
The following example shows a rest call without any parameter, using Postman:
And a call with parameters:
ActiveUI
You can visualise the ES stress period using measure “ES Stress Period (PL Vector)”.