Daily Change in Labels
Example
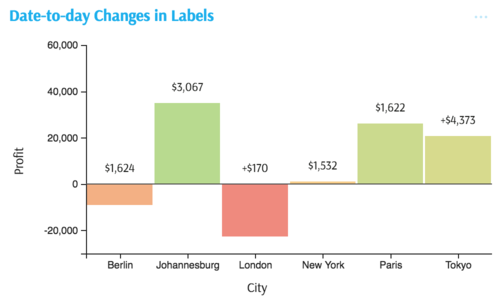
Summary of settings
- Type of chart: Columns
- Mapping of
yattribute: City - Mapping of
xattribute: Profit - Filters: Two historical dates selected
- Options → Common attributes → Text is mapped to a formula, calculating day-to-day difference
- Other effects:
- Positive changes with
+and expressed in units of currency:FORMAT_STRING = "+$#,##0;$#,##0" - Color scale applied to Columns (color mapped to Profit)
- Positive changes with
Step-by-step instruction
- Add new Chart Widget
- Select Columns
- If there are multiple cubes connected to your application, you must select the cube you want for the chart.
- To map the
xattribute, select the groups you would like to see on the vertical axis, in this case the City dimension - To map the
yattribute, select the value (measure) corresponding to the horizontal axis, in this example Profit.
The chart displays with axes mapped:
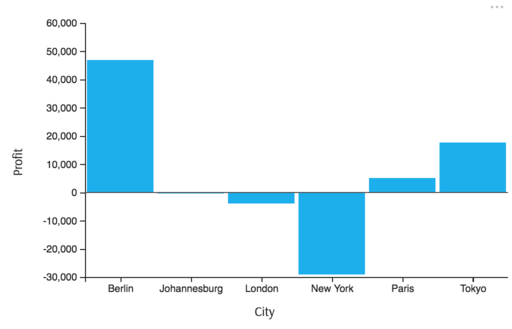
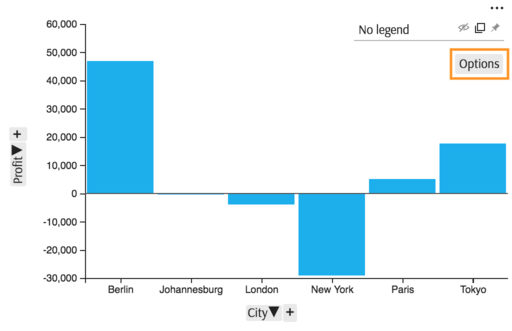
To display day-to-day changes next to each of the columns, click Options in the legend area of the chart:
In the Options popup, find attribute Text and map it to a formula (see below).
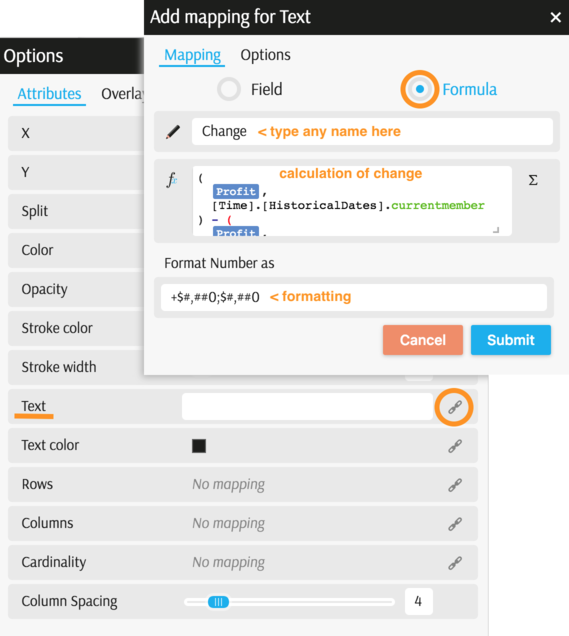
Notice in the above screenshot the format applied to the newly created measure. Positive changes will be displayed with
+for better readability (Formatting).The formula computes the difference between profit as of most recent date (
CurrentMember) and profit as of previous date selected (NextMember, since dates are normally sorted in reverse order). Therefore, for the purpose of this example, select two consecutive dates using filters.( [Measures].[Profit], [Time].[HistoricalDates].CurrentMember ) - ( [Measures].[Profit], [Time].[HistoricalDates].CurrentMember.NextMember )The chart with the formula mapped to Text:
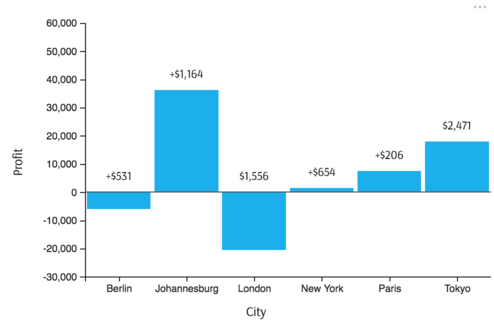
Finally, assign colors of the columns. Go back to Option popup (in the Legend) and map Color to Profit:
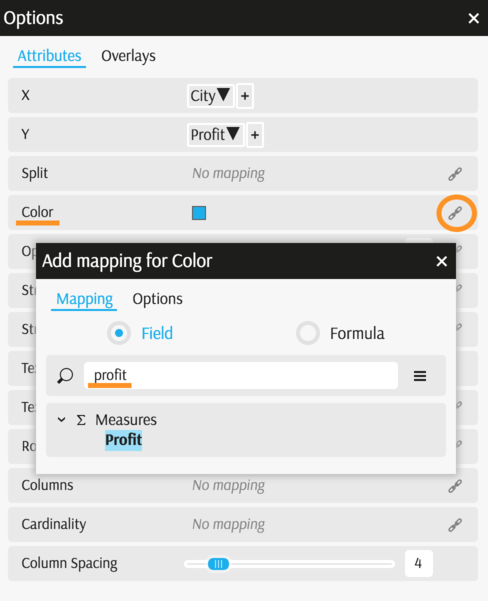
The chart is complete:

Back to Legacy Chart Gallery
Appendix
The appendix contains code snippets for advanced users.
MDX:
WITH
 Member [Measures].[Change] AS (
  [Measures].[Profit],
  [Time].[HistoricalDates].currentmember
) - (
  [Measures].[Profit],
  [Time].[HistoricalDates].currentmember.nextmember
), FORMAT_STRING = "+$#,##0;$#,##0"
SELECT
  NON EMPTY [Geography].[City].[City].Members ON ROWS,
  {
    [Measures].[Profit],
    [Measures].[Change]
  } ON COLUMNS
  FROM (
    SELECT
    Filter(
      [Time].[HistoricalDates].[AsOfDate].Members,
      IsDate(
        [Time].[HistoricalDates].CurrentMember.MemberValue
      ) AND (
        CDate(
          [Time].[HistoricalDates].CurrentMember.MemberValue
        ) >= CDate(
          "2018-05-08"
        ) AND CDate(
          [Time].[HistoricalDates].CurrentMember.MemberValue
        ) < CDate(
          "2018-05-10"
        )
      )
    ) ON COLUMNS
    FROM [EquityDerivativesCube]
  )
JSON:
{
  "configurations": [
    {
      "handlers": {
        /* ... */
      },
      "type": "combo-histogram",
      "mapping": {
        "x": {
          "from": ["[Geography].[City].[City]"]
        },
        "y": {
          "from": "[Measures].[Profit]"
        },
        "histogram@text": {
          "from": "[Measures].[Change]"
        },
        "color": {
          "from": "[Measures].[Profit]"
        }
      },
      "legend": {
        "display": "hidden"
      }
    }
  ]
}
