Atoti Concepts in a Nutshell
Online analytical processing (OLAP) is about getting as much useful information as possible out of business data while this data is rapidly and continuously changing.
What is Atoti?
Atoti by ActiveViam is a high performance data analytics platform with real-time capabilities and advanced data modeling.
It lets its users structure the business data into multidimensional cubes from which they can subsequently extract valuable insights, by means of sophisticated summaries and selective drill-downs.
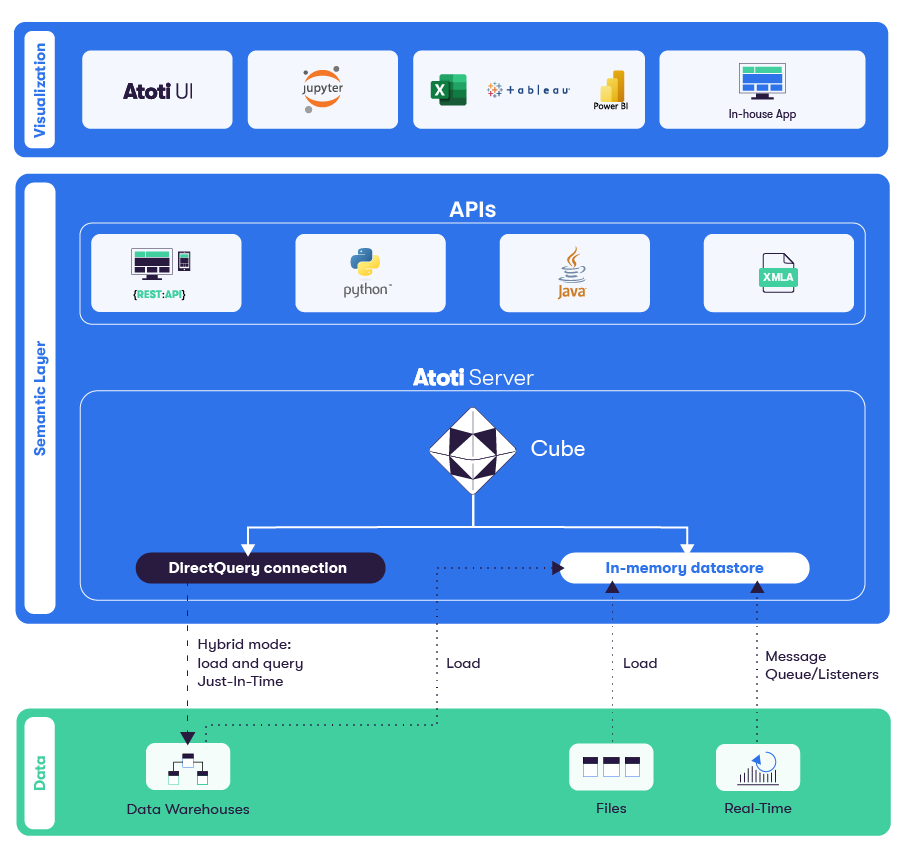
Atoti Server performs four key functions:
- Atoti Server aggregates data incrementally. The data can be updated incrementally and in real time so that only those sections of the cube that are impacted by a data change are refreshed. This represents a significant advantage as compared with traditional OLAP solutions that usually reload all data in the analytical environment and then re-compute all the metrics whenever the source data changes.
- Atoti Server computes complex measures. As an Atoti user, you have the ability to plug in your own business logic at every step of the aggregation process and manipulate complex measures. Atoti allows you to create new measures (some as simple as a standard deviation, some as complex as VaR and PFE/XVA) to help you understand and monitor your business. Measures are written in Java, meaning that any type of logic can be injected into the engine, including non-linear calculations. Atoti Server permits queries to run continuously and can generate real-time alerts on Key Performance Indicators (KPIs). This means that real-time analytics involving complex business logic can be deployed with ease.
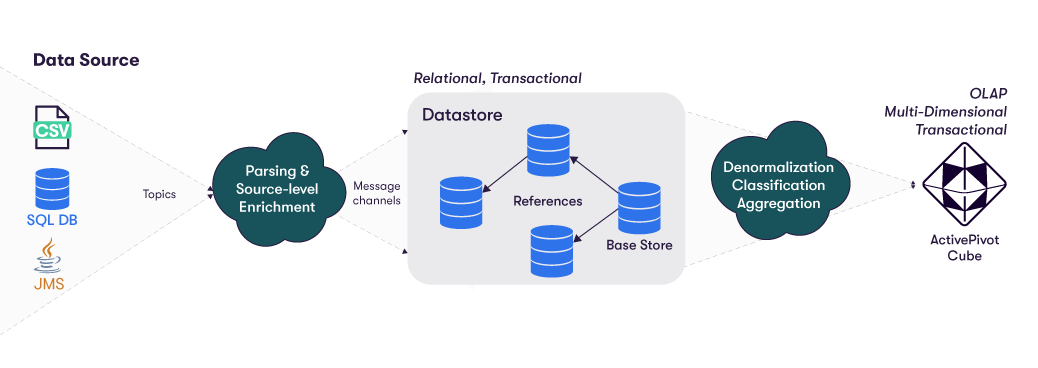
- The underlying data can either be loaded into Atoti Server, or directly fetched to answer a query. Atoti Server ingests and consolidates data coming from a variety of heterogeneous systems. It can load data from most sources, including CSV, databases, cloud storage and real-time messaging platforms, such as Kafka and JMS. It can also sit on top of an existing database, and act as a semantic layer, a query engine, and a cache provider.
- Atoti Server performs What-If analysis. In general terms, What-If Analysis is the process of changing the values in cells to see how those changes will affect the outcome of formulas on a worksheet. Conducting a what-if framework is beneficial in several ways. Not only can you make better and more informed decisions by changing assumptions and observing or estimating the results, you are also better able to predict the outcome of your decisions. In the context of Atoti, a user wishing to perform a simulation just needs to create a new branch and modify some data : all measures defined on the cube are immediately available on the branch and comparisons can be performed between branches.
Defining a cube
In a cube, data is organized in dimensions and measures. Each cube axis is defined by a Dimension, and acts as an axis of analysis. Measures mainly correspond to numerical data, aggregated along the axis of analysis.
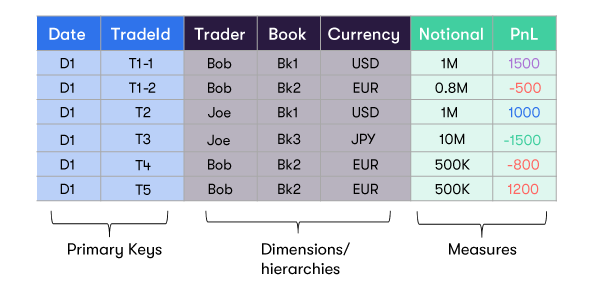
Attributes are exposed as dimensions/hierarchies within the cube. Measures are treated as an implied hierarchy for this purpose.
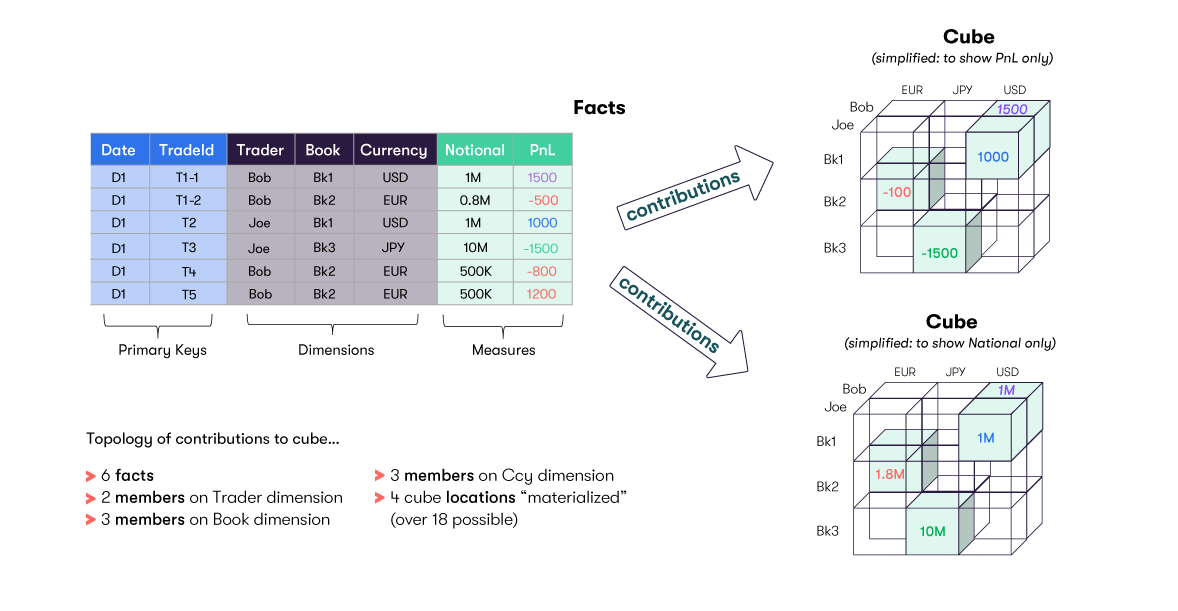
In our example, for simplicity, the resulting cube is shown separately for the 'Notional aggregations and for the 'PnL' aggregations. In reality, all the measures will exist in one cube.
By default, each cube axis has a top level classifier of ALL, which corresponds to the aggregation of all its nested members.
For each dimension/hierarchy, there will be a Location (containing aggregated values) for:
- Each individual member (Bob, Joe, etc.)
- The total across all members (AllMember)
This means that one can retrieve the value of any defined measure at any level of granularity, across every dimension of the cube.
The cube is configured in Java. There are practically no limits regarding how many dimensions, hierarchies,levels and measures the cube can contain.
Defining an indexed aggregate provider
An indexed aggregate provider is an Atoti Server component that acts as a Materialized View storing aggregated data. While a Just-In-Time aggregate provider will simply delegate any request for aggregated values to the underlying data, an indexed aggregate provider will store these aggregated values at load time, and keep them in sync with the underlying data. An aggregate provider will strongly speed up any query that it can answer to, at the memory cost of an additional data structure.
Creating Custom Measures
It is possible to create custom or post-processed measures in Atoti Server. This is a unique and key differentiator of Atoti. Post-processed measures are defined once and can be used at any location of the cube.
Most measures, including Native Measures, can be created using the Copper API.
Consider the calculation of the Value at Risk (VaR) from a Finance use case. The post-processed measure is defined once with one PostProcessor. However, it can be used and queried from any hierarchy - from an AllMember aggregate level, all the way down to the individual Trade or fact level.
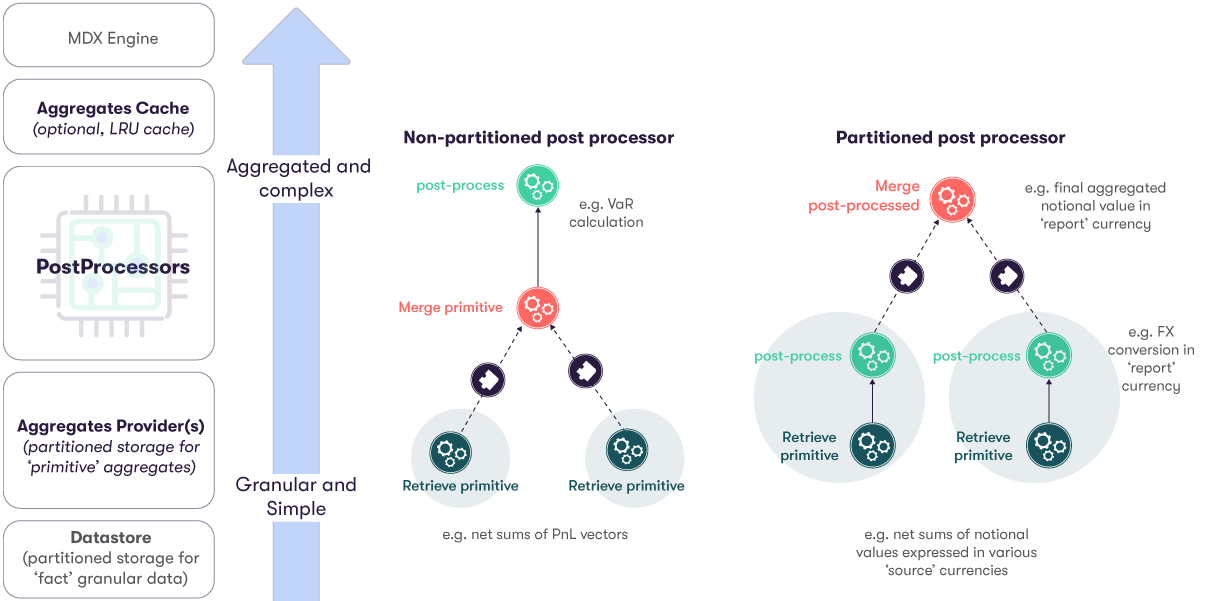
In the above diagram, the left-hand column lays out the various stages of data processing, from the underlying data, up to the MDX Engine.
This example showcases another key concept of Atoti: Partitioning.
Aggregate provider and custom calculations can be partitioned, allowing for the parallelization of both transactional loads and analytical queries.
Fact-level Data in an Atoti Project
Data that is not yet aggregated (in an indexed aggregate provider, or as part of a query) is referenced as fact-level data, or granular data.
The Datastore
It can be ingested, from multiple sources, and at the fact-level data, in the datastore.
The datastore is relational. Each record in the base table is called a fact. The facts can be enriched with data from other tables, linked through references. Each fact is published to the Atoti cube, along with its referenced data, in a single denormalized fact record. The fact is then aggregated into the cube and the indexed aggregate providers, the level of detail retained being defined by the cube configuration.
To better understand how to load data into the datastore, you can have a look at the Data Sources Introduction and Datastore transactions pages.
The Datastore uses many optimizations such as columnar storage, dictionarization, MVCC, partitioning across NUMA nodes and off-heap storage. Atoti Server is also able to load and store vectors (e.g. arrays of doubles) very efficiently, which is a key differentiator compared with other database technologies.
External Databases
Granular data does not necessarily have to be loaded in main memory, in the datastore. Instead, it is also possible to keep it in an external databases, and to let the cube delegate queries to the underlying database.
In such a setup, indexed aggregate providers are directly fed from queries against the external database, and cube queries that cannot be answered from any of the configured indexed aggregate providers will perform queries against the database.
Note that both systems can be used together, using the Composite Database, or using distribution.
Distribution
Atoti Server lets users create a distributed application, in which both data and calculations may be split across multiple cube instances. This provides both flexibility and scalability, allowing to query multiple different business applications from a single end-point, and allowing to ingest more and more data without having to change the underlying hardware.
Queries
Data can be retrieved in a structured manner from most of the Atoti Server components. It can be retrieved from a variety of compatible graphical interfaces, or be retrieved through MDX queries.
Our dedicated front-end, Atoti UI, is the interface we recommend.
It can also be programmatically retrieved, using database queries, or location based queries.