> ## Documentation Index
> Fetch the complete documentation index at: https://docs.activeviam.com/llms.txt
> Use this file to discover all available pages before exploring further.
# Tableau MSSAS connector
Tableau offers a Microsoft SQL Server Analysis Service connector. This connector can leverage the XMLA endpoint to connect to Atoti.
### Connecting to an Atoti Cube with the MSSAS connector.
The screenshots are from Tableau 2018.2. Start Tableau and click on Microsoft Analysis Services.
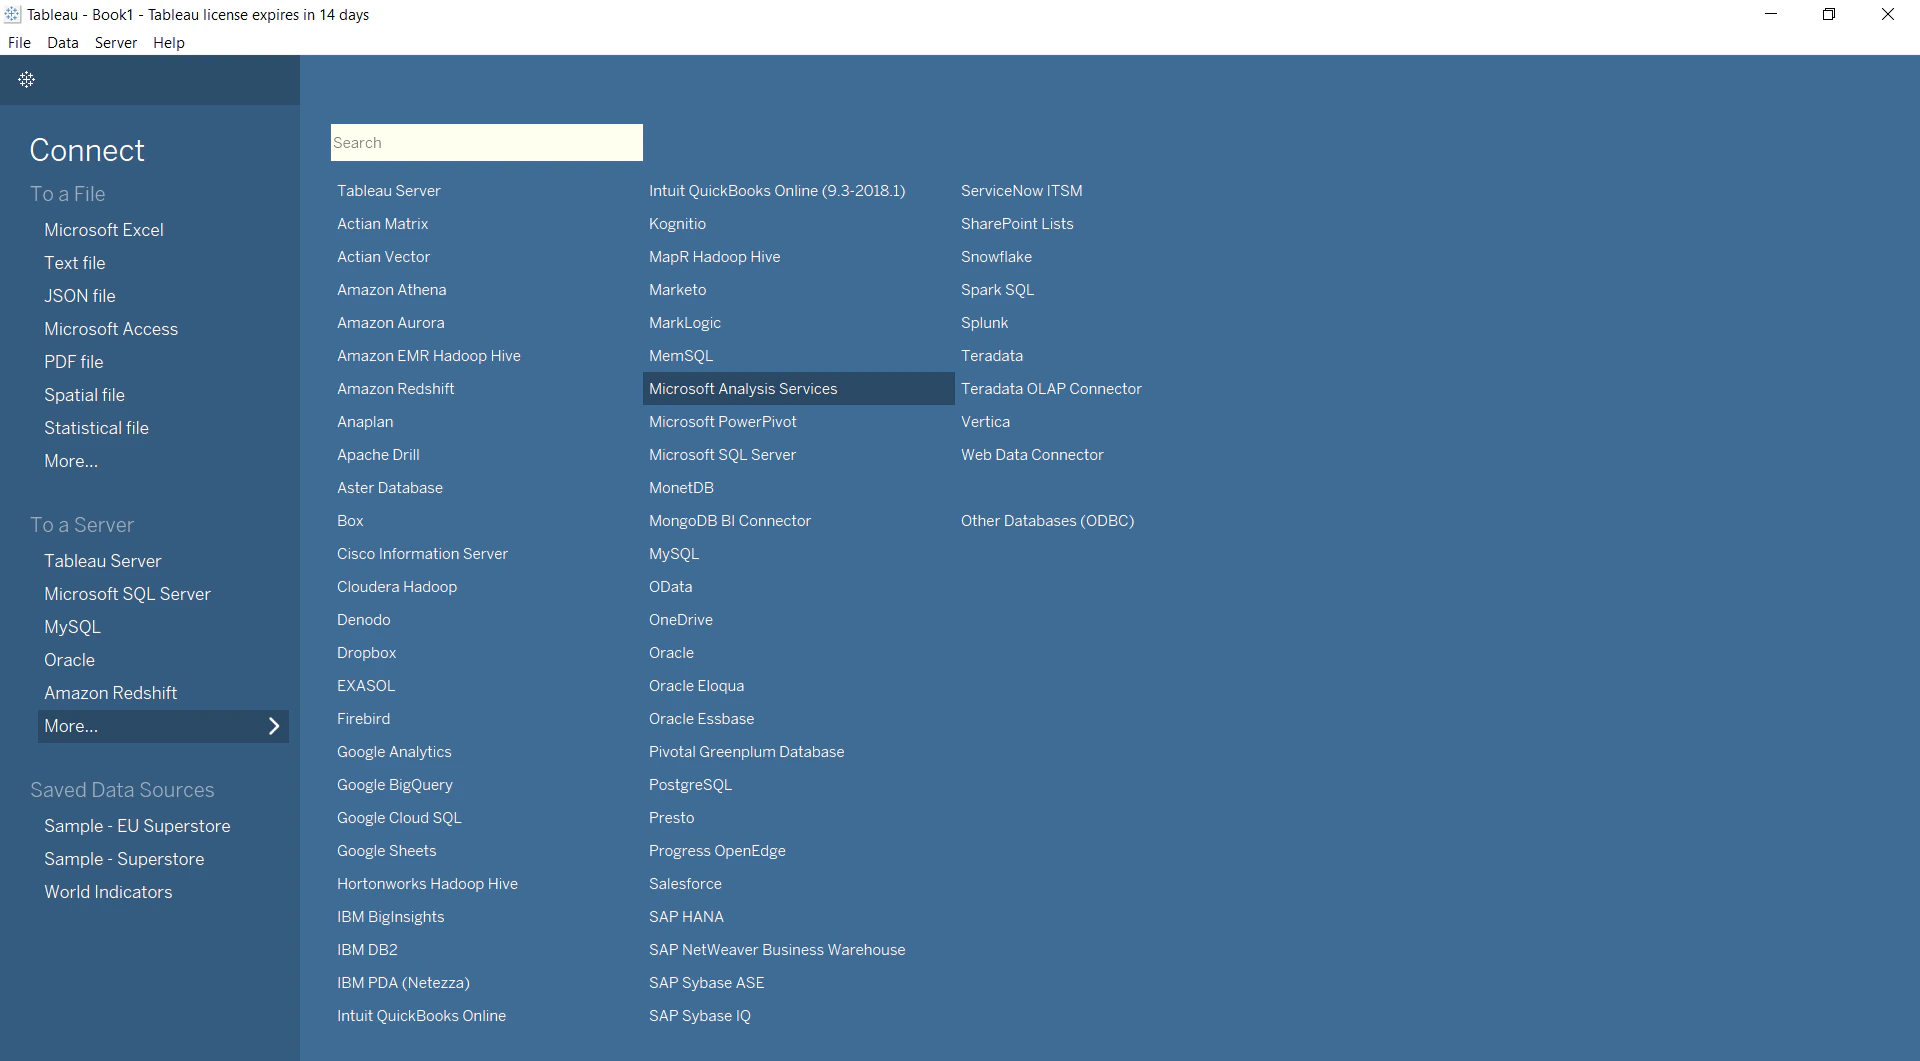 > If you are unable to see Microsoft Analysis Services in the list, please install drivers for
> 2014 SP1 (version 12.0.2000.8) from Tableau's
> [Driver Download page](https://www.tableau.com/support/drivers?edition=pro\&lang=en-us\&platform=windows\&cpu=64\&version=10.5&__full-version=10500.18.0305.1200#msolap).
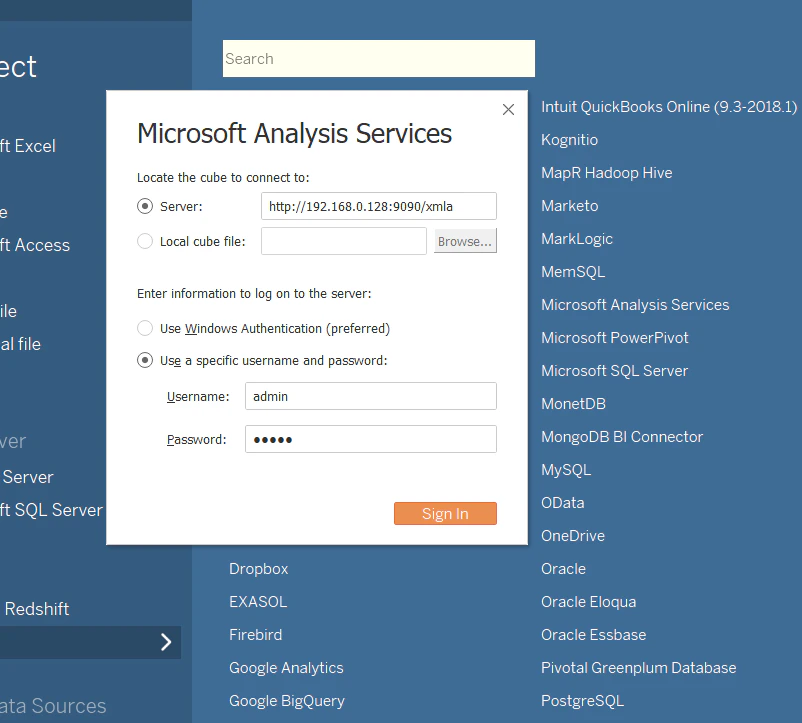
Enter the Atoti Server address (do not forget the `/xmla` that gives access to the XMLA servlet
which simulates a Microsoft Analysis Services answering Tableau's requests), and your
username/password as configured in Atoti.
> If you are unable to see Microsoft Analysis Services in the list, please install drivers for
> 2014 SP1 (version 12.0.2000.8) from Tableau's
> [Driver Download page](https://www.tableau.com/support/drivers?edition=pro\&lang=en-us\&platform=windows\&cpu=64\&version=10.5&__full-version=10500.18.0305.1200#msolap).
Enter the Atoti Server address (do not forget the `/xmla` that gives access to the XMLA servlet
which simulates a Microsoft Analysis Services answering Tableau's requests), and your
username/password as configured in Atoti.
 Once you are able to connect, you will see the Cubes as below:
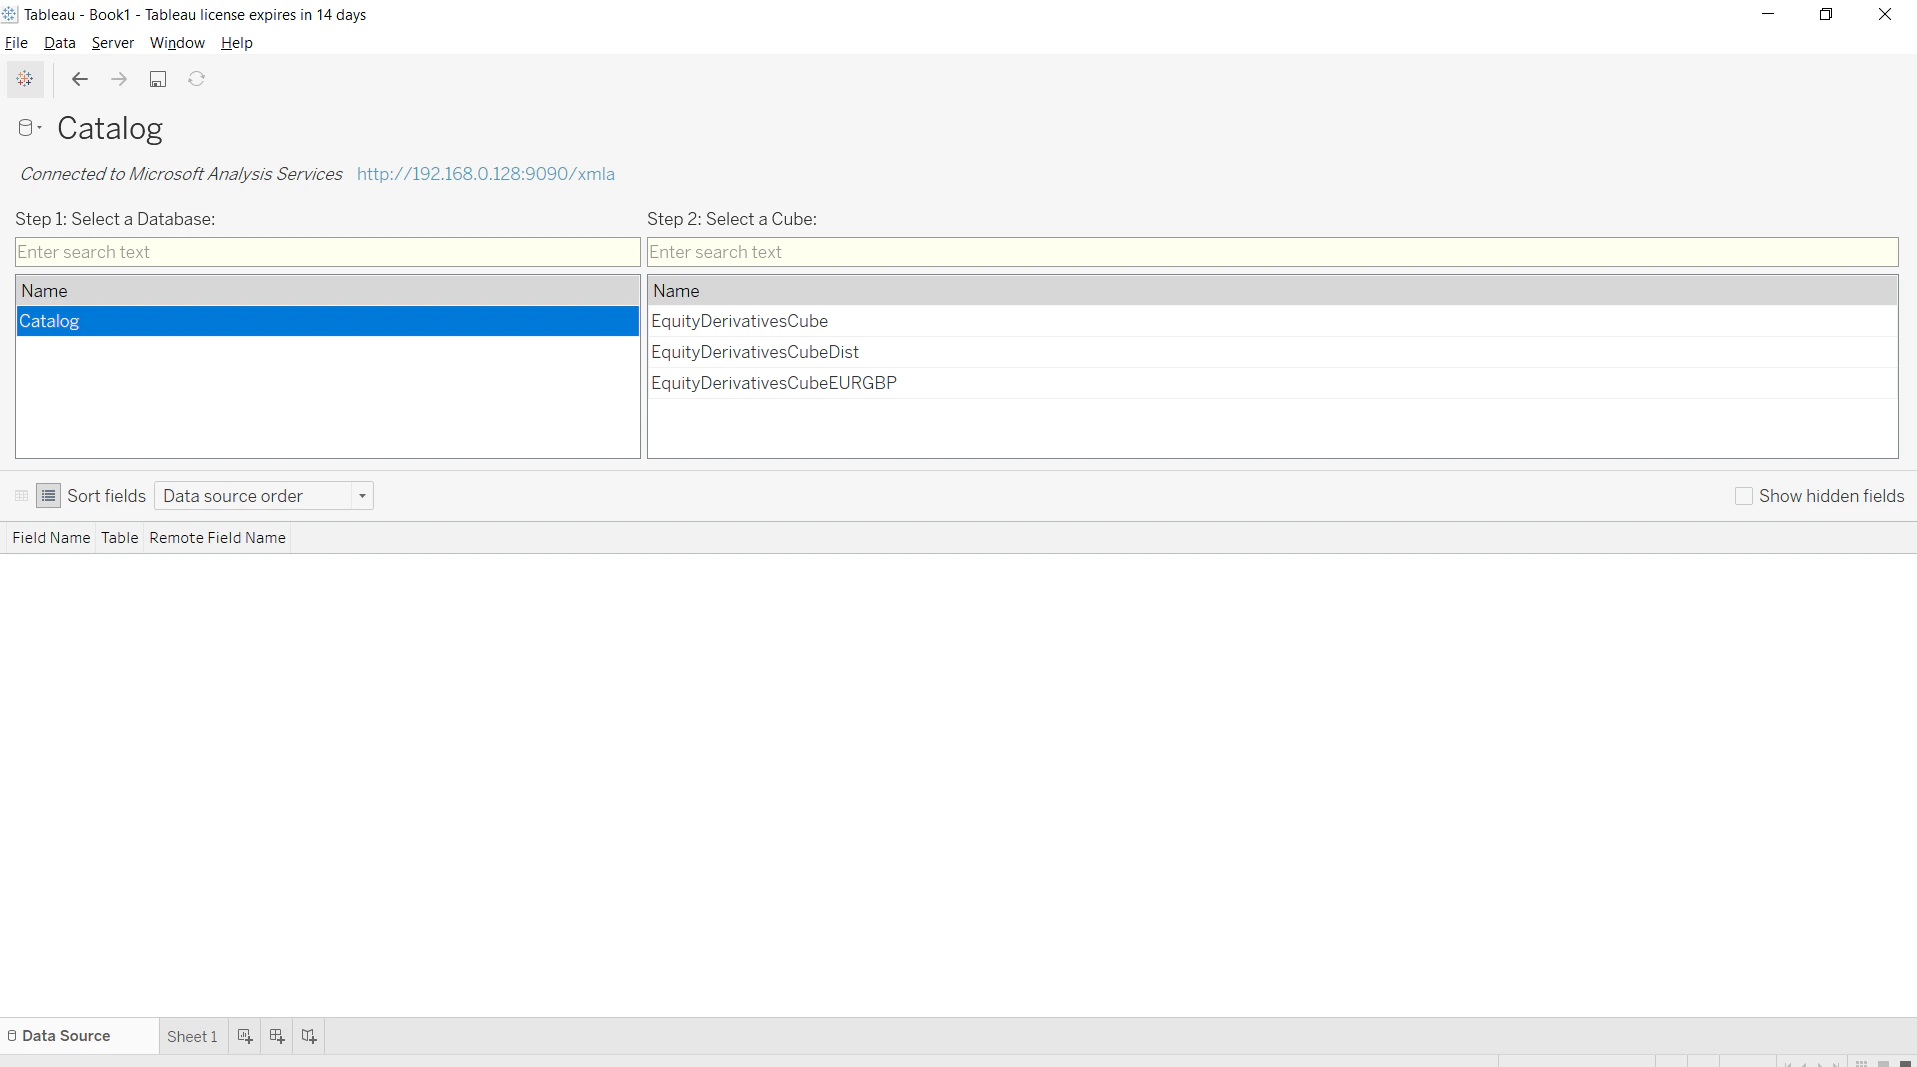 Select the Cube you are interested in, it will then show the dimensions and measures:
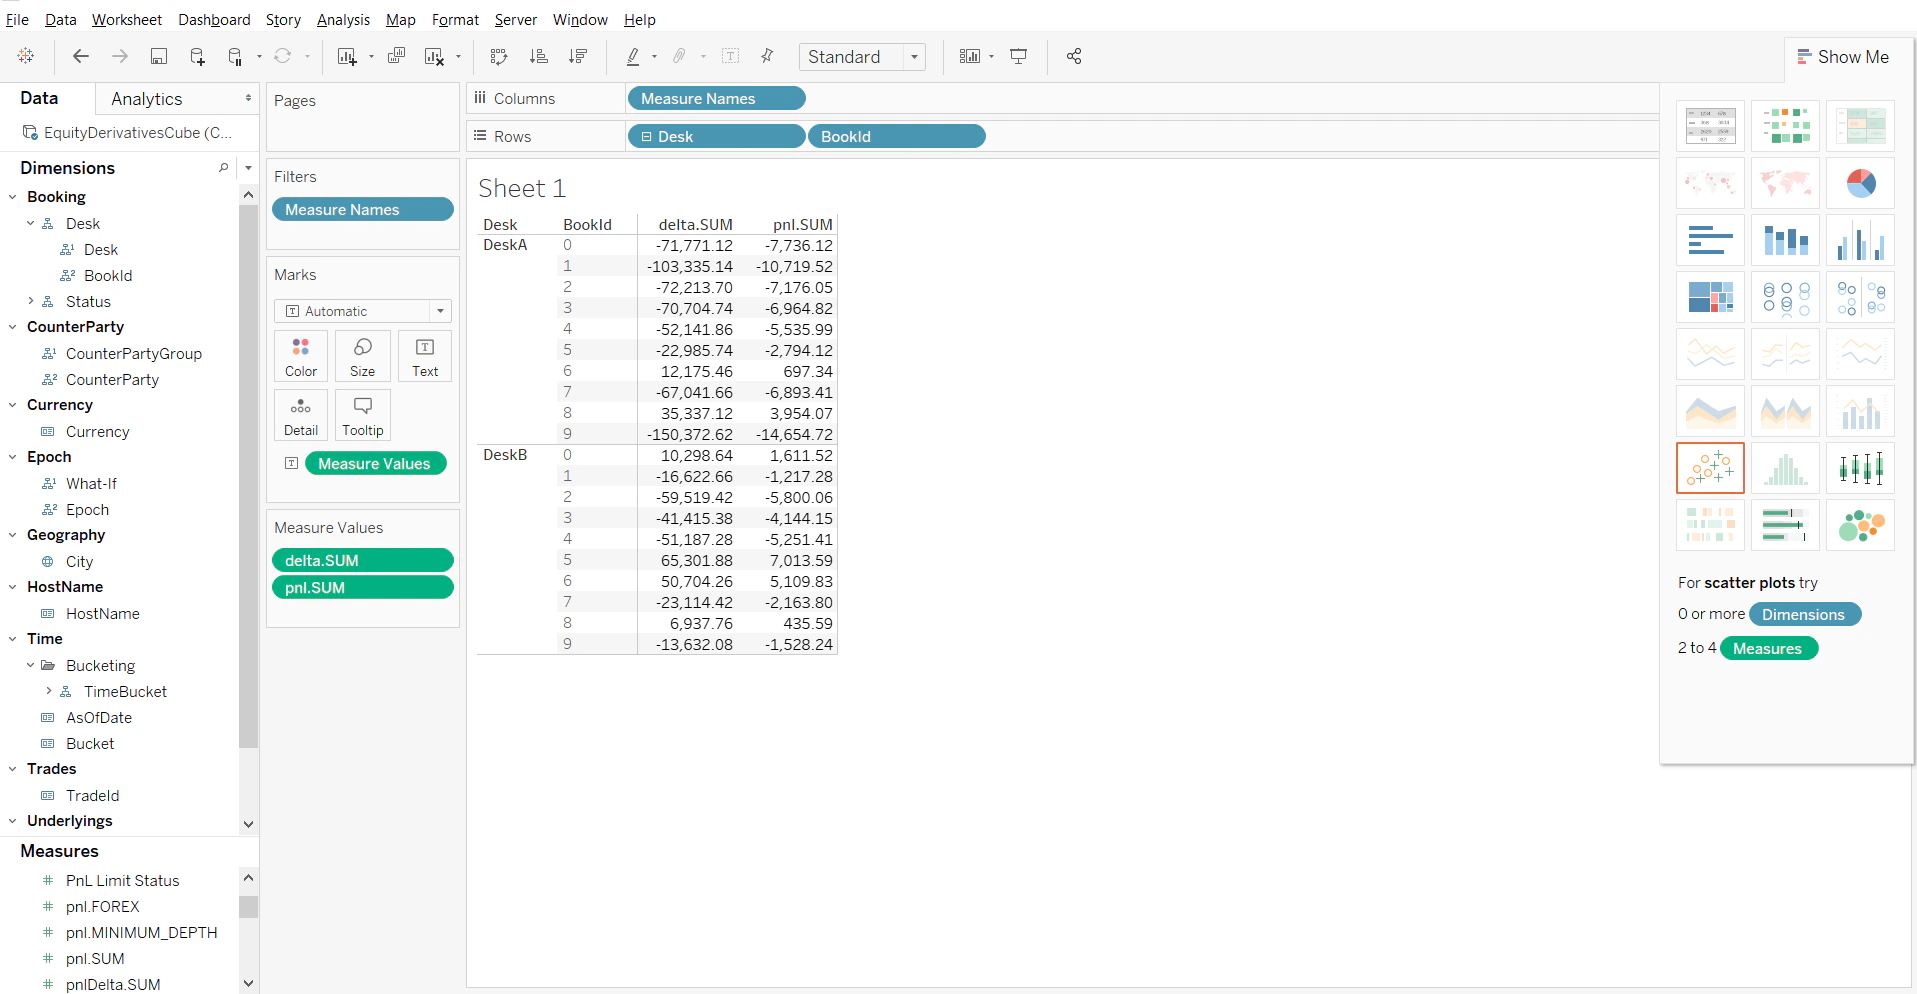
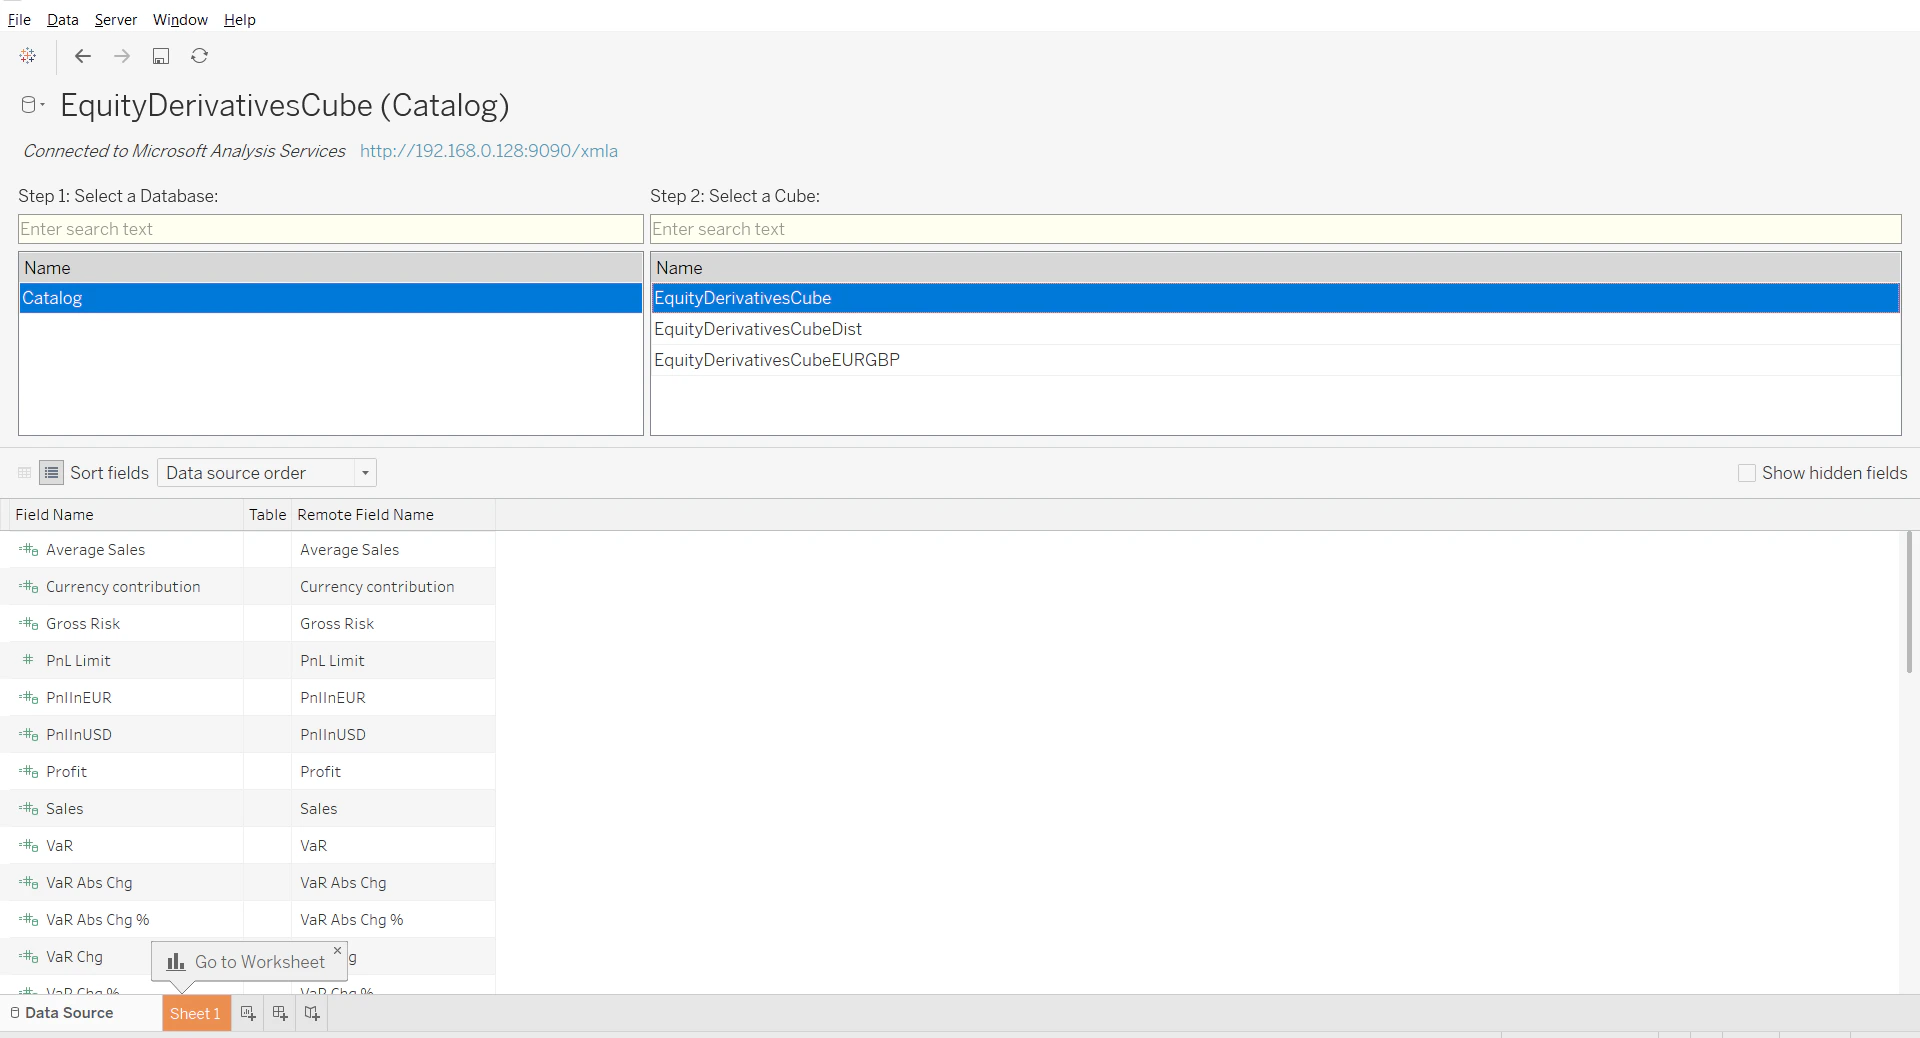 Once you have selected dimensions and measures to display, you have your pivot table!
 You can now create your charts and reports with Tableau using data from Atoti.
### How to Convert a Field from String to Date
It is a known issue that sometimes Date fields are shown as Strings in Tableau.
1. Change the data type of the field, changing it from String to Date
2. If your dates are not recognized (and shown as null in the data view), revert the data type to
String and create a calculated member. A calculated member is an MDX expression that will be
evaluated during query.
You can now create your charts and reports with Tableau using data from Atoti.
### How to Convert a Field from String to Date
It is a known issue that sometimes Date fields are shown as Strings in Tableau.
1. Change the data type of the field, changing it from String to Date
2. If your dates are not recognized (and shown as null in the data view), revert the data type to
String and create a calculated member. A calculated member is an MDX expression that will be
evaluated during query.
From the Dimensions panel, select Calculated Members and create a new one. Choose a name, make
sure to select Date as its result type and write the MDX expression using the `cdate` function. As
an example, the MDX formula to use to transform the date field "AsOfDate" on the "HistoricalDates"
from the "Time" dimension is `cdate([Time].[HistoricalDates].CurrentMember.MemberValue)`.