> ## Documentation Index
> Fetch the complete documentation index at: https://docs.activeviam.com/llms.txt
> Use this file to discover all available pages before exploring further.
# Power BI
PowerBI itself does not support multidimensional datasources. It does not let end users explore
cubes interactively, like they can with a tabular datasource supporting the DirectQuery feature. But
on the other hand you can import data from an Atoti cube into PowerBI and use this data to
create dashboards.
A primitive method for doing that is to export the output of a query into a CSV file, and load this
CSV file into PowerBI. It always works. If you only have access to Atoti Server without the Atoti
Python library, that's what you have to do.
A more integrated way is to plug Atoti as an MDX source, returning an MDX result that PowerBI can display.
Finally, you can use the Atoti Python library. Here we're looking at an online technique that does not require to transfer files and that supports data refresh:
we'll be using the Atoti client Python library within the PowerBI Python connector.
### Connecting to Atoti in PowerBI using an MDX query
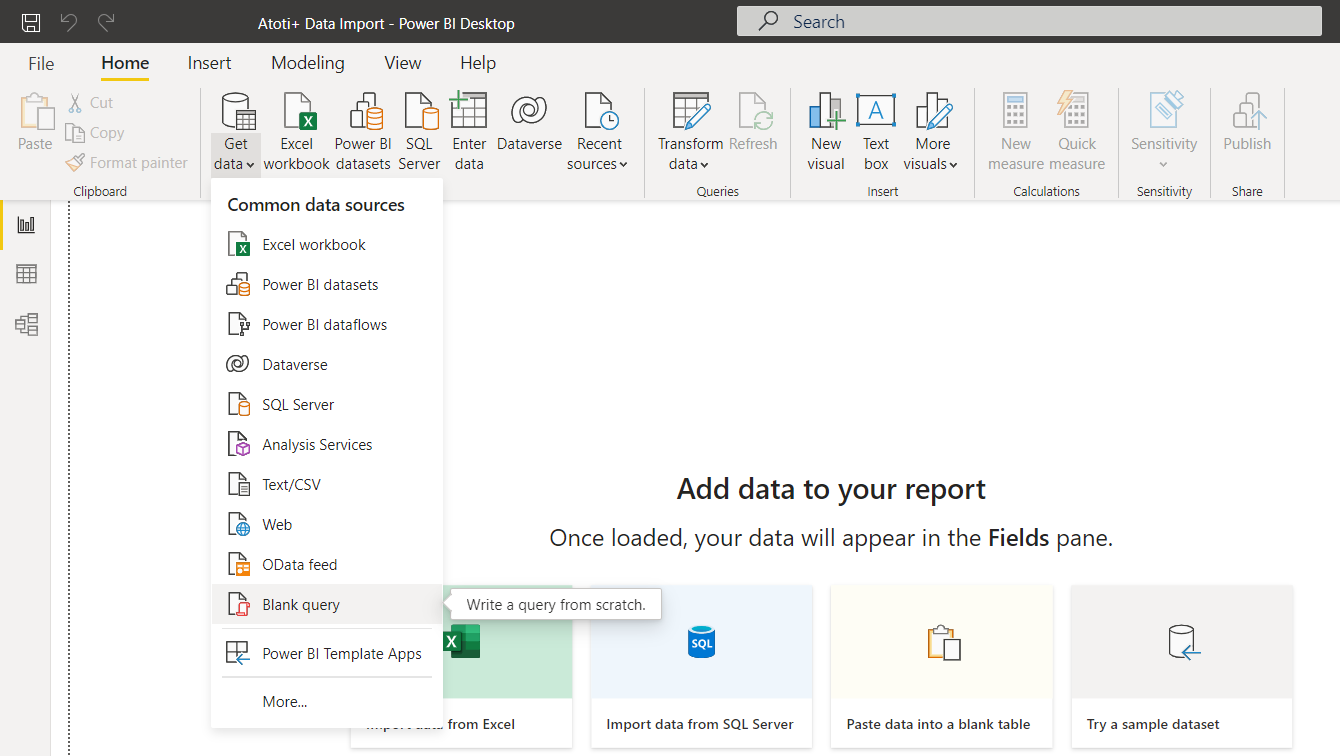
Open Power BI, click on "Get Data" drop down menu from the ribbon, select the "Blank Query" data source type. This will open the Power Query editor.
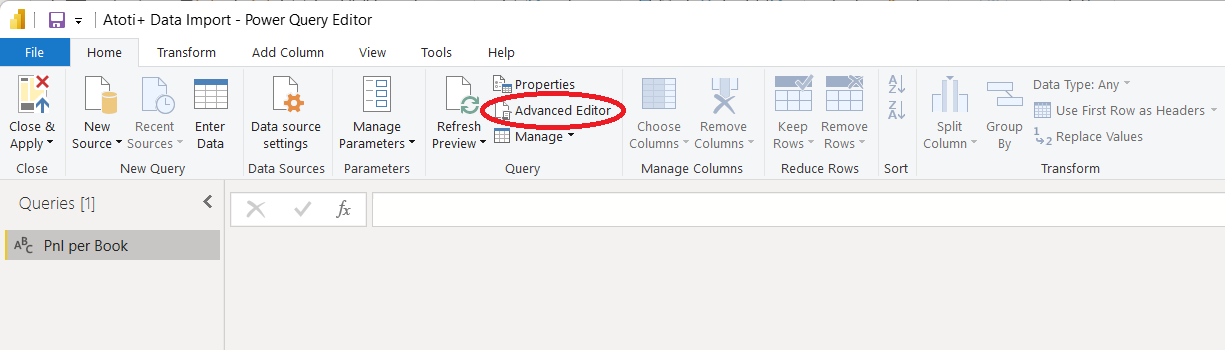
 In the Power Query editor, click on the "Advanced Editor" from the ribbon. We are going to describe the connection details and the MDX query to the Atoti+ cube using the Power Query M language.
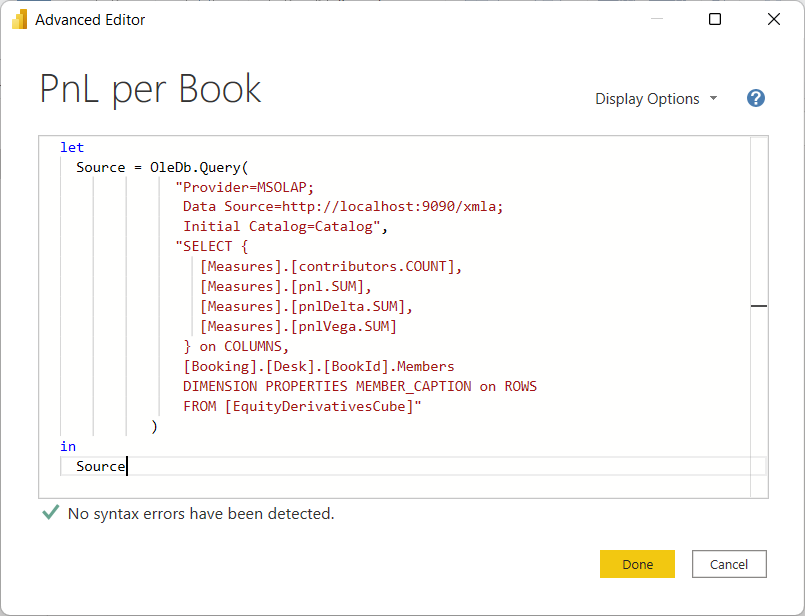
 In the advanced editor window, describe the cube connection and the MDX query. For this example we are connecting to the Atoti sandbox cube, and retrieve PnL metrics at the book level. Note that the MSOLAP client library must be installed on the computer for the Power Query script to work. Otherwise you'll get an error telling you that it is not installed. You can get the MSOLAP client library from there: [https://docs.microsoft.com/en-us/analysis-services/client-libraries](https://docs.microsoft.com/en-us/analysis-services/client-libraries)
 ```
let
Source = OleDb.Query(
"Provider=MSOLAP;
Data Source=http://localhost:9090/xmla;
Initial Catalog=Catalog",
"SELECT {
[Measures].[contributors.COUNT],
[Measures].[pnl.SUM],
[Measures].[pnlDelta.SUM],
[Measures].[pnlVega.SUM]
} on COLUMNS,
[Booking].[Desk].[BookId].Members
DIMENSION PROPERTIES MEMBER_CAPTION on ROWS
FROM [EquityDerivativesCube]"
)
in
Source
```
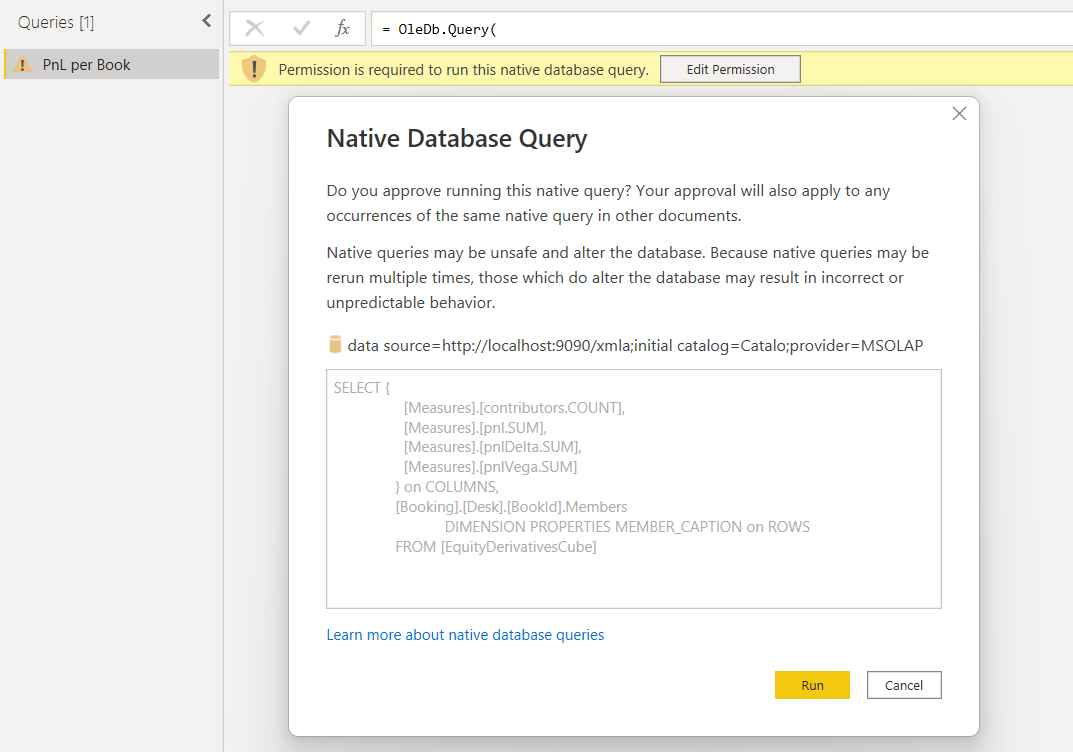
Click on "Done" and Power Query will display a warning to remind you that you are running a native query on a database. You must approve this query by clicking on "Run".
```
let
Source = OleDb.Query(
"Provider=MSOLAP;
Data Source=http://localhost:9090/xmla;
Initial Catalog=Catalog",
"SELECT {
[Measures].[contributors.COUNT],
[Measures].[pnl.SUM],
[Measures].[pnlDelta.SUM],
[Measures].[pnlVega.SUM]
} on COLUMNS,
[Booking].[Desk].[BookId].Members
DIMENSION PROPERTIES MEMBER_CAPTION on ROWS
FROM [EquityDerivativesCube]"
)
in
Source
```
Click on "Done" and Power Query will display a warning to remind you that you are running a native query on a database. You must approve this query by clicking on "Run".
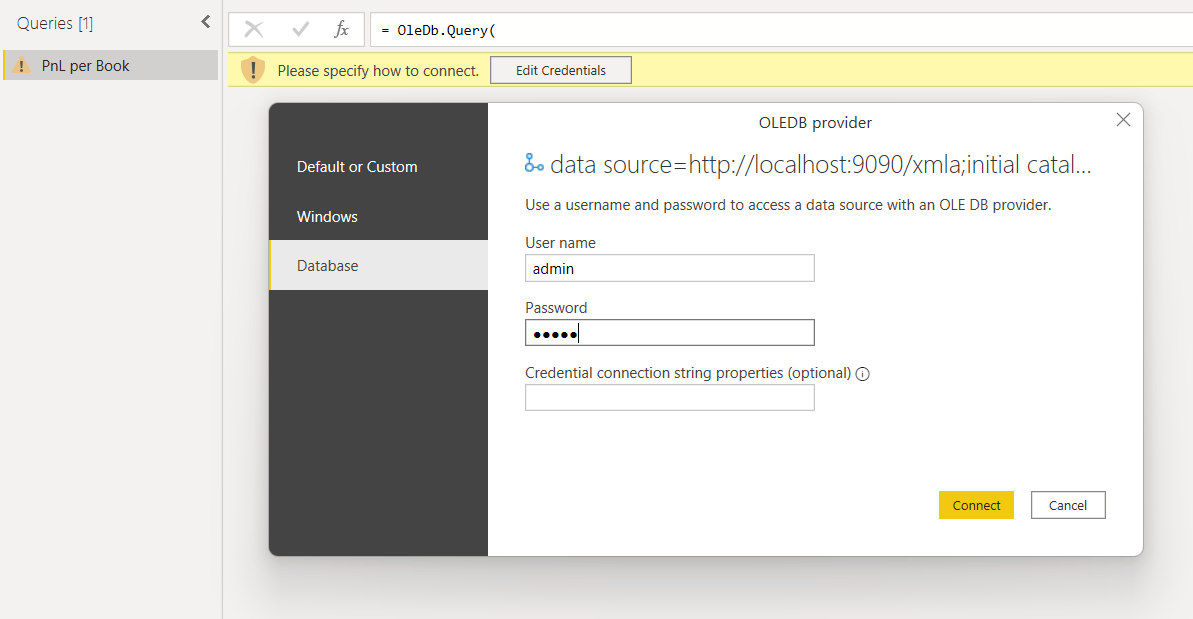
 Then you will edit your Atoti+ credentials to connect to the Atoti+ cube. Choose "Database" in the left drawer and enter your Atoti+ user name and password. Click on "Connect".
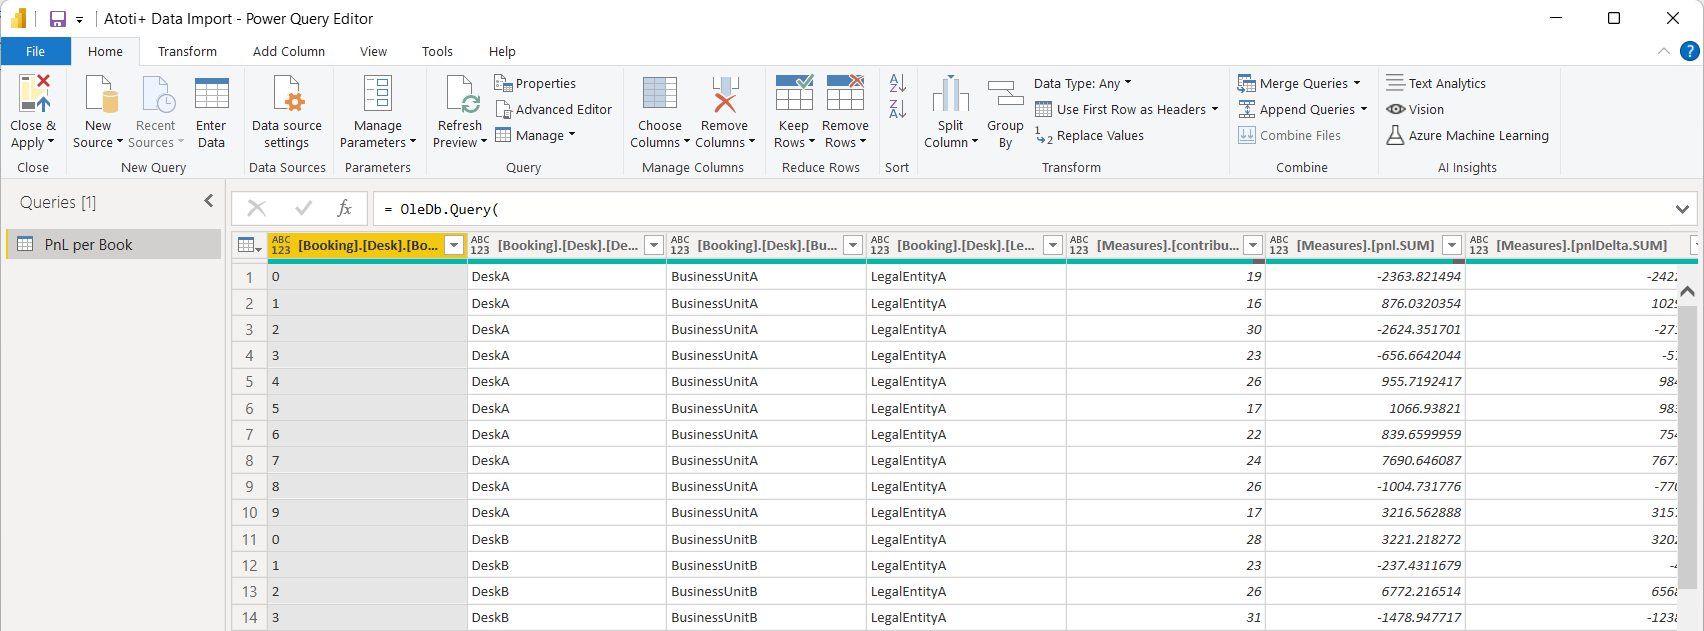
 Power Query will connect to the Atoti+ cube, run the MDX query and present the result set to you. From that point you can use the Power Query features to rename, remove and reorder columns, or even filter some rows out and do other transformations. The MSOLAP provider returns fully qualified names for cube levels and measures, which you will probably want to rename into something more intelligible.
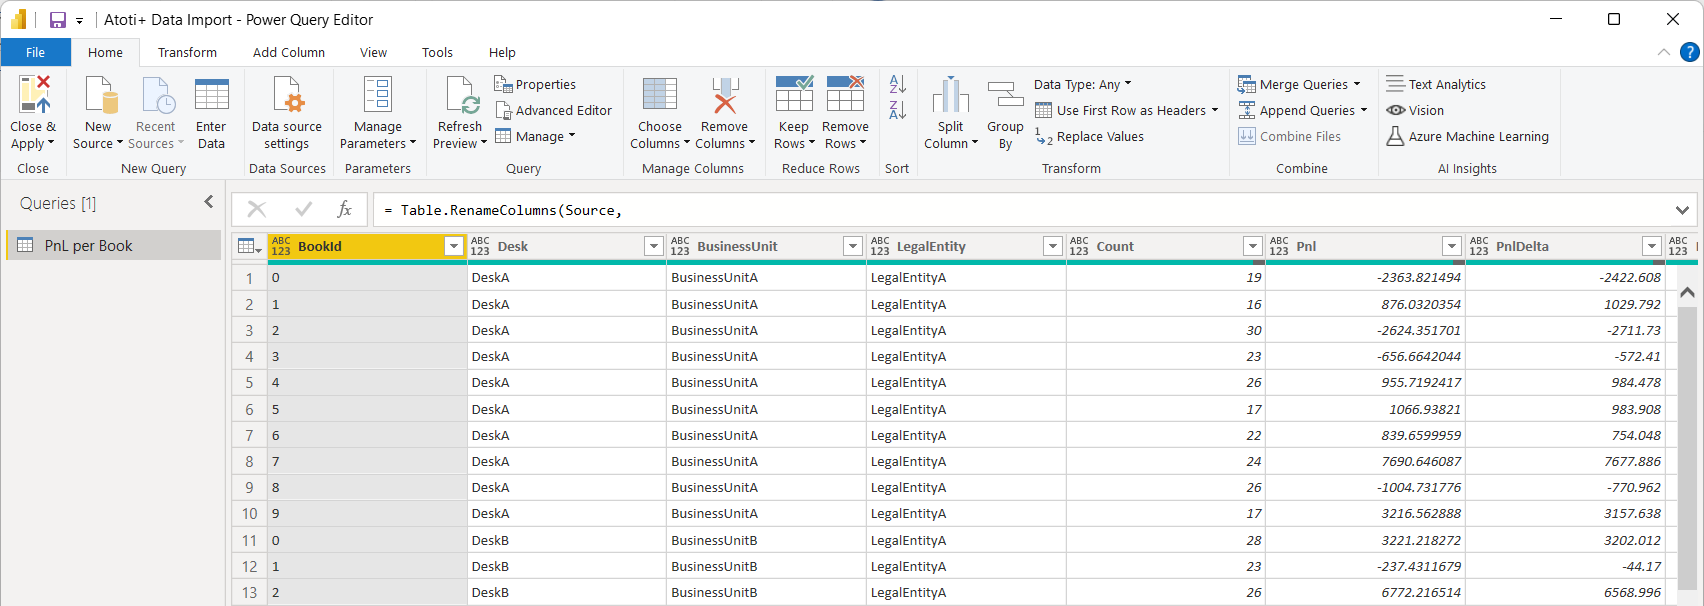
 All the data manipulations in Power Query can be achieved through point and click, or with Power Query M code. For instance here is a refined Power Query M script that will also rename the columns automatically, and change the data type of numerical columns that are sometimes not detected properly by Power Query:
```
let
Source = OleDb.Query(
"Provider=MSOLAP;
Data Source=http://localhost:9090/xmla;
Initial Catalog=Catalog",
"SELECT {
[Measures].[contributors.COUNT],
[Measures].[pnl.SUM],
[Measures].[pnlDelta.SUM],
[Measures].[pnlVega.SUM]
} on COLUMNS,
NON EMPTY [Booking].[Desk].[BookId].Members
DIMENSION PROPERTIES MEMBER_CAPTION on ROWS
FROM [EquityDerivativesCube]"
),
RenamedColumns = Table.RenameColumns(Source,
{
{"[Measures].[contributors.COUNT]", "Count"},
{"[Measures].[pnl.SUM]", "Pnl"},
{"[Measures].[pnlDelta.SUM]", "PnlDelta"},
{"[Measures].[pnlVega.SUM]", "PnlVega"},
{"[Booking].[Desk].[BookId].[MEMBER_CAPTION]", "BookId"},
{"[Booking].[Desk].[LegalEntity].[MEMBER_CAPTION]", "LegalEntity"},
{"[Booking].[Desk].[Desk].[MEMBER_CAPTION]", "Desk"},
{"[Booking].[Desk].[BusinessUnit].[MEMBER_CAPTION]", "BusinessUnit"}
}),
ChangedTypes = Table.TransformColumnTypes(RenamedColumns,
{
{"Count", Int64.Type},
{"Pnl", type number},
{"PnlDelta", type number},
{"PnlVega", type number}
})
in
ChangedTypes
```
This will return a cleaner and ready to use dataset. You can click on "Close & Apply" which will take you back to Power BI and you will be able to design a report with the imported data.
All the data manipulations in Power Query can be achieved through point and click, or with Power Query M code. For instance here is a refined Power Query M script that will also rename the columns automatically, and change the data type of numerical columns that are sometimes not detected properly by Power Query:
```
let
Source = OleDb.Query(
"Provider=MSOLAP;
Data Source=http://localhost:9090/xmla;
Initial Catalog=Catalog",
"SELECT {
[Measures].[contributors.COUNT],
[Measures].[pnl.SUM],
[Measures].[pnlDelta.SUM],
[Measures].[pnlVega.SUM]
} on COLUMNS,
NON EMPTY [Booking].[Desk].[BookId].Members
DIMENSION PROPERTIES MEMBER_CAPTION on ROWS
FROM [EquityDerivativesCube]"
),
RenamedColumns = Table.RenameColumns(Source,
{
{"[Measures].[contributors.COUNT]", "Count"},
{"[Measures].[pnl.SUM]", "Pnl"},
{"[Measures].[pnlDelta.SUM]", "PnlDelta"},
{"[Measures].[pnlVega.SUM]", "PnlVega"},
{"[Booking].[Desk].[BookId].[MEMBER_CAPTION]", "BookId"},
{"[Booking].[Desk].[LegalEntity].[MEMBER_CAPTION]", "LegalEntity"},
{"[Booking].[Desk].[Desk].[MEMBER_CAPTION]", "Desk"},
{"[Booking].[Desk].[BusinessUnit].[MEMBER_CAPTION]", "BusinessUnit"}
}),
ChangedTypes = Table.TransformColumnTypes(RenamedColumns,
{
{"Count", Int64.Type},
{"Pnl", type number},
{"PnlDelta", type number},
{"PnlVega", type number}
})
in
ChangedTypes
```
This will return a cleaner and ready to use dataset. You can click on "Close & Apply" which will take you back to Power BI and you will be able to design a report with the imported data.
 ### Connecting to Atoti in PowerBI using a Python script
Prerequisites are to have Python 3.8+ (64 bit) installed, to have PowerBI configured for running
Python scripts, and to have the Atoti Python library installed. In case several Python environments
are installed on the machine, then Atoti must of course be installed in the environment referenced
in the PowerBI configuration.
* [Configure PowerBI for running Python scripts](https://docs.microsoft.com/en-us/power-bi/connect-data/desktop-python-scripts)
* [Install Atoti](https://docs.atoti.io/latest/installation.html)
To create our sample Atoti cube let's use
the [Atoti tutorial](https://docs.atoti.io/latest/tutorial.html). After running the first few cells
of the first tutorial notebook we have a cube called "Sales" with a few hierarchies and measures,
we're going to use this cube for our experiment. We need to record the port of this cube (that we get
by evaluating `session.port` in the notebook) for later use.
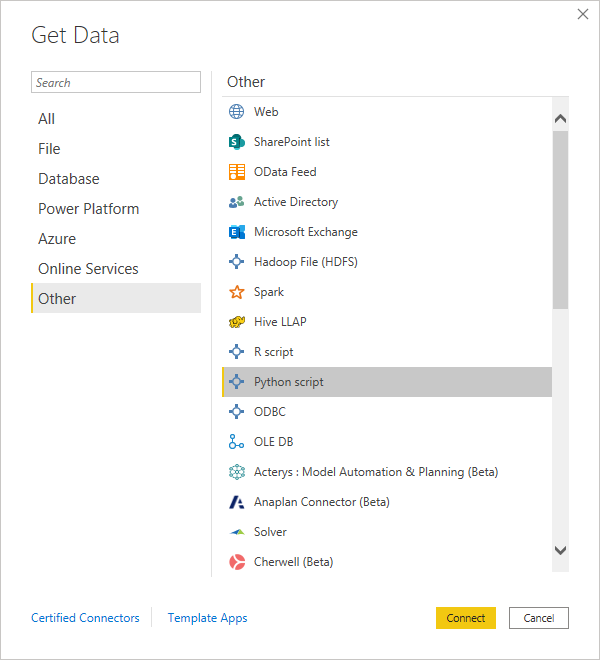
In PowerBI we open the Get Data wizard and select the Python script option.
### Connecting to Atoti in PowerBI using a Python script
Prerequisites are to have Python 3.8+ (64 bit) installed, to have PowerBI configured for running
Python scripts, and to have the Atoti Python library installed. In case several Python environments
are installed on the machine, then Atoti must of course be installed in the environment referenced
in the PowerBI configuration.
* [Configure PowerBI for running Python scripts](https://docs.microsoft.com/en-us/power-bi/connect-data/desktop-python-scripts)
* [Install Atoti](https://docs.atoti.io/latest/installation.html)
To create our sample Atoti cube let's use
the [Atoti tutorial](https://docs.atoti.io/latest/tutorial.html). After running the first few cells
of the first tutorial notebook we have a cube called "Sales" with a few hierarchies and measures,
we're going to use this cube for our experiment. We need to record the port of this cube (that we get
by evaluating `session.port` in the notebook) for later use.
In PowerBI we open the Get Data wizard and select the Python script option.
 PowerBI opens a window where we can paste a simple Python script (expected to return a pandas
dataframe). We're going to do that with the Atoti Python library.
PowerBI opens a window where we can paste a simple Python script (expected to return a pandas
dataframe). We're going to do that with the Atoti Python library.
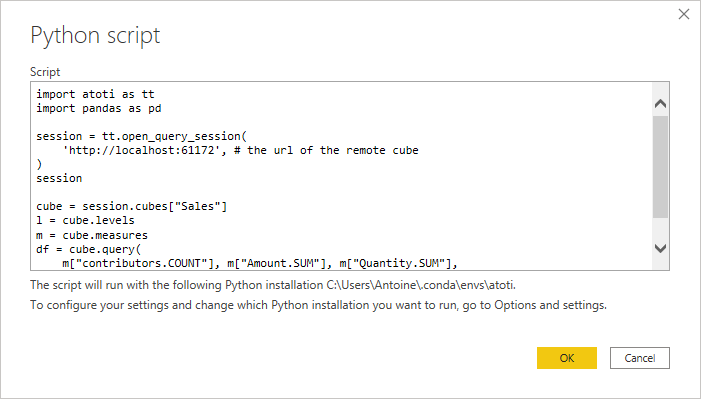 Querying a remote cube with Atoti is covered in
the [tutorial](https://docs.atoti.io/latest/tutorial.html). Here is an example:
```python theme={"languages":{"custom":["/engine/python-sdk/0.9/languages/pycon.tmLanguage.json"]}}
from atoti_query import QuerySession
session = QuerySession(
'http://localhost:61172' # the url of the remote cube
)
cube = session.cubes["Sales"]
l = cube.levels
m = cube.measures
df = cube.query(
m["contributors.COUNT"], m["Amount.SUM"], m["Quantity.SUM"],
levels=[l["Date"], l["Shop"], l["Product"]]
).reset_index()
```
No security is used here. Look at the rest of
the [documentation](https://docs.atoti.io/latest/index.html) for access to secured cubes, including
cubes developed with Atoti and the Java API.
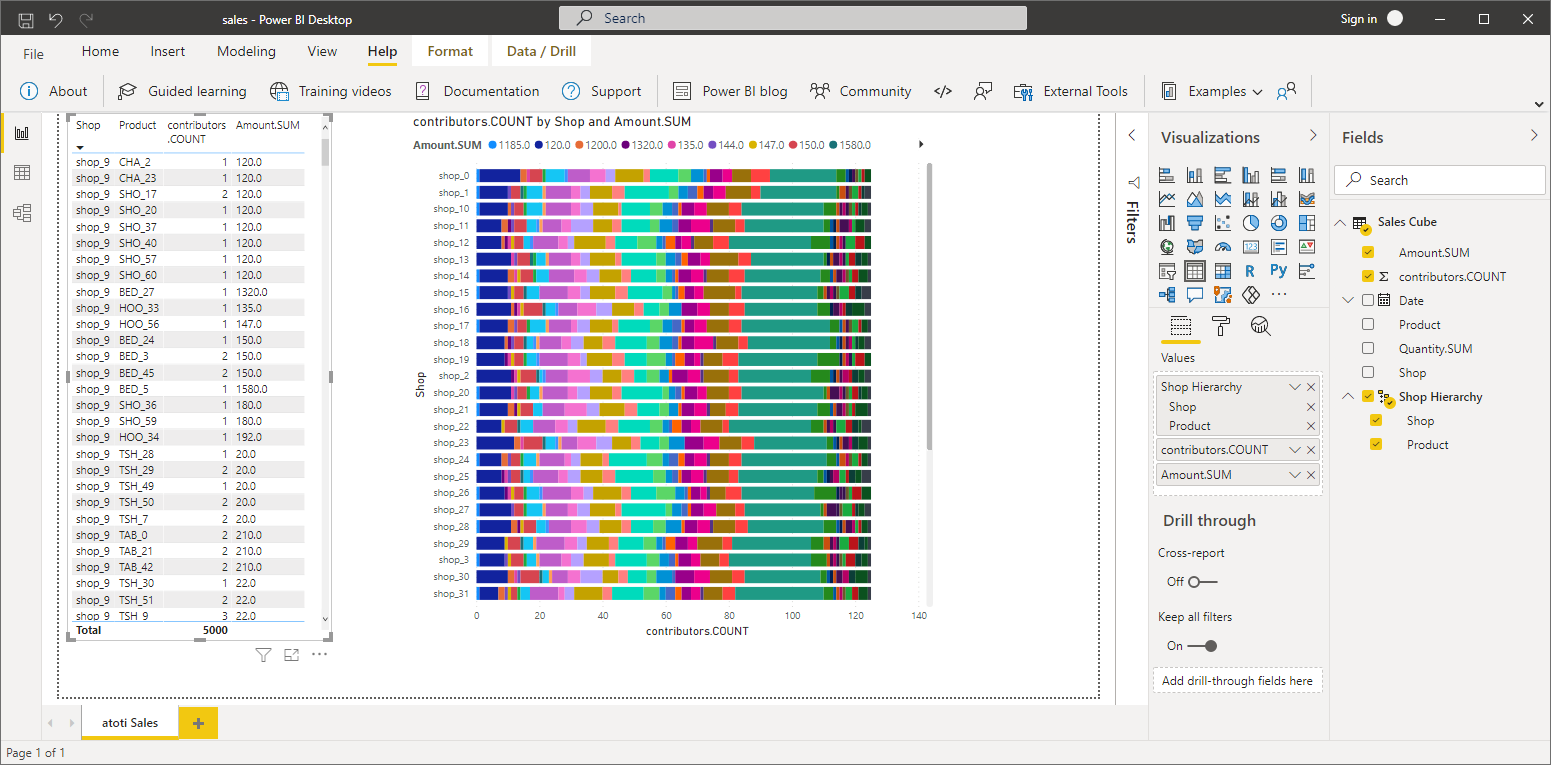
Why the `.reset_index()` command applied to the Atoti query result? When processing cube queries,
Atoti returns a dataframe with a hierarchical index that represents the hierarchies involved in the
query. PowerBI does not support this pandas feature, and we must reset the index to a standard flat
column.
After you press 'OK', PowerBI will take a while to run the python script, get the data and make it
available in the model for dashboarding as usual.
Querying a remote cube with Atoti is covered in
the [tutorial](https://docs.atoti.io/latest/tutorial.html). Here is an example:
```python theme={"languages":{"custom":["/engine/python-sdk/0.9/languages/pycon.tmLanguage.json"]}}
from atoti_query import QuerySession
session = QuerySession(
'http://localhost:61172' # the url of the remote cube
)
cube = session.cubes["Sales"]
l = cube.levels
m = cube.measures
df = cube.query(
m["contributors.COUNT"], m["Amount.SUM"], m["Quantity.SUM"],
levels=[l["Date"], l["Shop"], l["Product"]]
).reset_index()
```
No security is used here. Look at the rest of
the [documentation](https://docs.atoti.io/latest/index.html) for access to secured cubes, including
cubes developed with Atoti and the Java API.
Why the `.reset_index()` command applied to the Atoti query result? When processing cube queries,
Atoti returns a dataframe with a hierarchical index that represents the hierarchies involved in the
query. PowerBI does not support this pandas feature, and we must reset the index to a standard flat
column.
After you press 'OK', PowerBI will take a while to run the python script, get the data and make it
available in the model for dashboarding as usual.