> ## Documentation Index
> Fetch the complete documentation index at: https://docs.activeviam.com/llms.txt
> Use this file to discover all available pages before exploring further.
# How to monitor queries with the query history tab
> How to use the Query history tab in Atoti Admin UI to monitor MDX queries, covering the query table columns, filtering by status and duration, canceling running queries, and the Query History starter requirement.
The **Query history** tab displays a table of past and ongoing queries sent to an Atoti application. It is useful for monitoring query performance and debugging unexpected query behavior.
Query history is activated using the [Atoti Server Query History starter](/engine/java-sdk/6.1/starters/atoti_query_history_starter/).
If the connected application does not support the query history API, the tab displays a message indicating the service is unavailable.
Authorization to access the query history tab is managed at the endpoint level.
This tab relies on the Atoti Server [Query History endpoint](/engine/java-sdk/6.1/rest-api/rest-apis-overview/#query-history-experimental).
 ## How to read the query table
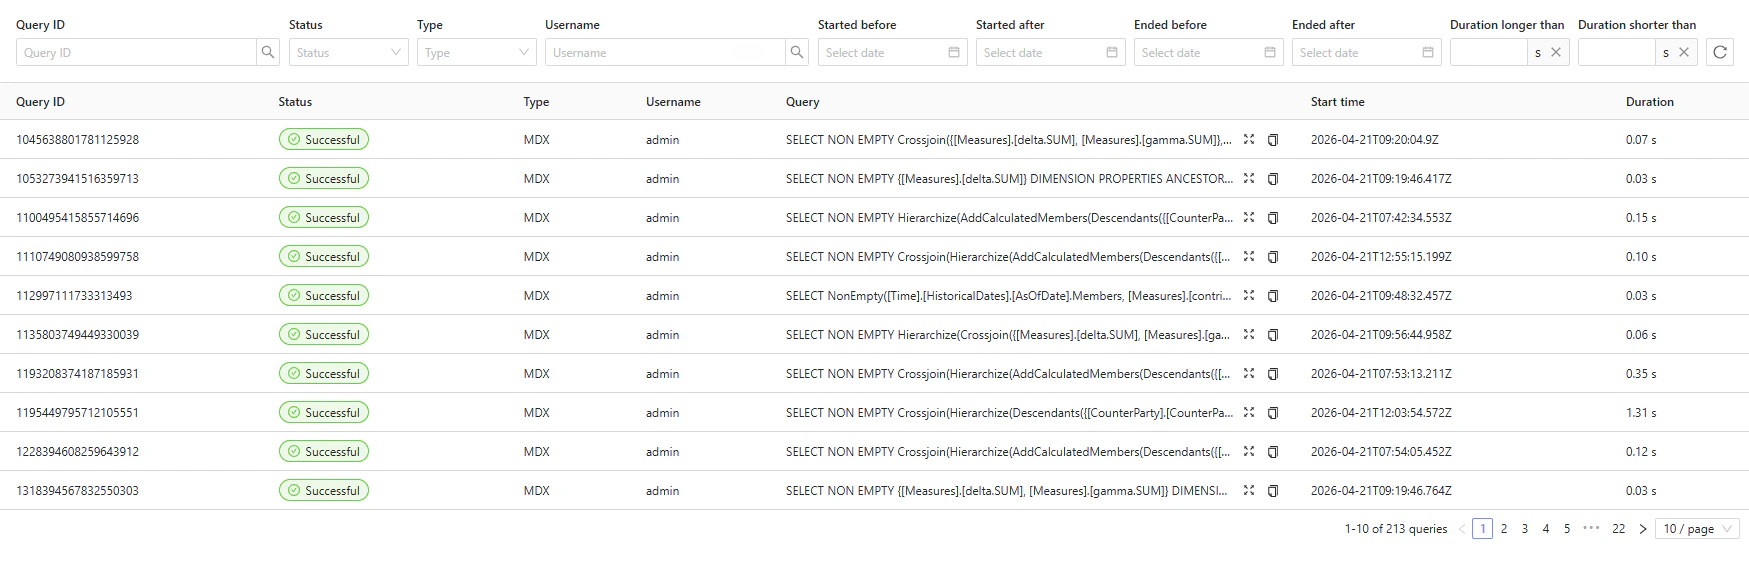
The table displays one row per query. Each row contains the following columns:
* **Query ID** — unique numeric identifier for the query
* **Status** — current state of the query: `SUCCESSFUL`, `RUNNING`, `FAILED`, or `CANCELLED`
* **Type** — query language used, for example `MDX`
* **Username** — name of the user who sent the query
* **Query** — truncated query text, with an expand icon and a copy icon
* **Start time** — ISO 8601 timestamp recording when the query started
* **Duration** — time taken to complete the query, in seconds, rounded to two decimal places
## How to filter the query list
A filter row sits above the table. Applying a filter narrows the rows shown to matching queries. Available filters include:
* **Query ID** — text search requiring an exact match on the full query ID
* **Status** — dropdown: `SUCCESSFUL`, `RUNNING`, `FAILED`, or `CANCELLED`
* **Type** — dropdown, for example `MDX`
* **Username** — text search requiring an exact match on the full username
* **Started before** / **Started after** — date pickers to define a start time range
* **Ended before** / **Ended after** — date pickers to define an end time range
* **Duration longer than** / **Duration shorter than** — numeric inputs in seconds
To clear a single duration filter, click the × icon next to the input.
The **Query ID** and **Username** filters require an exact match. Enter the full query ID or the full username to get results.
The **Query ID** filter is mutually exclusive with all other filters.
* Applying a Query ID filter removes any other active filters, and the table will show at most one result.
* Applying any other filter while a Query ID filter is active removes the Query ID filter.
## How to view and copy a full query
The **Query** column shows a truncated version of the query text. Two icons appear alongside the text:
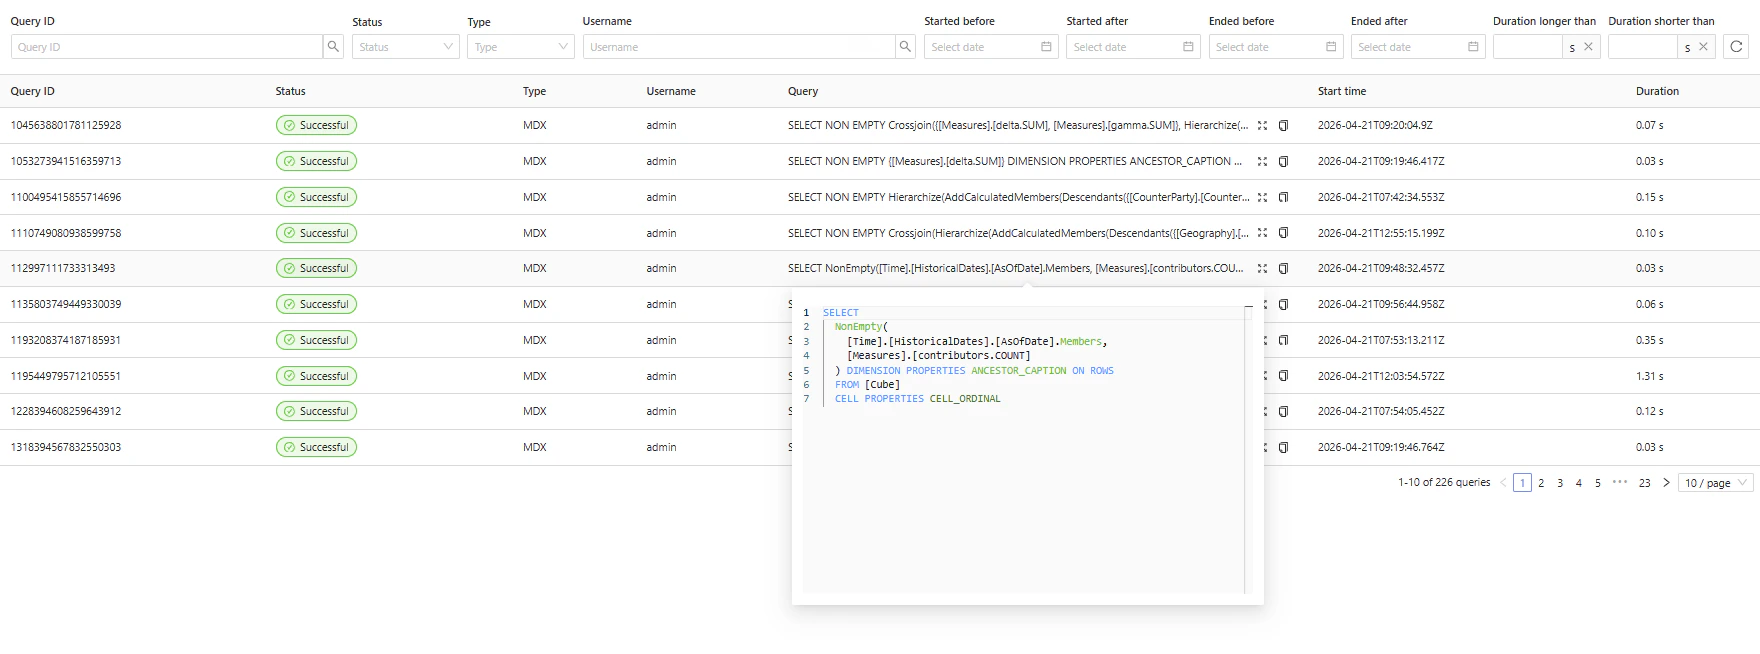
* **Hover** over the query text or the expand icon to open an MDX preview popup. The popup displays the full, formatted query with syntax highlighting.
* **Click the copy icon** to copy the query text directly to the clipboard. Opening the preview first is not required.
## How to read the query table
The table displays one row per query. Each row contains the following columns:
* **Query ID** — unique numeric identifier for the query
* **Status** — current state of the query: `SUCCESSFUL`, `RUNNING`, `FAILED`, or `CANCELLED`
* **Type** — query language used, for example `MDX`
* **Username** — name of the user who sent the query
* **Query** — truncated query text, with an expand icon and a copy icon
* **Start time** — ISO 8601 timestamp recording when the query started
* **Duration** — time taken to complete the query, in seconds, rounded to two decimal places
## How to filter the query list
A filter row sits above the table. Applying a filter narrows the rows shown to matching queries. Available filters include:
* **Query ID** — text search requiring an exact match on the full query ID
* **Status** — dropdown: `SUCCESSFUL`, `RUNNING`, `FAILED`, or `CANCELLED`
* **Type** — dropdown, for example `MDX`
* **Username** — text search requiring an exact match on the full username
* **Started before** / **Started after** — date pickers to define a start time range
* **Ended before** / **Ended after** — date pickers to define an end time range
* **Duration longer than** / **Duration shorter than** — numeric inputs in seconds
To clear a single duration filter, click the × icon next to the input.
The **Query ID** and **Username** filters require an exact match. Enter the full query ID or the full username to get results.
The **Query ID** filter is mutually exclusive with all other filters.
* Applying a Query ID filter removes any other active filters, and the table will show at most one result.
* Applying any other filter while a Query ID filter is active removes the Query ID filter.
## How to view and copy a full query
The **Query** column shows a truncated version of the query text. Two icons appear alongside the text:
* **Hover** over the query text or the expand icon to open an MDX preview popup. The popup displays the full, formatted query with syntax highlighting.
* **Click the copy icon** to copy the query text directly to the clipboard. Opening the preview first is not required.
 ## How to refresh the query list
Click the refresh button (circular arrow icon at the right of the filter row) to reload the latest query data from the server. Use this to check for newly completed or started queries without navigating away from the tab.
## How to cancel a running query
Queries with a **Status** of `RUNNING` display a cancel button in the **Status** column.
1. Locate the running query in the table.
2. Click the cancel button in the **Status** column.
The query status updates to `CANCELLED` once the cancellation is processed.
## How to navigate between pages
The table uses pagination to manage large numbers of queries. The current range and total count are shown below the table, for example "1–10 of 319 queries".
* Use the rows-per-page selector to change how many queries are shown at once.
* Use the navigation controls to move between pages.
## How to refresh the query list
Click the refresh button (circular arrow icon at the right of the filter row) to reload the latest query data from the server. Use this to check for newly completed or started queries without navigating away from the tab.
## How to cancel a running query
Queries with a **Status** of `RUNNING` display a cancel button in the **Status** column.
1. Locate the running query in the table.
2. Click the cancel button in the **Status** column.
The query status updates to `CANCELLED` once the cancellation is processed.
## How to navigate between pages
The table uses pagination to manage large numbers of queries. The current range and total count are shown below the table, for example "1–10 of 319 queries".
* Use the rows-per-page selector to change how many queries are shown at once.
* Use the navigation controls to move between pages.