> ## Documentation Index
> Fetch the complete documentation index at: https://docs.activeviam.com/llms.txt
> Use this file to discover all available pages before exploring further.
# Add fields
> How to add hierarchies and measures to table, KPI, chart, and drillthrough widgets in Atoti UI using the Fields tab, including comparison KPI configuration, horizontal and vertical subplots, and multilevel hierarchy drill-down in pivot and tree table widgets.
Fields are the [hierarchies](../../navigate-atoti-ui/data-model#hierarchy) and [measures](../../navigate-atoti-ui/data-model#measure) used in a widget. They can be added using the **Fields** tab. Different types of widgets have different attributes, such as columns and rows, or horizontal and vertical subplots.
## Add fields to a table widget
[Table widgets](./about-widgets#tables) have the attributes **Rows** and **Columns**, which each have their own section in the **Fields** tab.
* Add a hierarchy by dragging it from the [data model](../../navigate-atoti-ui/data-model) into either the **Rows** or **Columns** section. Alternatively, clicking on the hierarchy will automatically add it under **Rows**.
* Add a measure by dragging it from the data model to the **Measures** section, or click it to add it automatically.
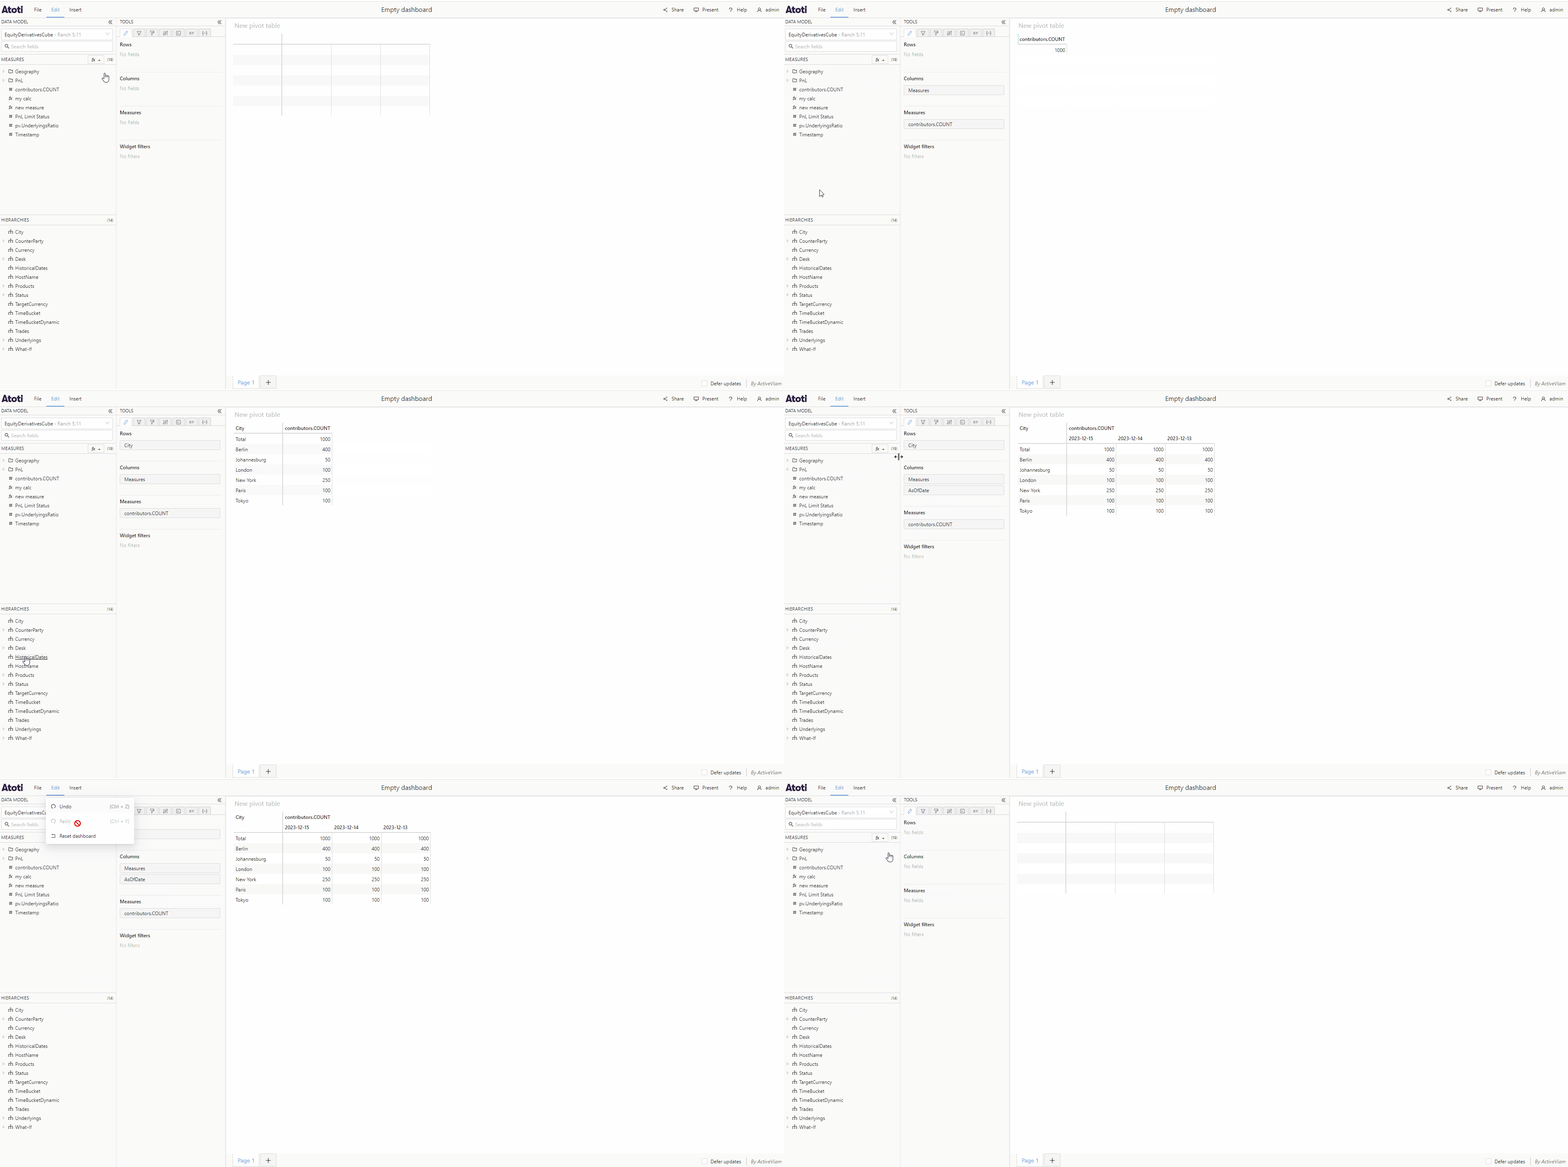 After fields have been added, their order can be changed by dragging and dropping them in a new position. This will change the order of display of the rows or columns in the widget. Fields can also be moved from rows to columns, and vice versa, by dragging and dropping.
Fields can be removed from a widget by clicking the "**X**" icon that appears when you hover the tile.
Every time you add, remove or reorder fields from your widget, it will
initiate a call to the server for new data, and lead to the widget reloading.
If you prefer to avoid this, see [deferred
updates](../../analyze-data/refresh-dashboard-data#defer-updates).
## Add fields to a KPI widget
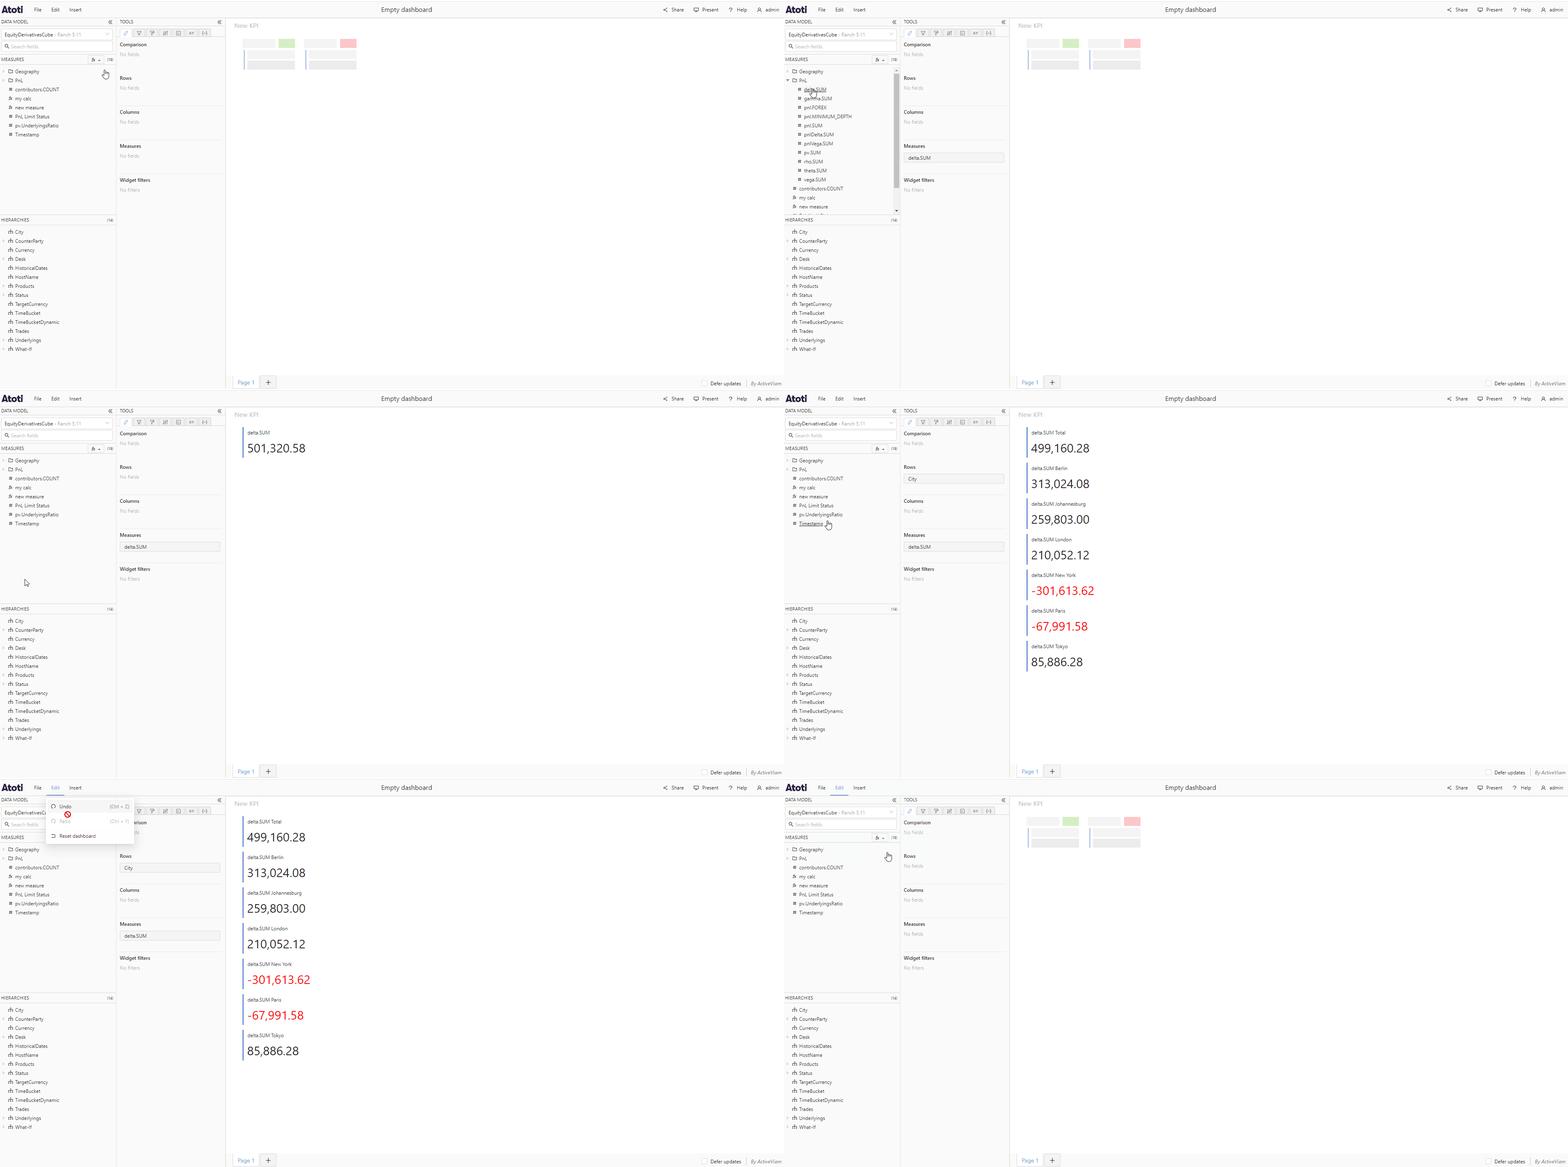
* Add hierarchies or measures to a [KPI widget](./about-widgets#kpi-widgets) in the same way as detailed above for table widgets.
After fields have been added, their order can be changed by dragging and dropping them in a new position. This will change the order of display of the rows or columns in the widget. Fields can also be moved from rows to columns, and vice versa, by dragging and dropping.
Fields can be removed from a widget by clicking the "**X**" icon that appears when you hover the tile.
Every time you add, remove or reorder fields from your widget, it will
initiate a call to the server for new data, and lead to the widget reloading.
If you prefer to avoid this, see [deferred
updates](../../analyze-data/refresh-dashboard-data#defer-updates).
## Add fields to a KPI widget
* Add hierarchies or measures to a [KPI widget](./about-widgets#kpi-widgets) in the same way as detailed above for table widgets.
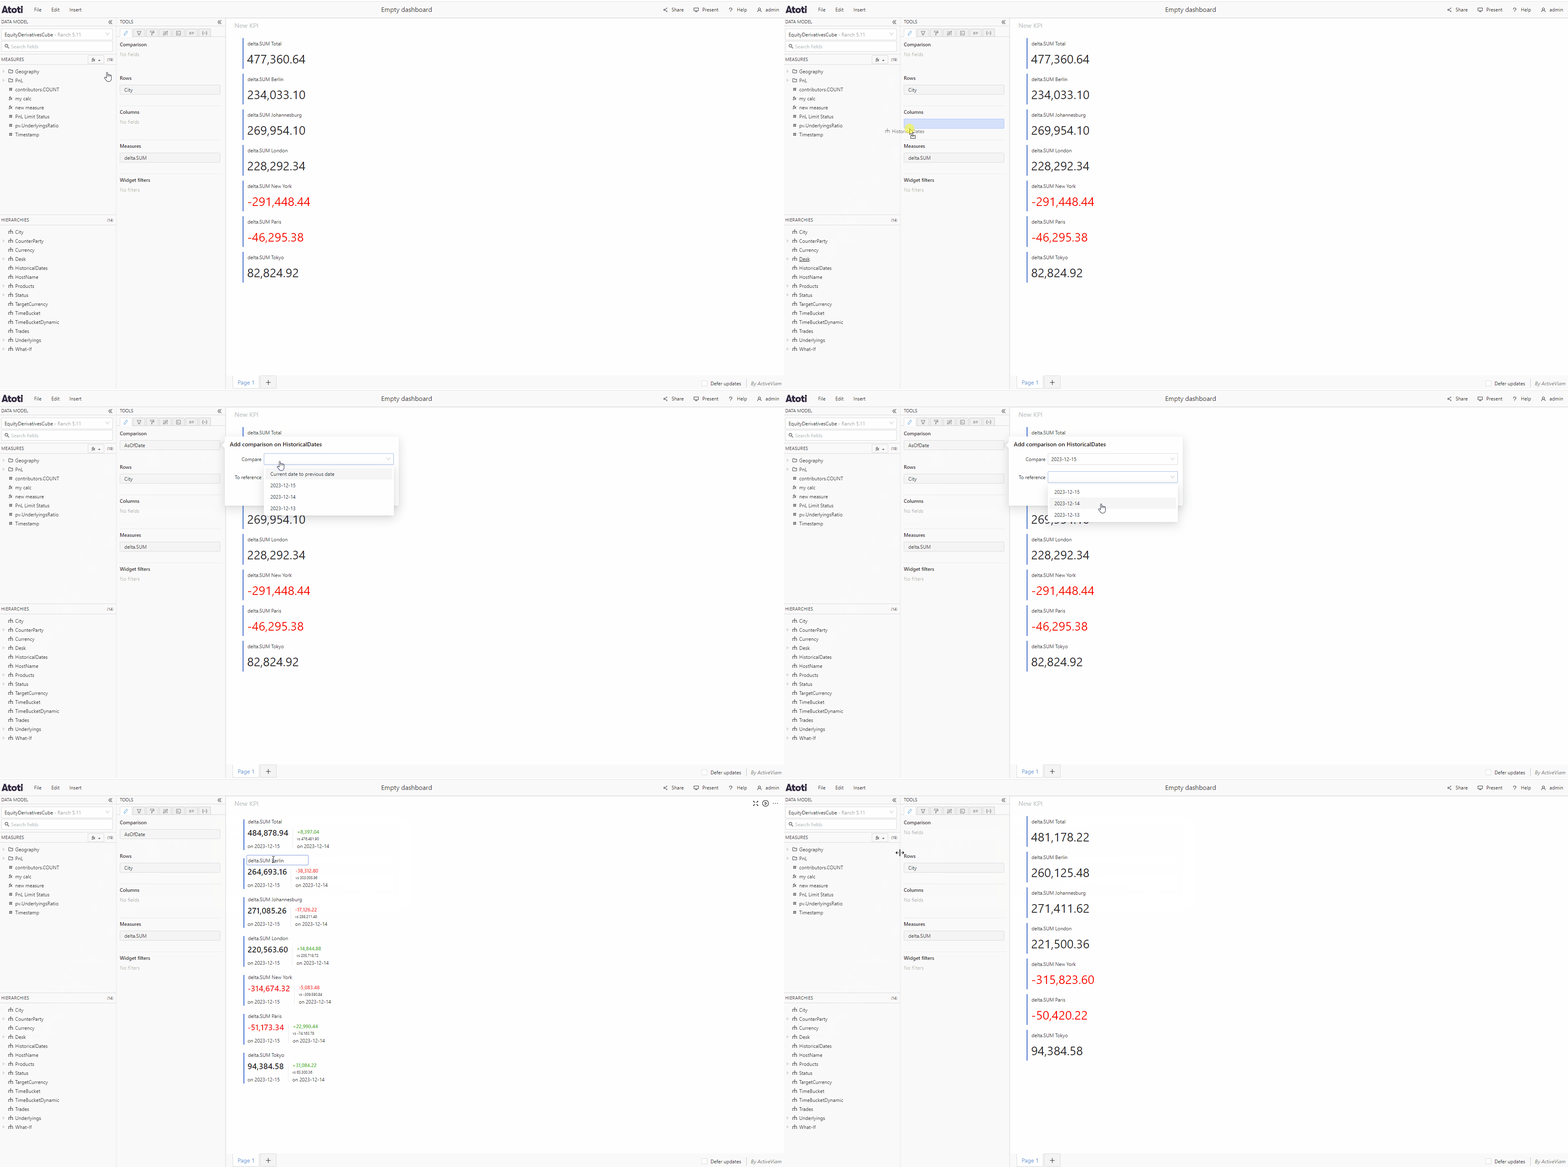
 KPI widgets also have an additional attribute, **Comparison**, which enables you to create a **Comparison KPI** to compare values for 2 members from the same hierarchy.
* Add a hierarchy to the **Comparison** section of the **Fields** tab.
* This will open the **Add comparison on *hierarchy*** popover.
* Use the dropdown to select two members from that hierarchy.
* Click **Apply comparison**.
KPI widgets also have an additional attribute, **Comparison**, which enables you to create a **Comparison KPI** to compare values for 2 members from the same hierarchy.
* Add a hierarchy to the **Comparison** section of the **Fields** tab.
* This will open the **Add comparison on *hierarchy*** popover.
* Use the dropdown to select two members from that hierarchy.
* Click **Apply comparison**.
 ## Add fields to a chart
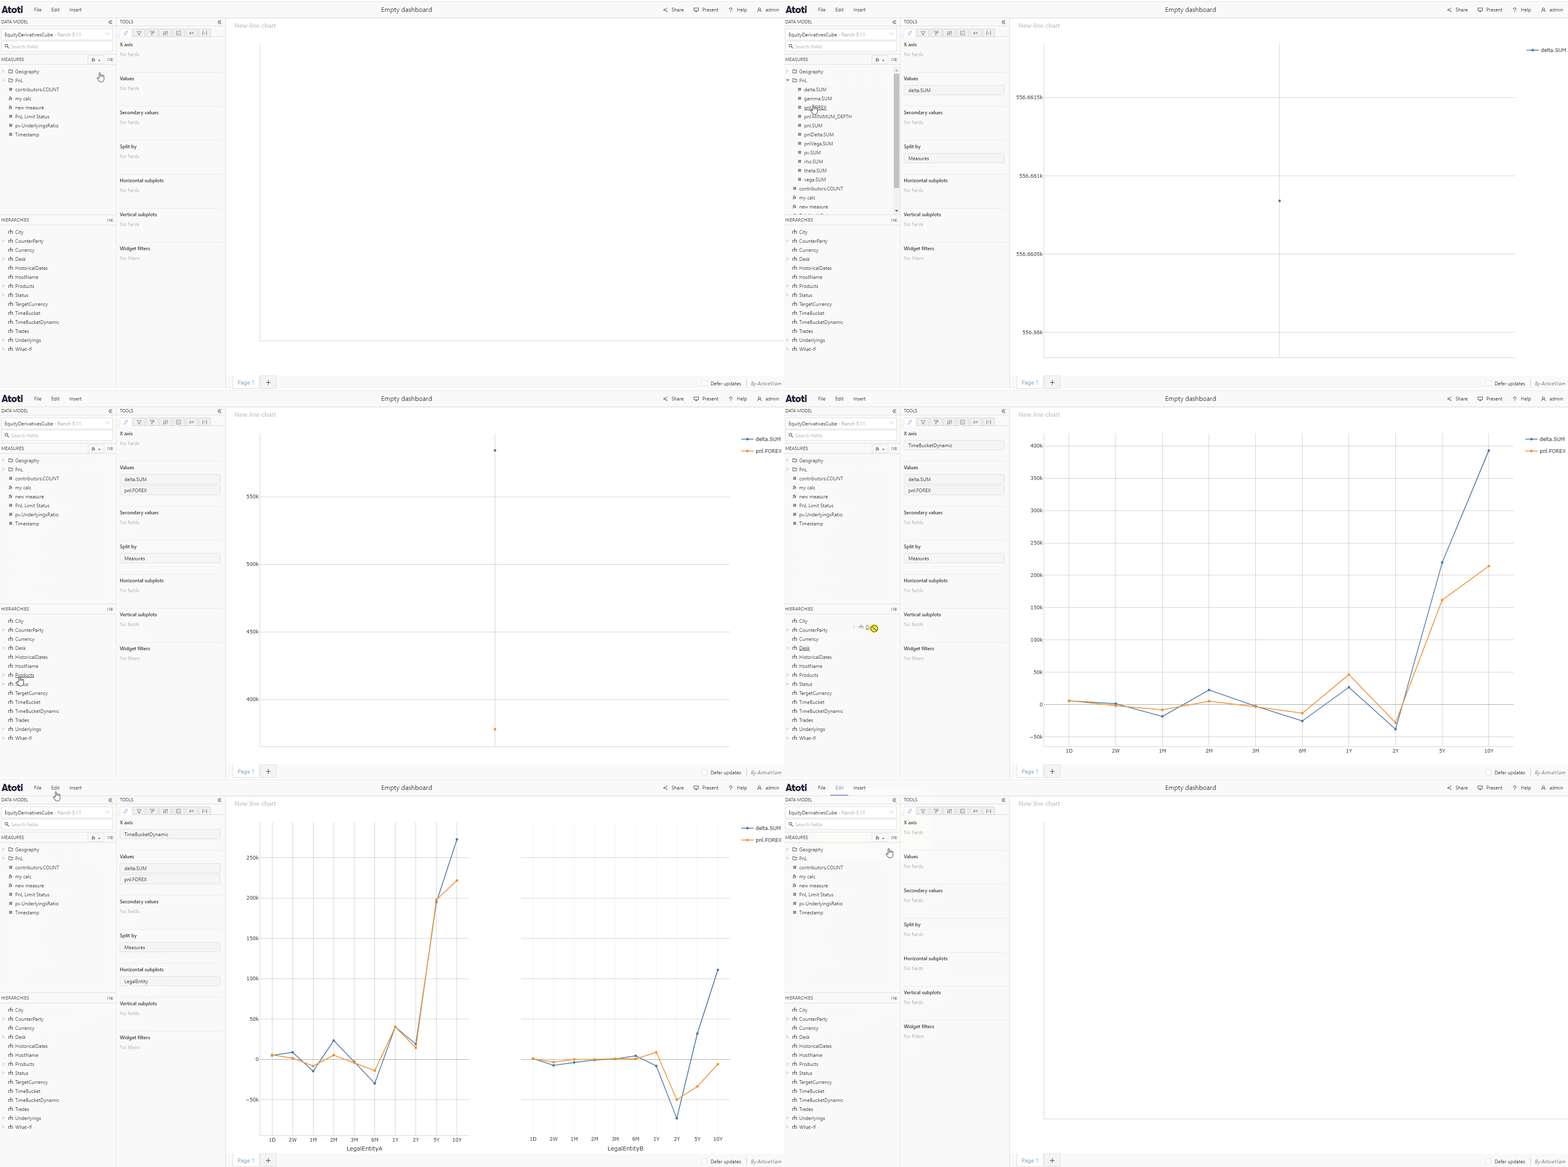
Different [charts](./about-widgets#charts) have different attributes, such as **X axis** for **Line charts** or **Slice by** for **Pie charts**. Fields are added by dragging and dropping them in the different sections of the **Fields** tab, as for table and KPI widgets. For most charts, measures are added to the **Values** section.
## Add fields to a chart
Different [charts](./about-widgets#charts) have different attributes, such as **X axis** for **Line charts** or **Slice by** for **Pie charts**. Fields are added by dragging and dropping them in the different sections of the **Fields** tab, as for table and KPI widgets. For most charts, measures are added to the **Values** section.
 ### Horizontal and vertical subplots
Subplots (also known as facet plots or trellis plots) are groups of mini charts with a common scale and axes. Each subplot represents a different item from a selected hierarchy.
To break a chart out into subplots:
* Add a hierarchy to the **Horizontal subplots** and/or **Vertical subplots** section of the **Fields** tab.
## Add fields to a drillthrough table
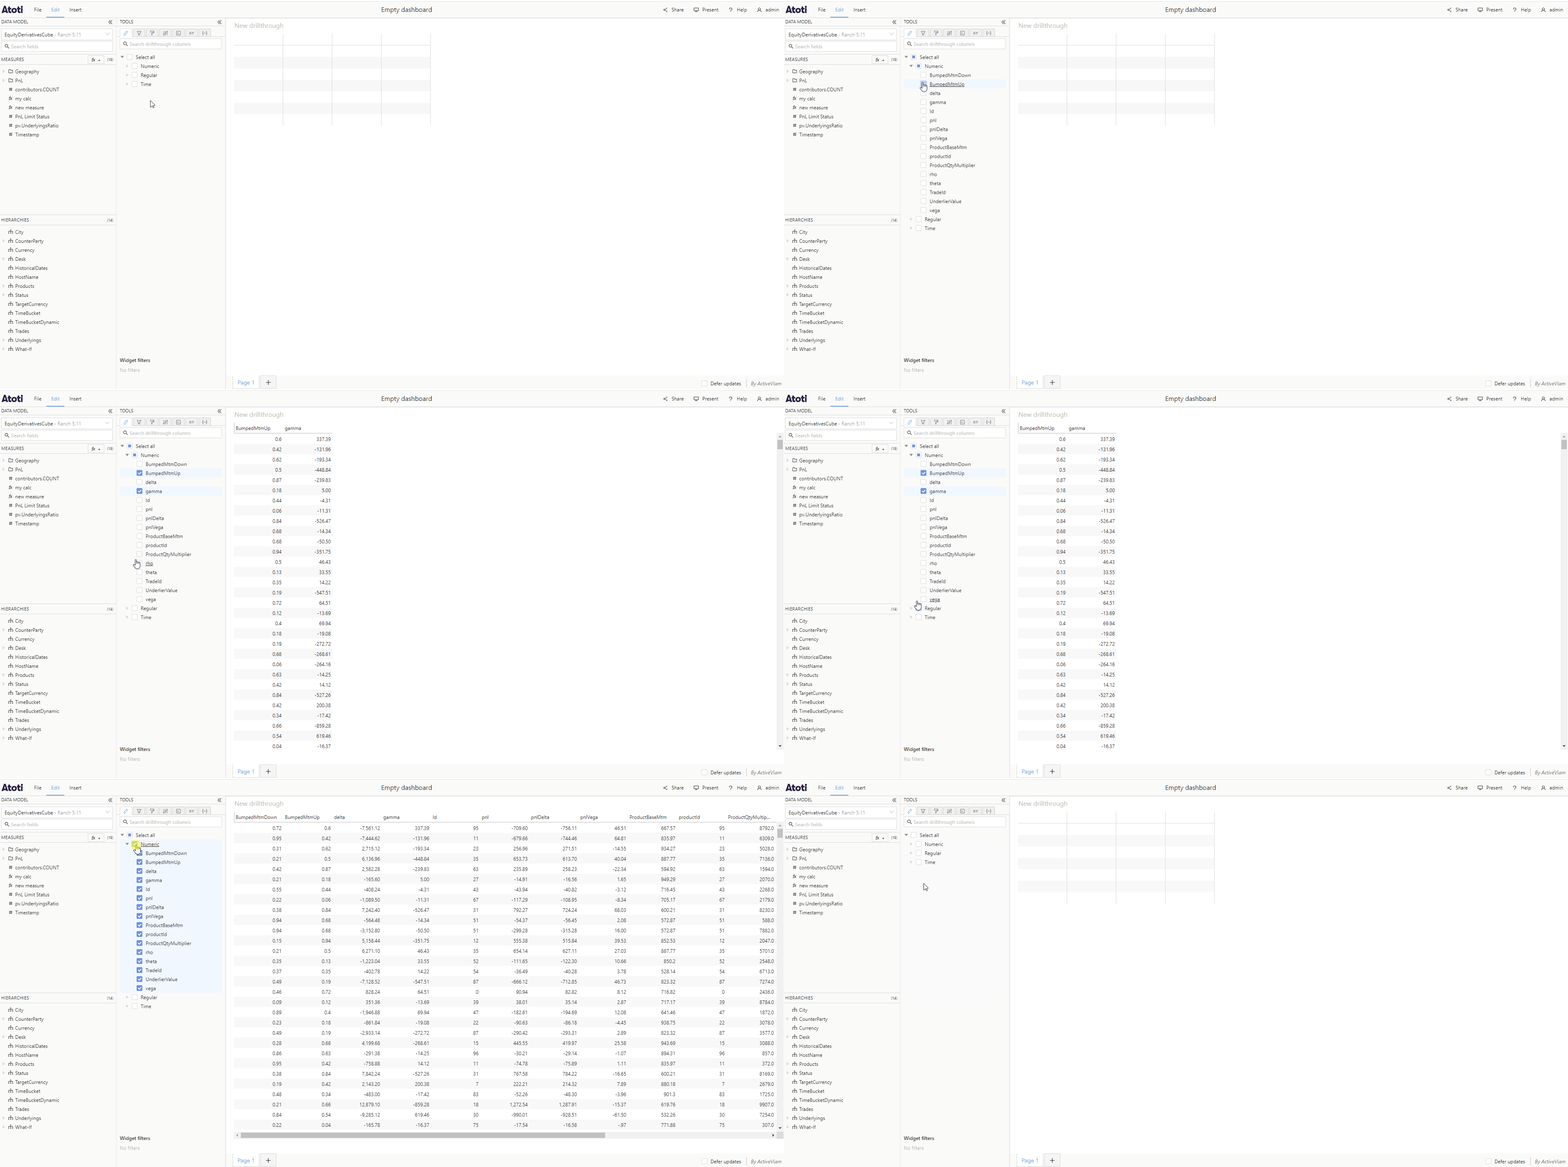
When you add a new [drillthrough table](../../analyze-data/drillthrough#add-a-drillthrough-table) to your dashboard, in the **Fields** tab you will see some checkboxes. Depending on your [settings](../../../developer-guide/customize-atoti-ui/user-settings) some of these may already be checked.
There are 3 different types of column you can add to a drillthrough widget :
* Numeric
* Regular
* Time
Checking the checkbox next to any of these will add all columns of that type to the drillthrough. To choose certain columns to add to the drillthrough table, click the caret icon to expand the full list of that type, then check the ones you wish to include. You can also use the search bar to quickly find the columns you want.
The list of columns you can add to a drillthrough widget may be different from
the list of columns available to build other widgets. The
[cube](../../navigate-atoti-ui/data-model#cube) data structure often acts as a
semantic layer on top of the raw data, reflecting the user perspective of the
data.
### Horizontal and vertical subplots
Subplots (also known as facet plots or trellis plots) are groups of mini charts with a common scale and axes. Each subplot represents a different item from a selected hierarchy.
To break a chart out into subplots:
* Add a hierarchy to the **Horizontal subplots** and/or **Vertical subplots** section of the **Fields** tab.
## Add fields to a drillthrough table
When you add a new [drillthrough table](../../analyze-data/drillthrough#add-a-drillthrough-table) to your dashboard, in the **Fields** tab you will see some checkboxes. Depending on your [settings](../../../developer-guide/customize-atoti-ui/user-settings) some of these may already be checked.
There are 3 different types of column you can add to a drillthrough widget :
* Numeric
* Regular
* Time
Checking the checkbox next to any of these will add all columns of that type to the drillthrough. To choose certain columns to add to the drillthrough table, click the caret icon to expand the full list of that type, then check the ones you wish to include. You can also use the search bar to quickly find the columns you want.
The list of columns you can add to a drillthrough widget may be different from
the list of columns available to build other widgets. The
[cube](../../navigate-atoti-ui/data-model#cube) data structure often acts as a
semantic layer on top of the raw data, reflecting the user perspective of the
data.
 Advanced users may control certain aspects of the drillthrough widget, such as
the maximum number of rows, by using [**Context
values**](../../analyze-data/context-values).
## Add a multilevel hierarchy to a widget
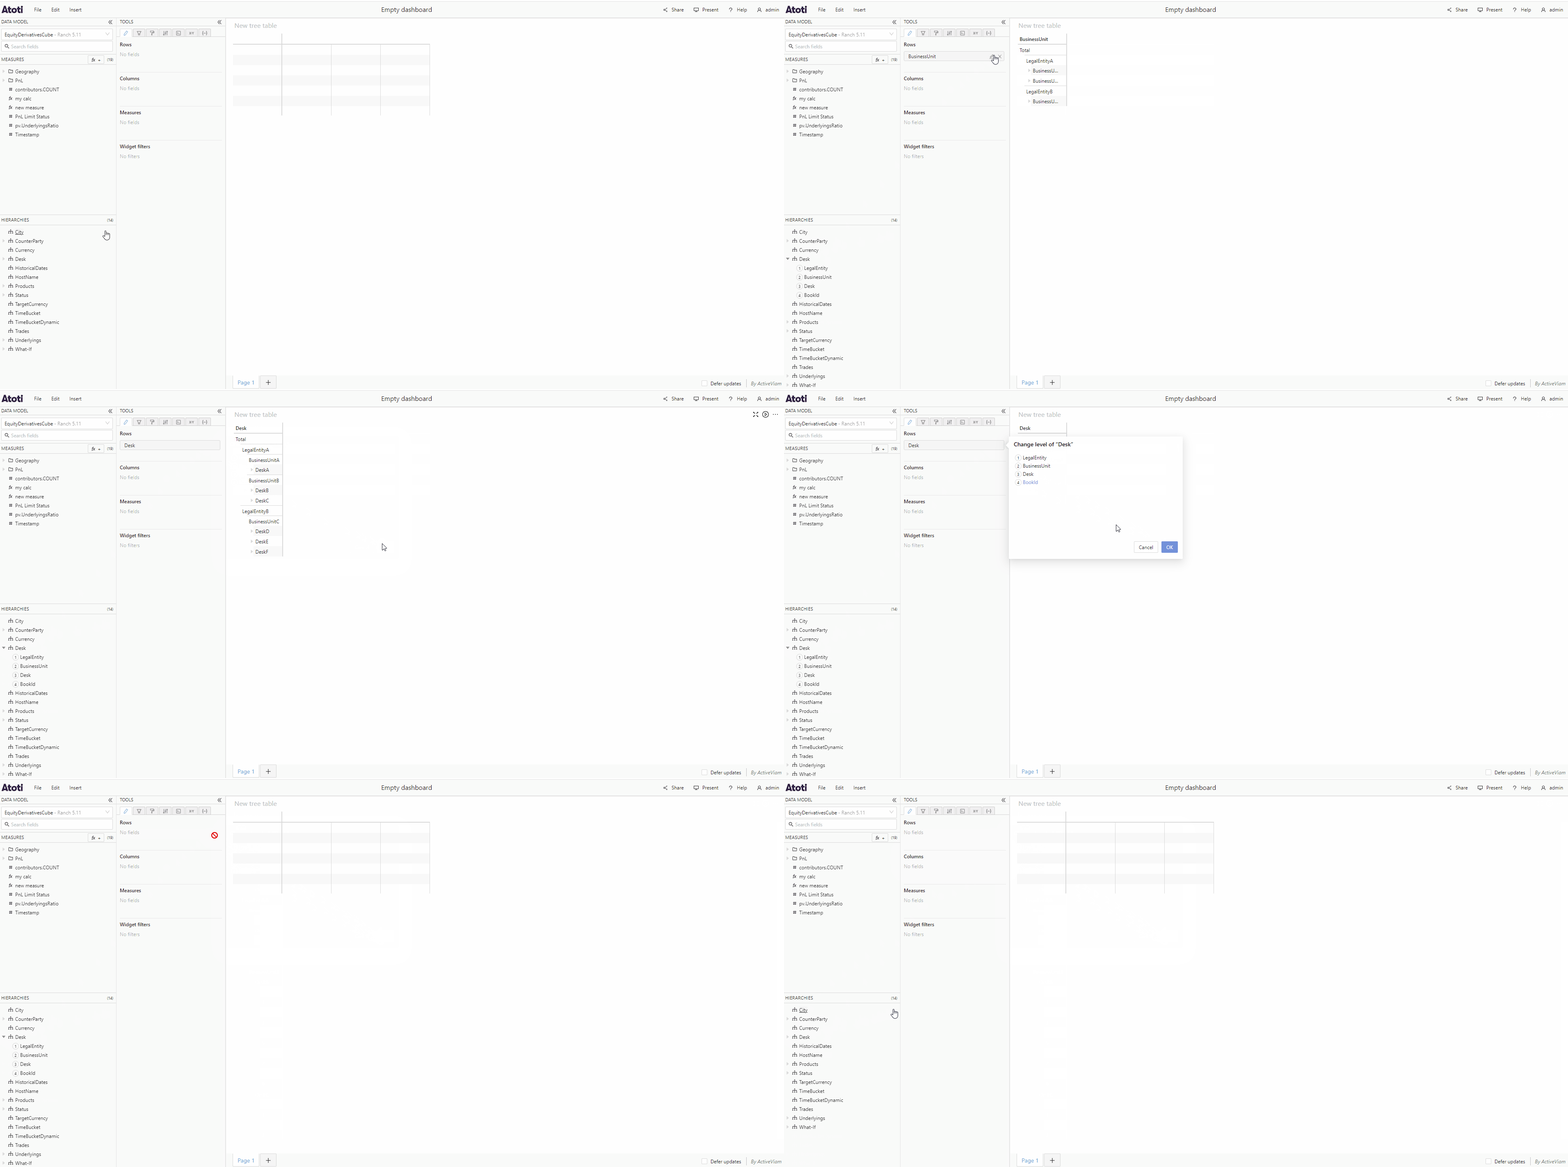
Multilevel hierarchies are recognizable in the data model by the expansion caret next to their name. If you click this caret, you will see their levels displayed in a numbered list. You can drag and drop any of these [levels](../../navigate-atoti-ui/data-model#level) in the **Fields** tab to add to it your widget.
You can change the level of a multilevel hierarchy used in your widget by hovering over its tile in the **Fields** tab, then clicking the **edit** icon that appears on the right of the tile. This will open a popup containing a list of the levels in the hierarchy. Click on a level to select it, then click **OK**.
Advanced users may control certain aspects of the drillthrough widget, such as
the maximum number of rows, by using [**Context
values**](../../analyze-data/context-values).
## Add a multilevel hierarchy to a widget
Multilevel hierarchies are recognizable in the data model by the expansion caret next to their name. If you click this caret, you will see their levels displayed in a numbered list. You can drag and drop any of these [levels](../../navigate-atoti-ui/data-model#level) in the **Fields** tab to add to it your widget.
You can change the level of a multilevel hierarchy used in your widget by hovering over its tile in the **Fields** tab, then clicking the **edit** icon that appears on the right of the tile. This will open a popup containing a list of the levels in the hierarchy. Click on a level to select it, then click **OK**.
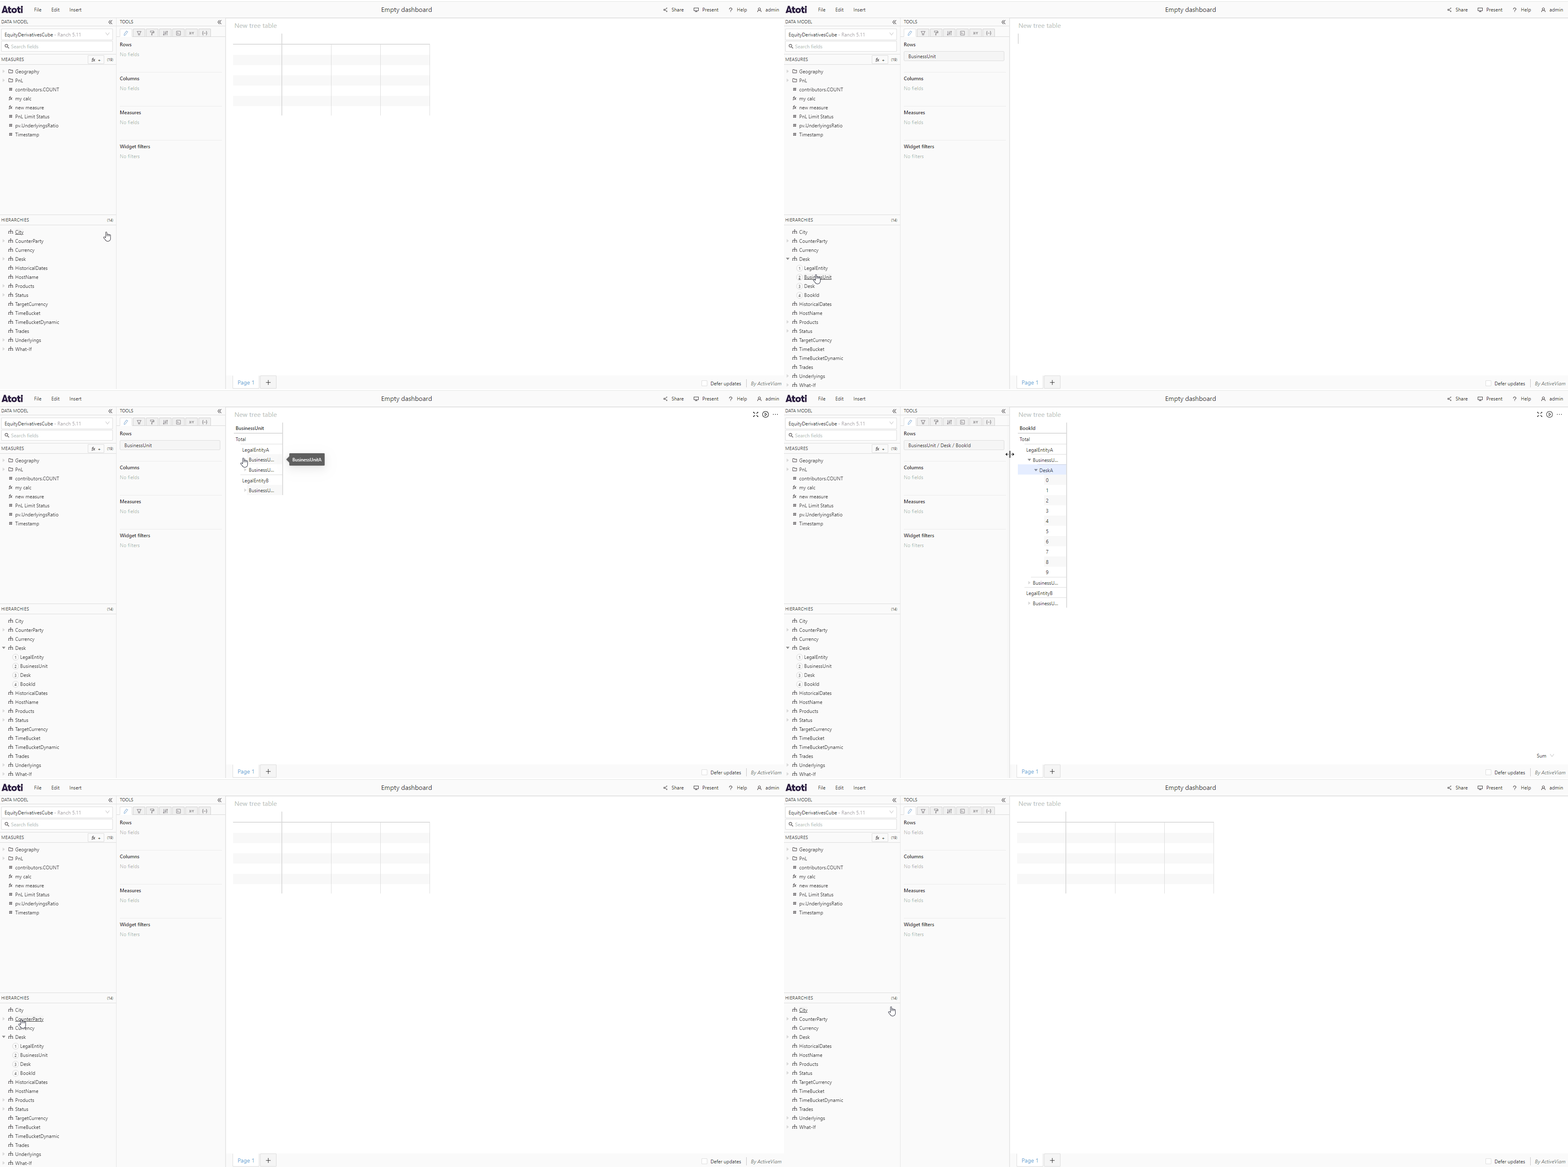
 ### Add a multilevel hierarchy to a pivot table or tree table widget
Pivot table and tree table widgets allow you to [drill down](../../analyze-data/drill-down) level members to reveal their subtotals and children.
You can add a multilevel hierarchy to a pivot table or tree table as above, by dragging and dropping it in the **Fields** tab, or by dragging it directly onto a member in your widget.
When you add a level of a multilevel hierarchy with parent levels to a pivot table or tree table widget, the members of these parent levels will be visible and it will not be possible to collapse them. However, if the chosen level has child levels, you will be able to drill down its members and its descendants. For example, if your hierarchy has four levels, *Continent*, *Country*, *Region*, and *City* and you add the second level, *Country*, to your widget, you will see all members of *Continent* and *Country* and you will be able to drill down any country to see its regions and cities.
### Add a multilevel hierarchy to a pivot table or tree table widget
Pivot table and tree table widgets allow you to [drill down](../../analyze-data/drill-down) level members to reveal their subtotals and children.
You can add a multilevel hierarchy to a pivot table or tree table as above, by dragging and dropping it in the **Fields** tab, or by dragging it directly onto a member in your widget.
When you add a level of a multilevel hierarchy with parent levels to a pivot table or tree table widget, the members of these parent levels will be visible and it will not be possible to collapse them. However, if the chosen level has child levels, you will be able to drill down its members and its descendants. For example, if your hierarchy has four levels, *Continent*, *Country*, *Region*, and *City* and you add the second level, *Country*, to your widget, you will see all members of *Continent* and *Country* and you will be able to drill down any country to see its regions and cities.