> ## Documentation Index
> Fetch the complete documentation index at: https://docs.activeviam.com/llms.txt
> Use this file to discover all available pages before exploring further.
# About widgets
> What widgets are in Atoti UI, covering the Widgets panel, and the available types including pivot tables, tree tables, flat tables, drillthrough tables, KPI and comparison KPI widgets, and Plotly chart types including line, column, bar, pie, and scatter.
Widgets are the building blocks of [dashboards](../dashboards). They allow you to organize, view, and derive meaning from your data. Select the data to display in a widget with [fields](./add-fields). [Filters](../filters/add-a-filter) are applied to refine the data displayed. Widgets can be [sorted](../../analyze-data/sort-data) and [switched](./add-or-modify-widgets#switch-widget-type) between different types. You can turn on [real-time](../../analyze-data/refresh-dashboard-data#turn-on-real-time) to ensure a widget always has the latest data updates. You can also [share widgets](../share-content#share-a-widget) with others in your organization so they can add them to their own dashboards, or [export](../../exports/export-to-csv-or-pdf#export-to-csv) the data to CSV. You can use the [style tab](./style-a-widget/edit-the-style-of-a-widget) to modify the appearance of a widget, for example change the colors of table cells or chart traces.
## Widgets panel
The **Widgets panel** contains all of the available widgets in your application. It is located to the right of the **Tools panel** and can be collapsed, hidden, or expanded.
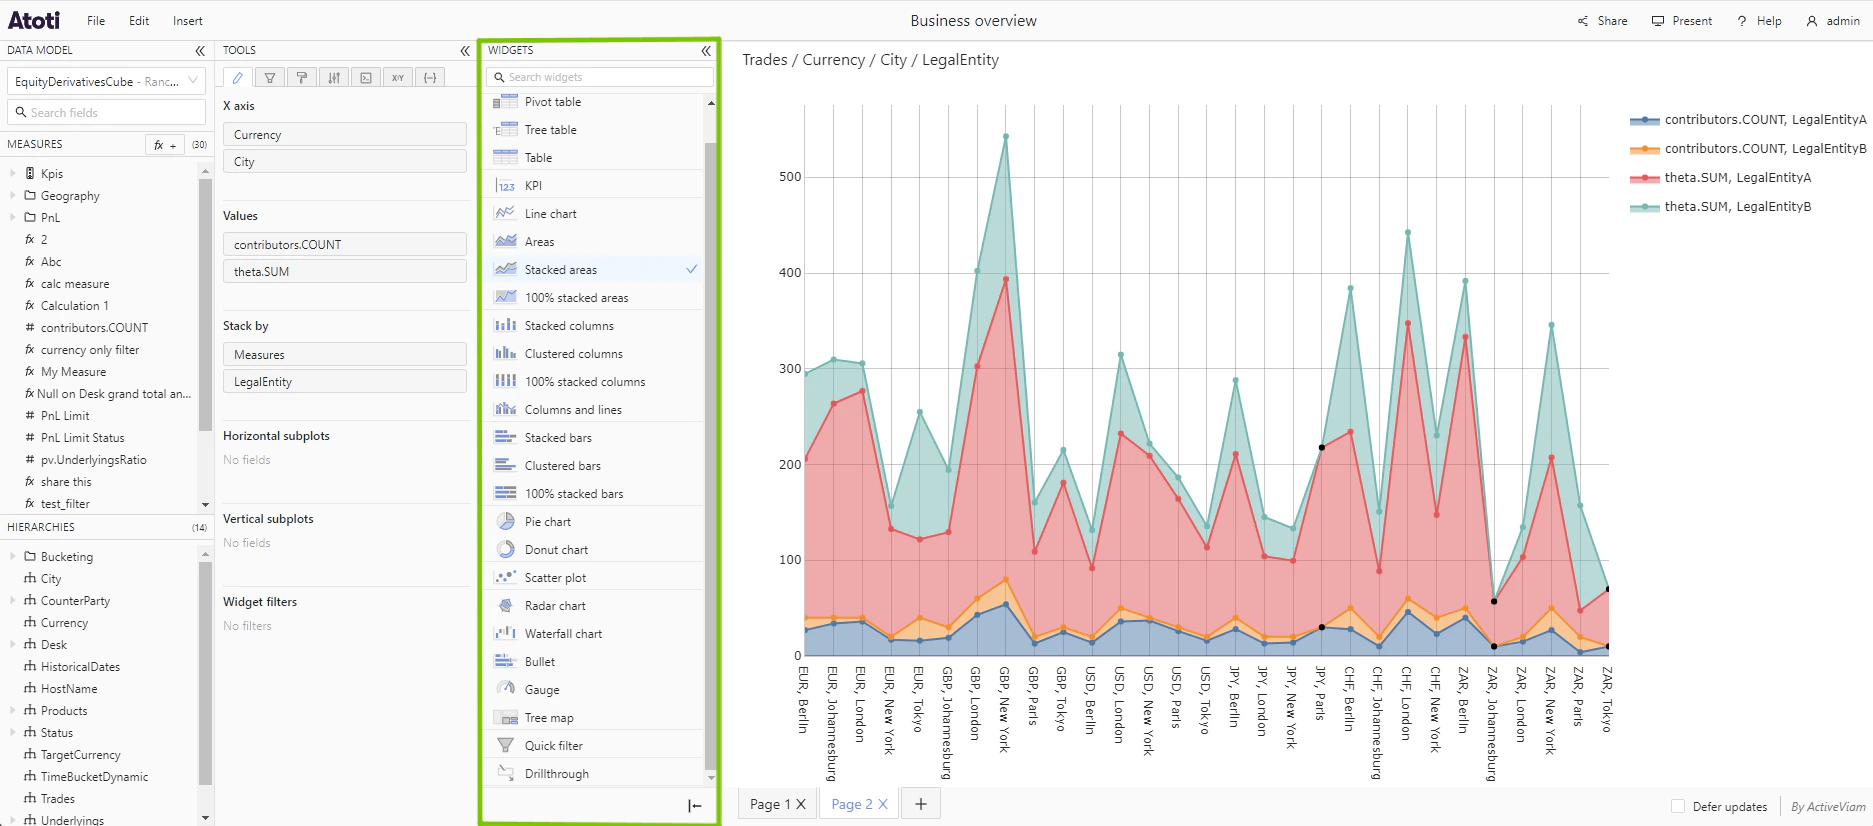 This panel can be used to:
* [Add new widgets](./add-or-modify-widgets#add-a-new-widget).
* [Switch](./add-or-modify-widgets#switch-widget-type) the type of a widget.
The **Widgets panel** can be expanded or collapsed by clicking the arrows in the top right corner. It can be resized by dragging from the right edge.
This panel can be used to:
* [Add new widgets](./add-or-modify-widgets#add-a-new-widget).
* [Switch](./add-or-modify-widgets#switch-widget-type) the type of a widget.
The **Widgets panel** can be expanded or collapsed by clicking the arrows in the top right corner. It can be resized by dragging from the right edge.
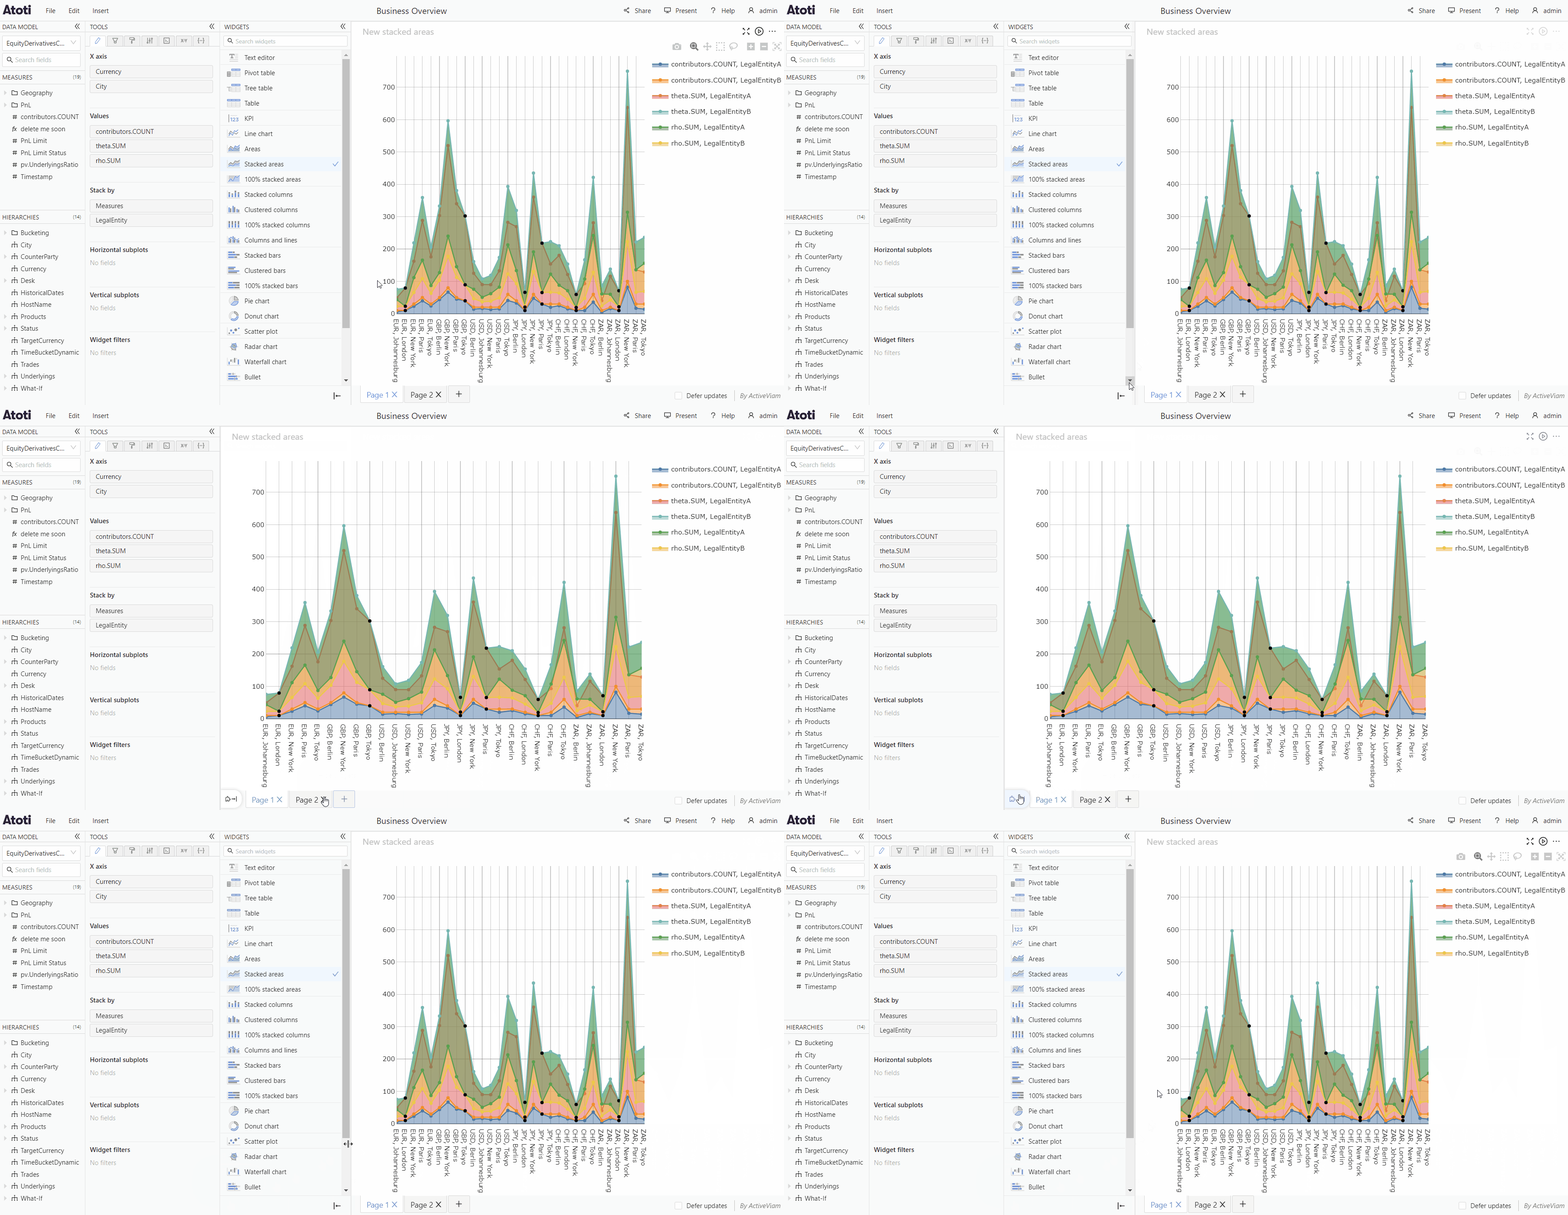
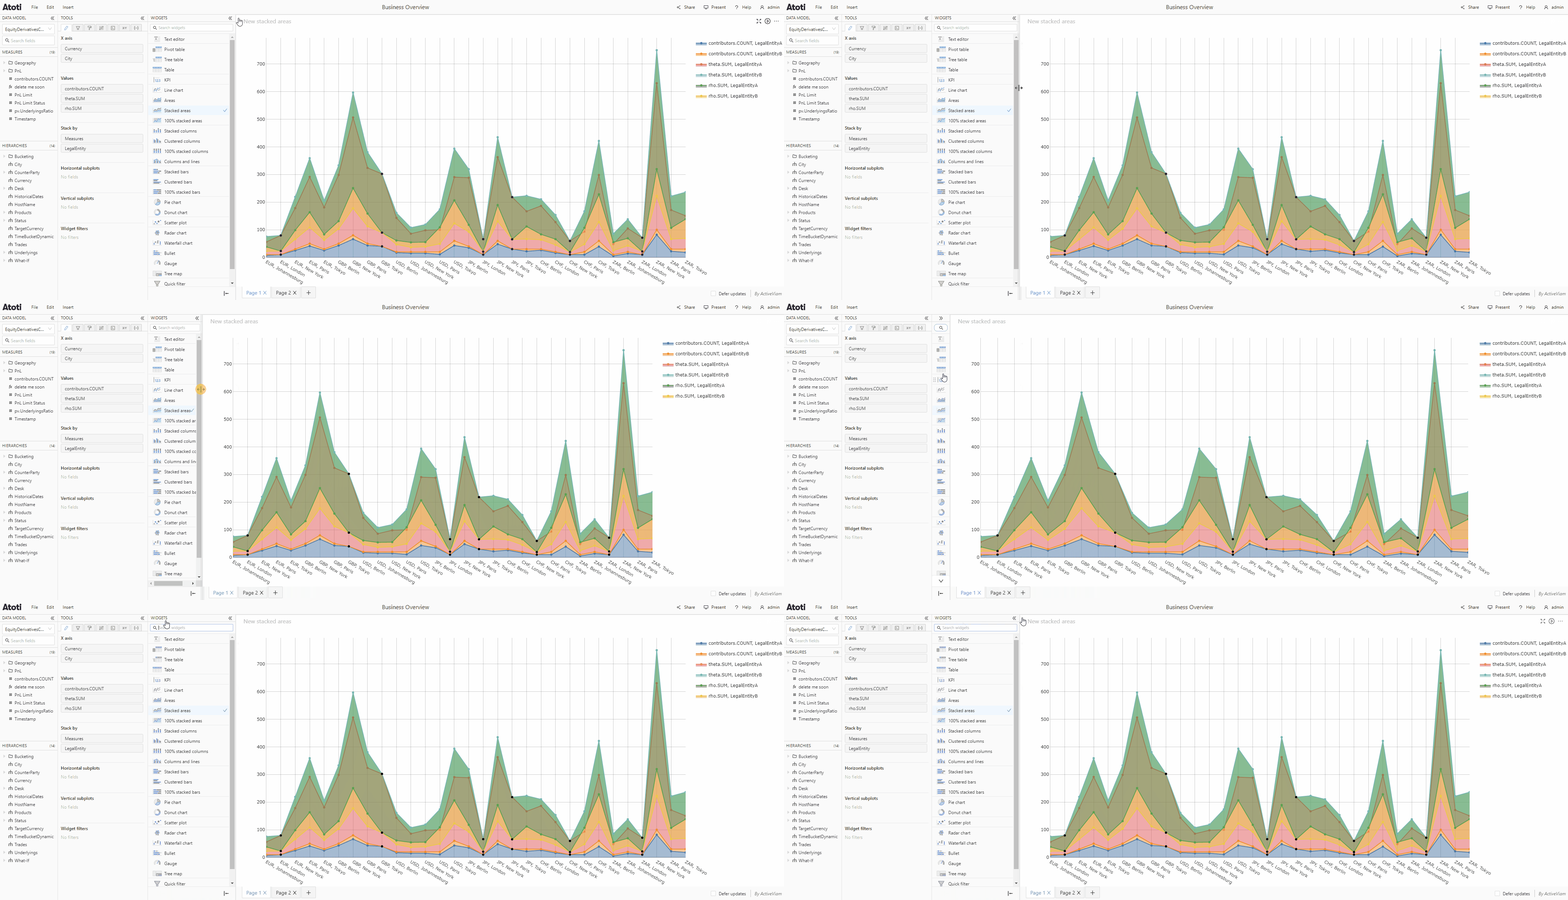 The **Widgets panel** can be hidden by clicking the arrow at the bottom of the panel. It can be shown again by clicking the button attached to the bottom right of the **Tools panel**.
 ## Types of widgets
Many different types of widgets are available in the application. The majority are used to visualize data, for example, a **Pivot table** or a **Line chart**, but some widgets also provide extra controls or information for the user, for example, the **Text editor**.
Widgets are plugins, so your application may not include all of the widget
types listed here. If you cannot find a specific widget type in your **Widgets
panel**, contact your system administrator.
### Tables
There are different types of table widgets available in the application.
* Pivot table
* Tree table
* Table
* Drillthrough table
A [**Pivot table**](https://en.wikipedia.org/wiki/Pivot_table) displays aggregated data, structured in a tree and organized as logical hierarchies and levels. It allows you to [drill down](../../analyze-data/drill-down) level members to reveal their subtotals and children.
A **Tree table** is similar to a pivot table, but the columns of its row header are condensed into a single column, displayed as a tree.
A [**Table**](https://en.wikipedia.org/wiki/Table_\(information\)) is more suited to displaying flat data and it does not have the drill down functionality. The **Table** has a breaking sort, meaning when a sort is applied the members in a column are sorted without regard to the hierarchy, whereas **Pivot tables** and **Tree tables** have a non-breaking sort, see [sort data](../../analyze-data/sort-data).
The **Drillthrough** table displays all the underlying facts (also referred to as **records** or **contributors**) that contribute to a specific [cube](../../navigate-atoti-ui/data-model#cube) location. See the [Microsoft documentation](https://learn.microsoft.com/en-us/sql/mdx/mdx-data-manipulation-drillthrough?view=sql-server-ver16) for more details.
### KPI widgets
**KPI** widgets allow you to see the values of high level indicators at a glance.
There are two types of KPI configurations:
* **KPI** - shows the totals for the members of the added hierarchy for each added measure.
* **Comparison KPI** - enables you to compare values for 2 members from the same hierarchy. For example, you could choose to compare values for *USD* and *GBP* from the *Currency* hierarchy.
KPI widgets are often used to compare values across 2 dates. In this situation, the *"Compare current date to previous date"* option allows to always compare the latest 2 dates. This way, the widget remains relevant day after day, even when new data comes in.
This feature is only available for slicing hierarchies within dimensions of type `"TIME"`.
### Charts
Atoti UI uses [Plotly](https://plotly.com/javascript/) charts for chart based data visualization. The available **Plotly** charts are:
| Line charts | Column charts | Bar charts | Pie charts | Other |
| ------------------ | -------------------- | ----------------- | ----------- | ---------------- |
| Line chart | Stacked columns | Stacked bars | Pie chart | Scatter plot |
| Areas | Clustered columns | Clustered bars | Donut chart | Radar chart |
| Stacked areas | 100% stacked columns | 100% stacked bars | | Waterfall chart |
| 100% stacked areas | Columns and lines | | | Bullet chart |
| | | | | Gauge |
| | | | | Tree map |
| | | | | 3D surface chart |
| | | | | Sunburst chart |
## Types of widgets
Many different types of widgets are available in the application. The majority are used to visualize data, for example, a **Pivot table** or a **Line chart**, but some widgets also provide extra controls or information for the user, for example, the **Text editor**.
Widgets are plugins, so your application may not include all of the widget
types listed here. If you cannot find a specific widget type in your **Widgets
panel**, contact your system administrator.
### Tables
There are different types of table widgets available in the application.
* Pivot table
* Tree table
* Table
* Drillthrough table
A [**Pivot table**](https://en.wikipedia.org/wiki/Pivot_table) displays aggregated data, structured in a tree and organized as logical hierarchies and levels. It allows you to [drill down](../../analyze-data/drill-down) level members to reveal their subtotals and children.
A **Tree table** is similar to a pivot table, but the columns of its row header are condensed into a single column, displayed as a tree.
A [**Table**](https://en.wikipedia.org/wiki/Table_\(information\)) is more suited to displaying flat data and it does not have the drill down functionality. The **Table** has a breaking sort, meaning when a sort is applied the members in a column are sorted without regard to the hierarchy, whereas **Pivot tables** and **Tree tables** have a non-breaking sort, see [sort data](../../analyze-data/sort-data).
The **Drillthrough** table displays all the underlying facts (also referred to as **records** or **contributors**) that contribute to a specific [cube](../../navigate-atoti-ui/data-model#cube) location. See the [Microsoft documentation](https://learn.microsoft.com/en-us/sql/mdx/mdx-data-manipulation-drillthrough?view=sql-server-ver16) for more details.
### KPI widgets
**KPI** widgets allow you to see the values of high level indicators at a glance.
There are two types of KPI configurations:
* **KPI** - shows the totals for the members of the added hierarchy for each added measure.
* **Comparison KPI** - enables you to compare values for 2 members from the same hierarchy. For example, you could choose to compare values for *USD* and *GBP* from the *Currency* hierarchy.
KPI widgets are often used to compare values across 2 dates. In this situation, the *"Compare current date to previous date"* option allows to always compare the latest 2 dates. This way, the widget remains relevant day after day, even when new data comes in.
This feature is only available for slicing hierarchies within dimensions of type `"TIME"`.
### Charts
Atoti UI uses [Plotly](https://plotly.com/javascript/) charts for chart based data visualization. The available **Plotly** charts are:
| Line charts | Column charts | Bar charts | Pie charts | Other |
| ------------------ | -------------------- | ----------------- | ----------- | ---------------- |
| Line chart | Stacked columns | Stacked bars | Pie chart | Scatter plot |
| Areas | Clustered columns | Clustered bars | Donut chart | Radar chart |
| Stacked areas | 100% stacked columns | 100% stacked bars | | Waterfall chart |
| 100% stacked areas | Columns and lines | | | Bullet chart |
| | | | | Gauge |
| | | | | Tree map |
| | | | | 3D surface chart |
| | | | | Sunburst chart |