> ## Documentation Index
> Fetch the complete documentation index at: https://docs.activeviam.com/llms.txt
> Use this file to discover all available pages before exploring further.
# Investigations
> How to set up and trigger investigations in Atoti UI using the Behavior tab, by linking a widget's context menu to a dedicated dashboard page that opens filtered on the selected table cell or chart data point.
**Investigations** allow to dig deeper into outlier data points. They can be configured in the **Behavior** tab, and then accessed in the target widget's context menu. The **Investigate** menu item adds a dashboard page of your choosing to your current dashboard, filtered on the selected data point and allowing you to quickly access more information about it.
## Create an investigation dashboard
Investigations are based on a page in a dashboard. This can be a dashboard already in use, or specifically created to be used in an investigation.
## Open the behavior tab
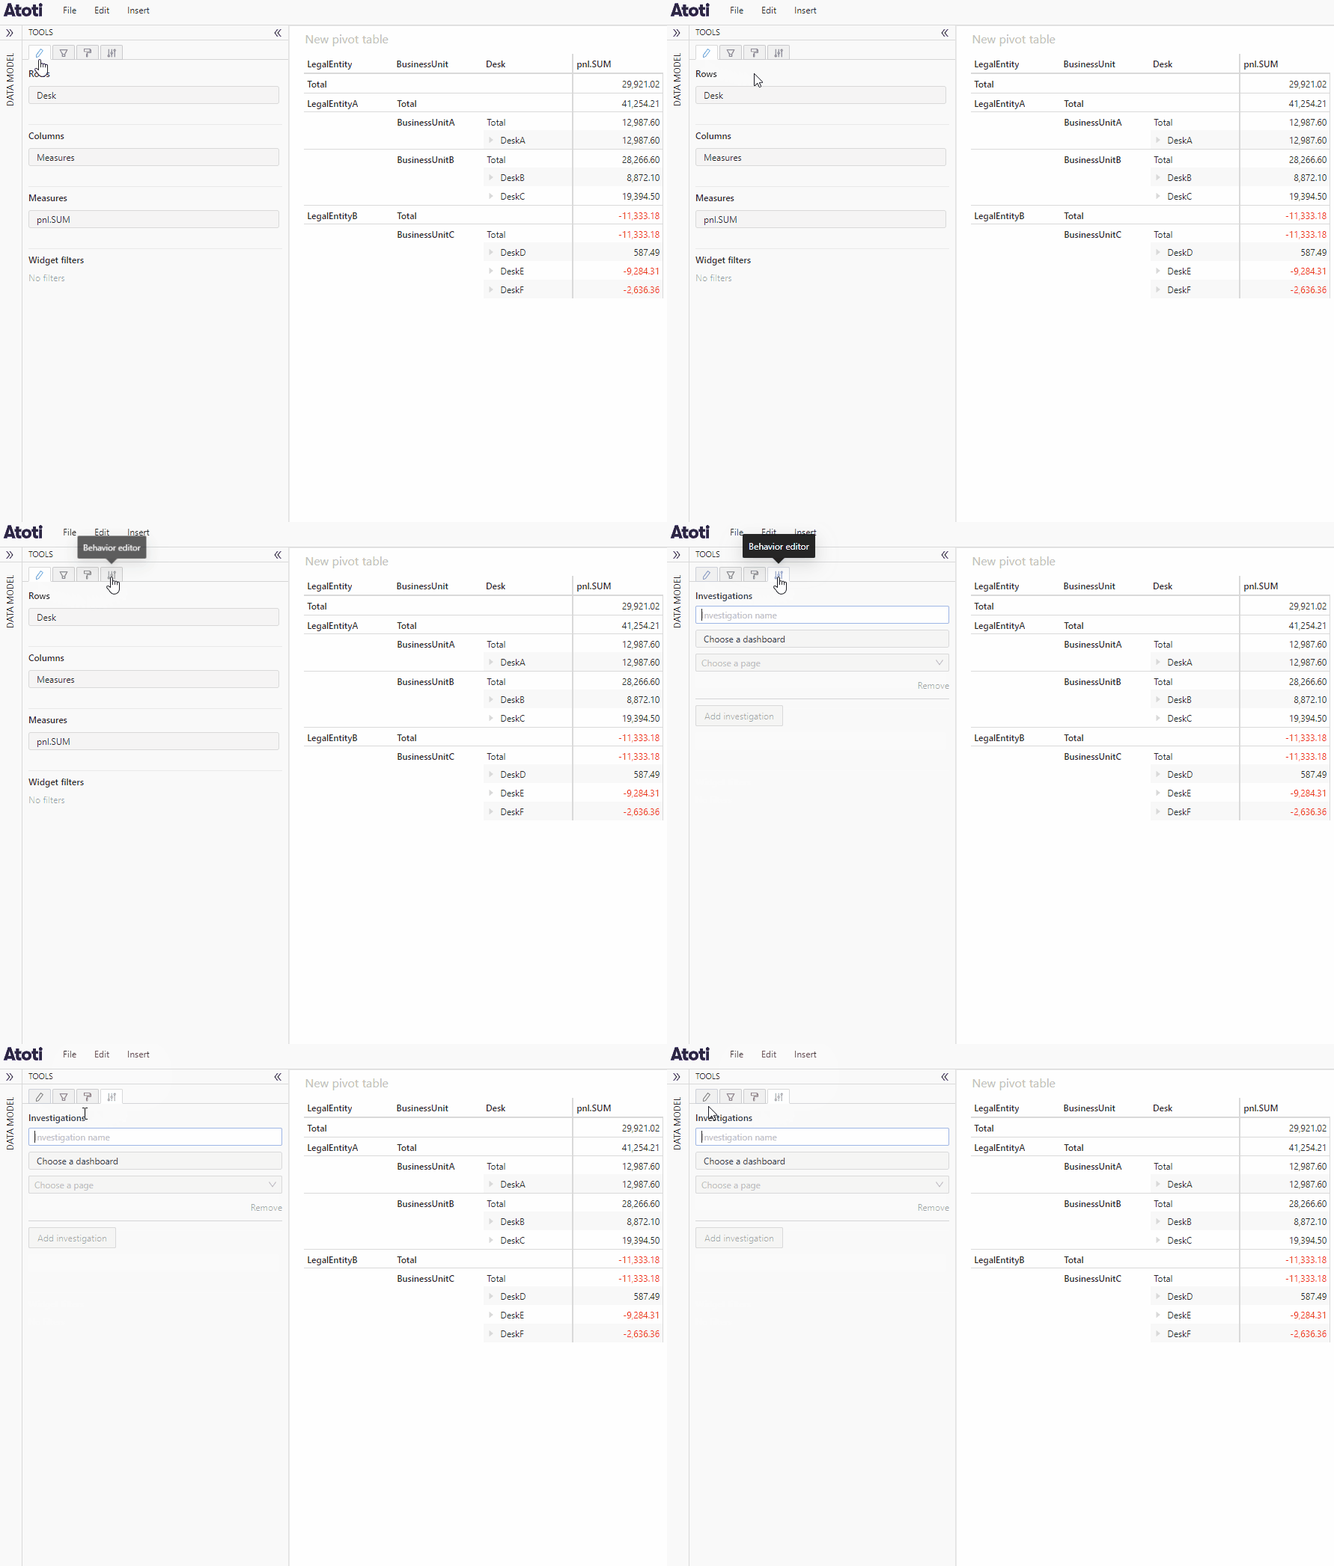
The **Behavior** tab is accessed from the **Tools**, next to the [data model](../navigate-atoti-ui/data-model) on the left of the application. Click on its icon to open it.
 ## Configure an investigation
To add an investigation to a [widget](../create-a-dashboard/widgets/about-widgets):
* Click the **Behavior** icon, next to the [data model](../navigate-atoti-ui/data-model) on the left of the application.
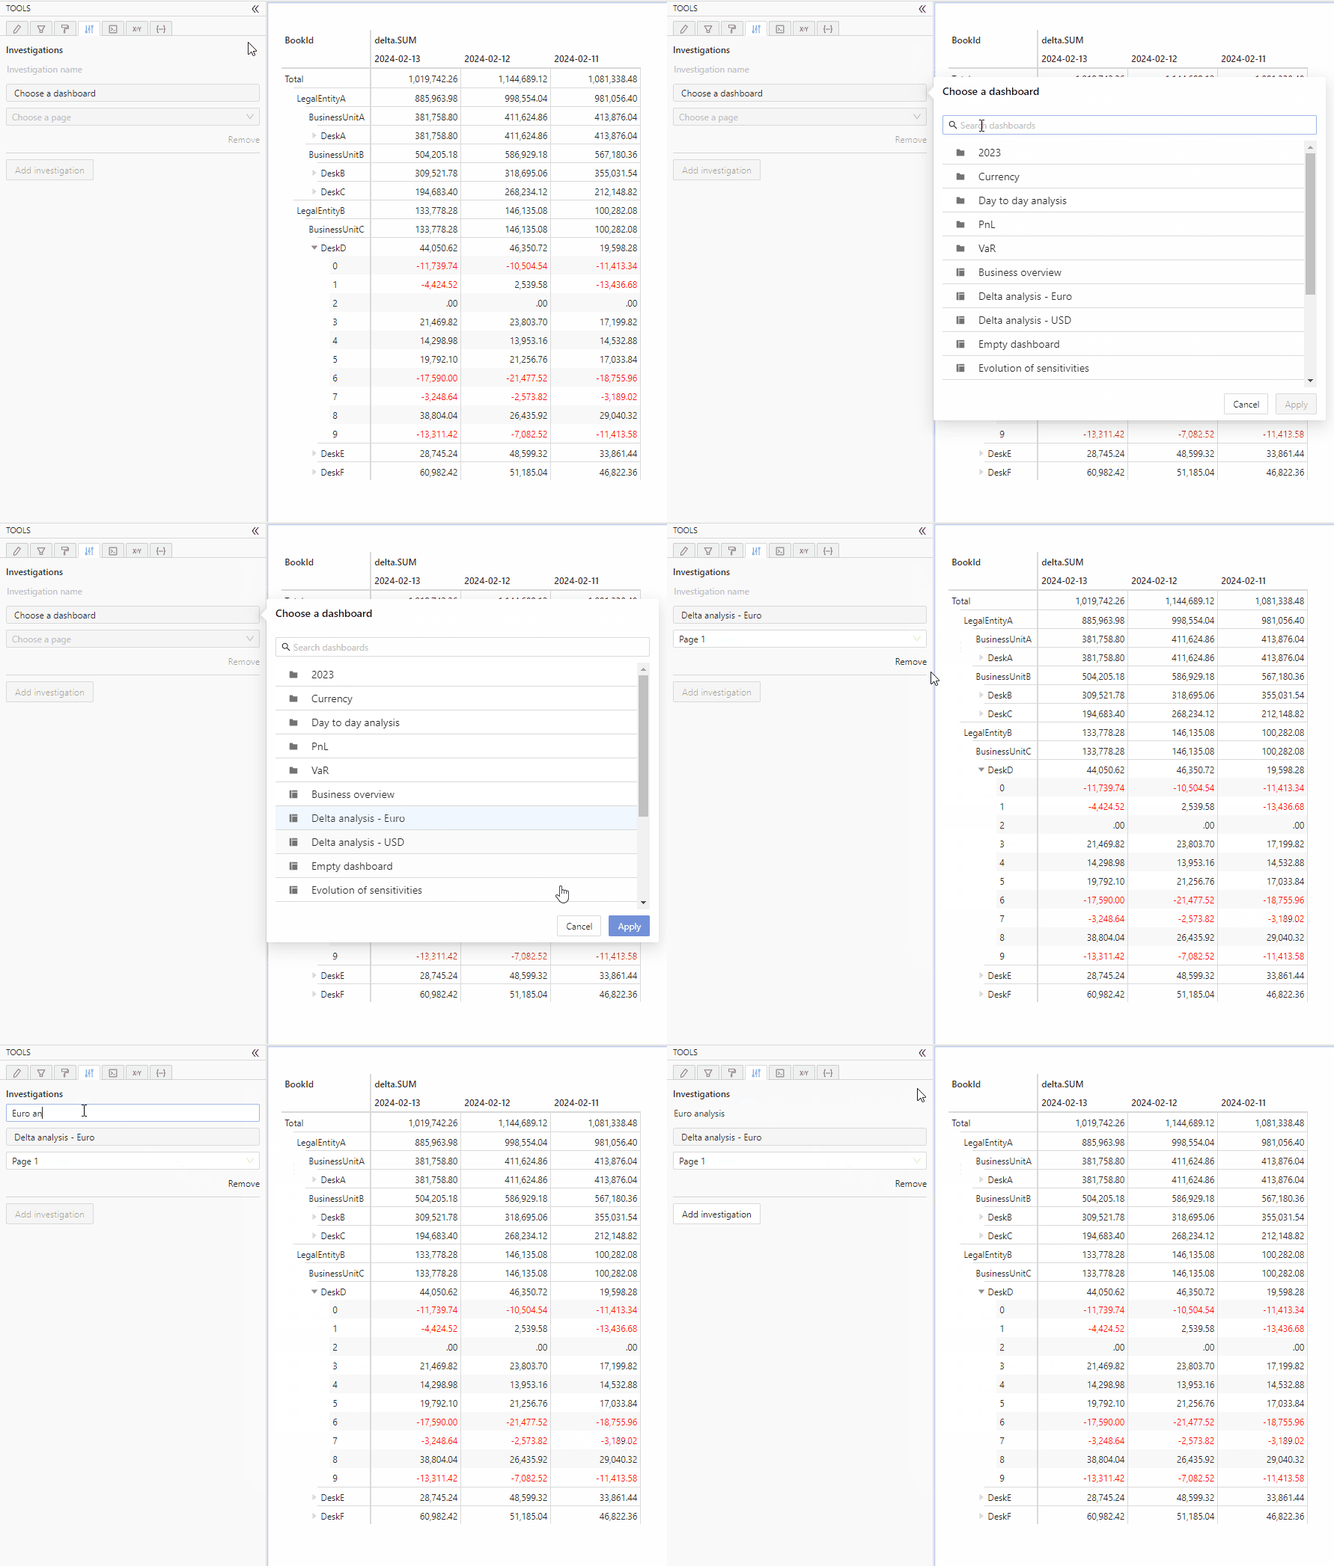
* Type in the name of your investigation. It will allow you to find it in the **Investigate** menu item, in case you add multiple investigations.
* Choose the dashboard to use for your investigation. Note that you can create and save a dedicated dashboard beforehand if needed. To know how, you can read [Create a dashboard](../create-a-dashboard/dashboards#create-a-dashboard).
* If the dashboard page to use for your investigation is not the first page of the chosen dashboard, then select it.
* Repeat the steps above to create multiple investigations.
## Configure an investigation
To add an investigation to a [widget](../create-a-dashboard/widgets/about-widgets):
* Click the **Behavior** icon, next to the [data model](../navigate-atoti-ui/data-model) on the left of the application.
* Type in the name of your investigation. It will allow you to find it in the **Investigate** menu item, in case you add multiple investigations.
* Choose the dashboard to use for your investigation. Note that you can create and save a dedicated dashboard beforehand if needed. To know how, you can read [Create a dashboard](../create-a-dashboard/dashboards#create-a-dashboard).
* If the dashboard page to use for your investigation is not the first page of the chosen dashboard, then select it.
* Repeat the steps above to create multiple investigations.
 ## Use an investigation
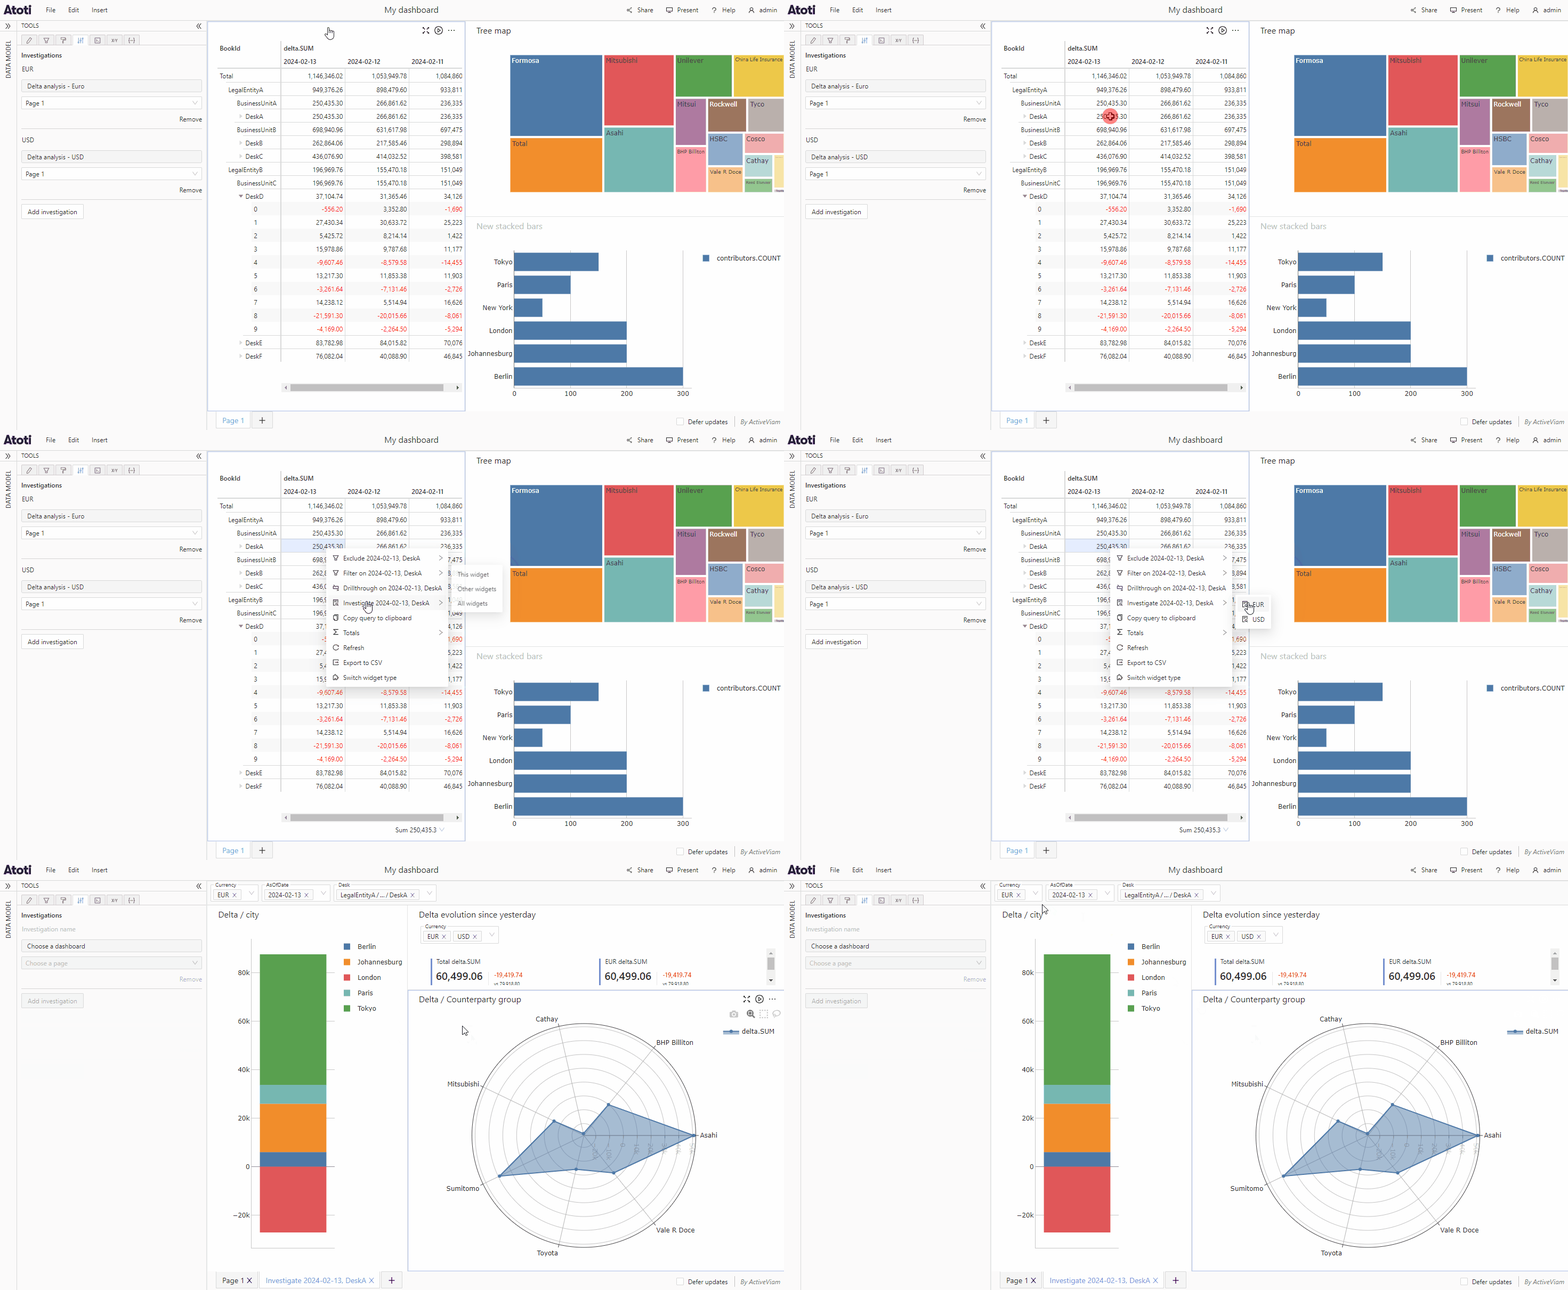
Once you have configured it, to use your investigation right click a table cell or chart point you wish to investigate. In the dropdown menu choose which of the investigations you would like to use. This will open a new page with the selected investigation.
## Use an investigation
Once you have configured it, to use your investigation right click a table cell or chart point you wish to investigate. In the dropdown menu choose which of the investigations you would like to use. This will open a new page with the selected investigation.