> ## Documentation Index
> Fetch the complete documentation index at: https://docs.activeviam.com/llms.txt
> Use this file to discover all available pages before exploring further.

# Status screen

> How to use the Status screen to review and manage limit breaches and warnings, re-evaluate individual limits, and track incident progress.

## Overview

The **Status** screen allows you to review and manage breaches and warnings, which are issued by Atoti Limits when the value of a measure exceeds a threshold specified in the limit.

### Real-time updates

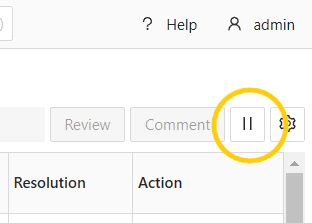
By default, evaluations on this screen are updated in **real-time**. You can disable/enable real-time updates by clicking the pause/play button next to the table configuration button:

<Frame>
  <img src="https://mintcdn.com/activeviam/iy5FyCKdXjhHAnDS/atoti-intelligence/workflows/limits/6.1/images/real-time-disable-button.png?fit=max&auto=format&n=iy5FyCKdXjhHAnDS&q=85&s=4e220bad3792d970a7d196145baadd2e" alt="Real-time updates enable/disable button" width="312" height="223" data-path="atoti-intelligence/workflows/limits/6.1/images/real-time-disable-button.png" />
</Frame>

<Note>
  To have more than 6 open connections for real-time updates, you must have HTTP/2 enabled.
  This is a limitation of [Server-sent events](https://developer.mozilla.org/en-US/docs/Web/API/Server-sent_events),
  which are used to send the updates. You can enable HTTP/2 by setting the `spring.http2.enabled`
  property to `true` in the `application.yml` file. Note that you must be using a secure connection
  for this to work. Please contact your network administrator to [secure your application](https://docs.spring.io/spring-boot/reference/features/ssl.).
</Note>

### Include all limit evaluations

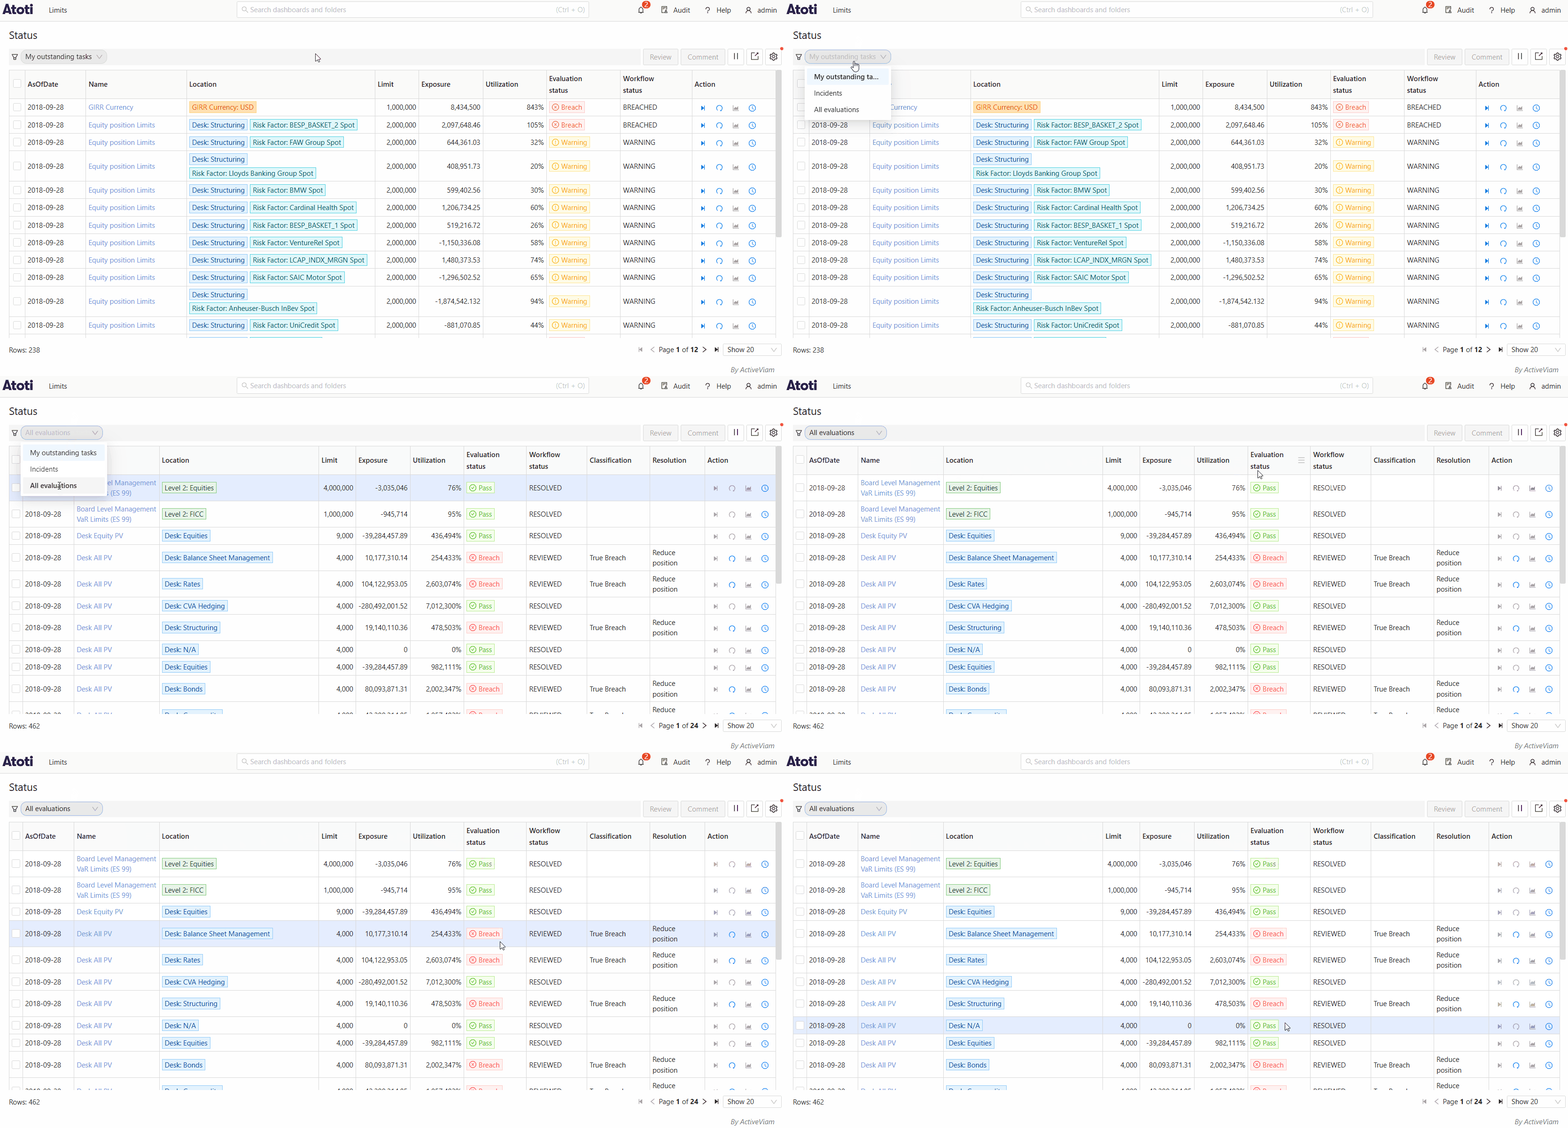
By default, the **Status** screen only displays your outstanding tasks, that is, breaches and warnings that await your action.
However, you can use the switch above the table to display **All evaluations** instead.

<img src="https://mintcdn.com/activeviam/xdqxmncf8zYRCehD/atoti-intelligence/workflows/limits/6.1/images/toggle-all-evaluations.gif?s=d9bf25b81a9628946af8d2941f836387" alt="Status screen toggle" width="1669" height="802" data-path="atoti-intelligence/workflows/limits/6.1/images/toggle-all-evaluations.gif" />

If your server is configured to store “passes” as well (i.e. evaluations that do not result in a breach or warning) by having set the [`limits.incident.evaluation.include-passes`](../properties/property-files/application-yml#section-incidents) property to `true`,
an additional option will be present to only show **Incidents** and filter out the passes.
<Warning>
  Enabling this setting may pollute the **Status** screen with a large amount of entries, and may reduce performance.
</Warning>

## Table columns

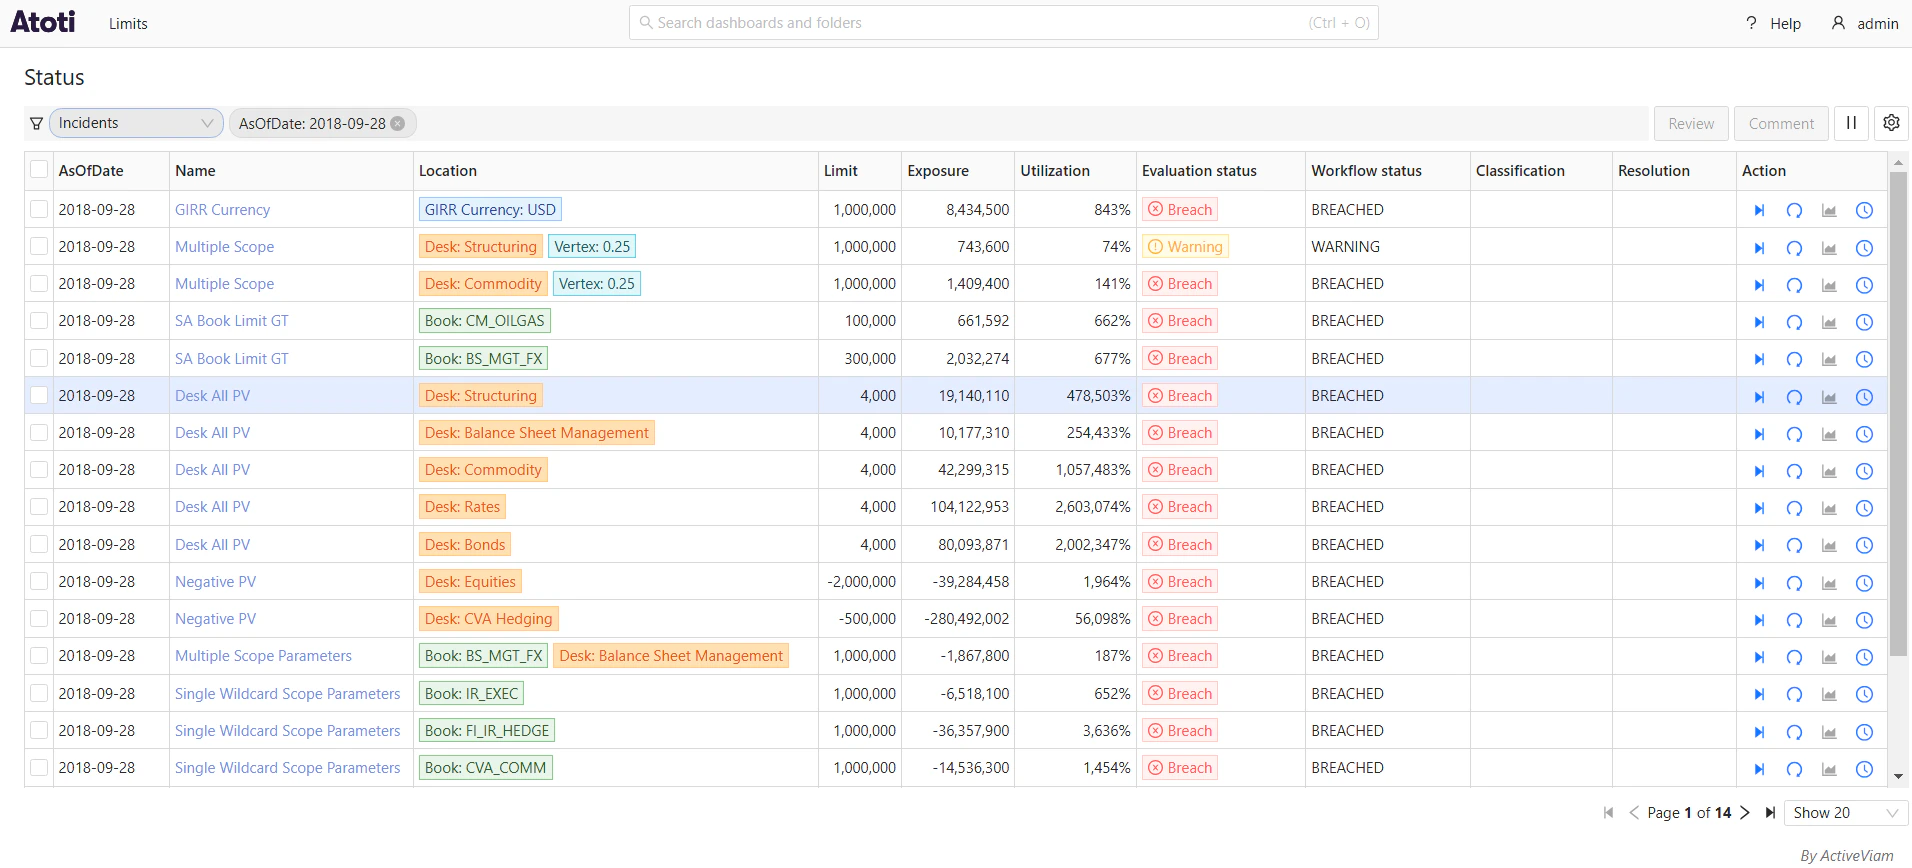
The screen contains a table displaying your breaches and warnings.

<img src="https://mintcdn.com/activeviam/xdqxmncf8zYRCehD/atoti-intelligence/workflows/limits/6.1/images/status-screen.png?fit=max&auto=format&n=xdqxmncf8zYRCehD&q=85&s=db37b1652b011675e29d9b0f1bd44784" alt="Status screen" width="1912" height="868" data-path="atoti-intelligence/workflows/limits/6.1/images/status-screen.png" />

<Note>
  The image above shows two columns, Classification and Resolution, which are part of the default **incidents** workflow. These columns are not listed in the table below because their Field Name and Description are dynamically generated.
  If a customized workflow is selected during the Review Process while creating the limit structure, different columns may appear in place of or alongside these.
</Note>

<table><thead><tr><th>Field Name</th><th>Description</th></tr></thead><tbody><tr><td>AsOfDate</td><td>The AsOfDate of the incident.</td></tr><tr><td>Name</td><td>The limit’s name.</td></tr><tr><td>Location</td><td>Location in the cube where the incident occurred. For example, if the limit was defined for each book, the location displays the book with the breach.</td></tr><tr><td>Limit</td><td>The limit value, which is the threshold that was checked against.</td></tr><tr><td>Exposure</td><td>The value of the measure we are comparing the limit against.</td></tr><tr><td>Utilization</td><td>The utilization of a limit on evaluation.</td></tr><tr><td>Incident Type</td><td>Specifies whether the incident is a <strong>Warning</strong>, <strong>Breach</strong> or <strong>Pass</strong>.</td></tr><tr><td>Evaluation status</td><td>The status of the limit evaluation.</td></tr><tr><td>Action</td><td>The actions you can carry out on the entry. You can perform workflow actions on incidents, re-evaluate entries, and view any <a href="../using-limits/limits-inventory">linked dashboards</a>. When viewing linked dashboards, navigating from the status screen applies the scope and as-of-date of the limit to the linked dashboard.</td></tr></tbody></table>

## Filters

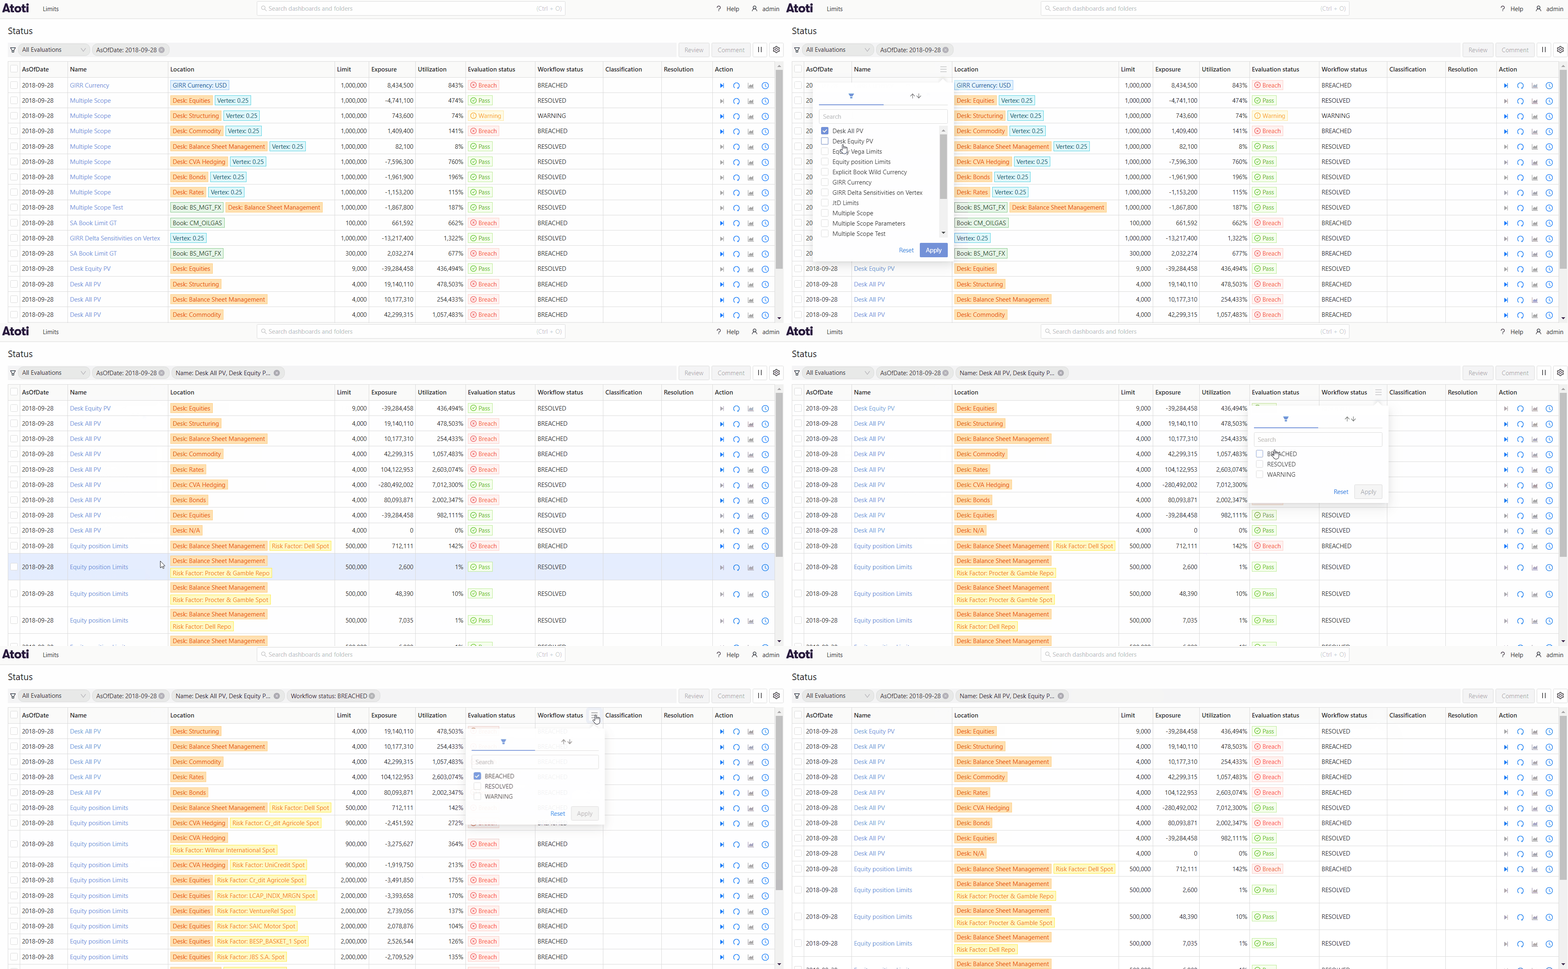
You can filter the evaluations using the column filters:

<Tip>
  Filters on this screen are saved and re-applied when you next open it.
</Tip>

<img src="https://mintcdn.com/activeviam/xdqxmncf8zYRCehD/atoti-intelligence/workflows/limits/6.1/images/status-screen-filters.gif?s=52928081d79b5486fb223e170ef22321" alt="Status screen filters" width="1905" height="786" data-path="atoti-intelligence/workflows/limits/6.1/images/status-screen-filters.gif" />

<Tip>
  You can pre-filter the status screen by including one or more `incidentIds` as a query parameter in the URL. This is
  especially useful for sharing direct links to outstanding tasks, such as in email notifications.
</Tip>

To learn about reviewing breaches and checking the Audit log, see [Manage incidents](./review-incidents).